. 2022 Aug 23;40(8):111280.
doi: 10.1016/j.celrep.2022.111280.

Astrocyte calcium dysfunction causes early network hyperactivity in Alzheimer's disease

Affiliations

Astrocyte calcium dysfunction causes early network hyperactivity in Alzheimer's disease

Disha Shah et al. Cell Rep. .

Abstract

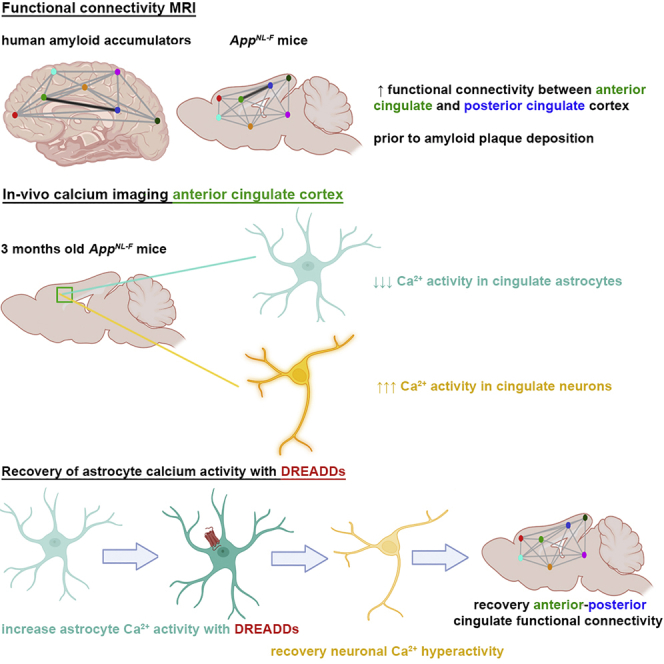
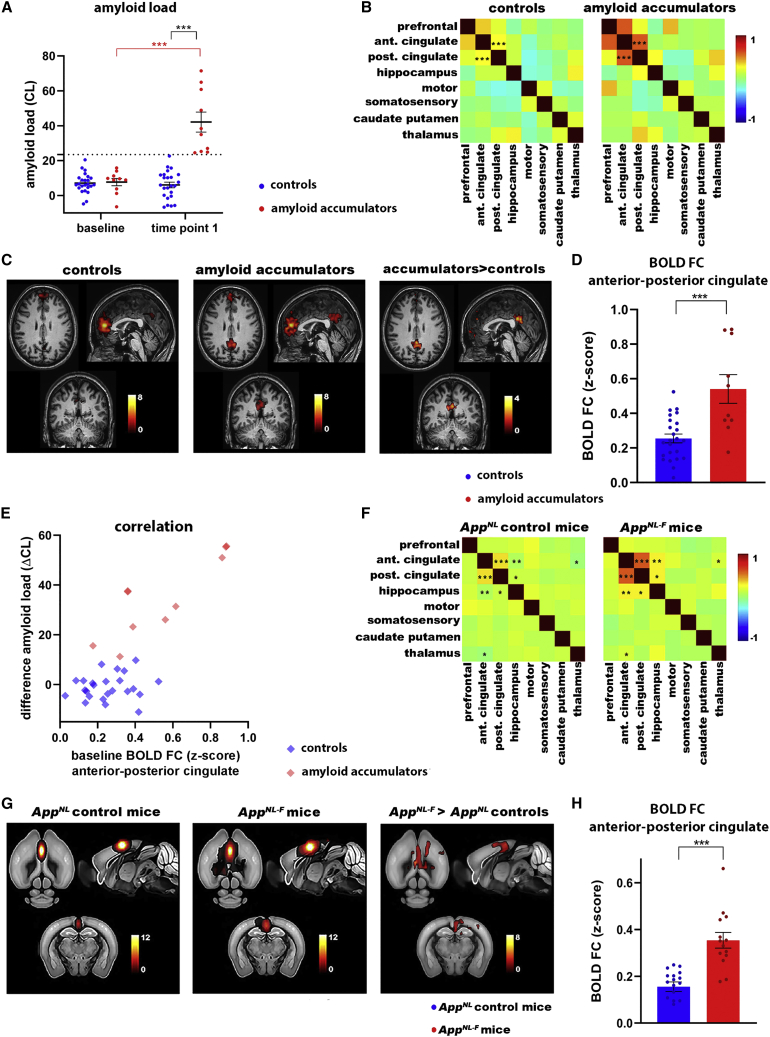
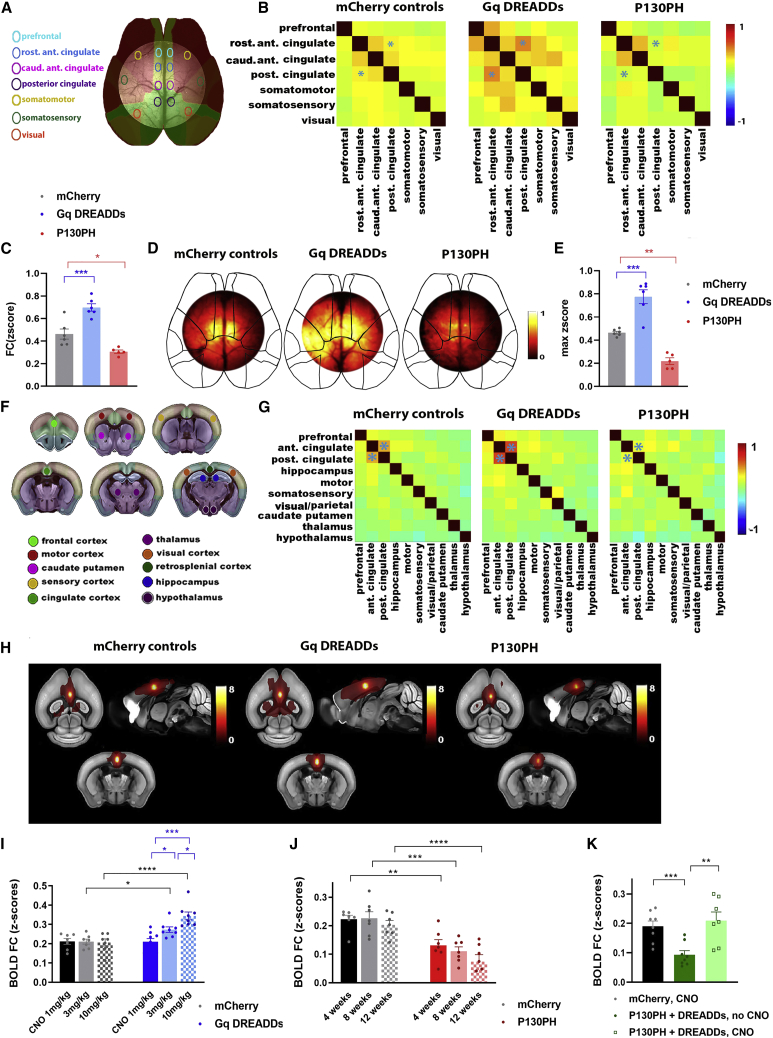
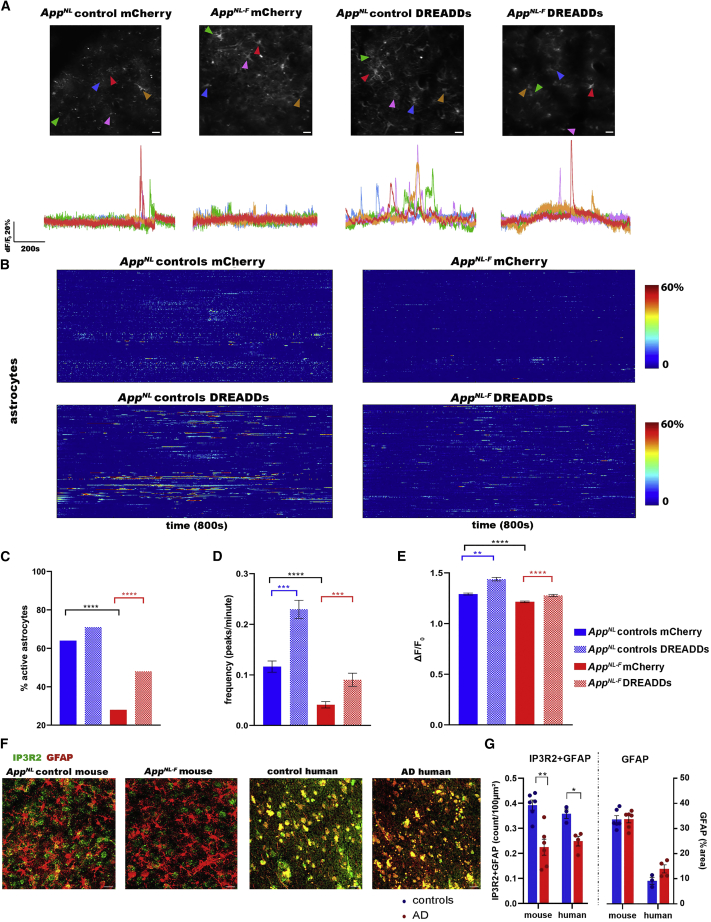
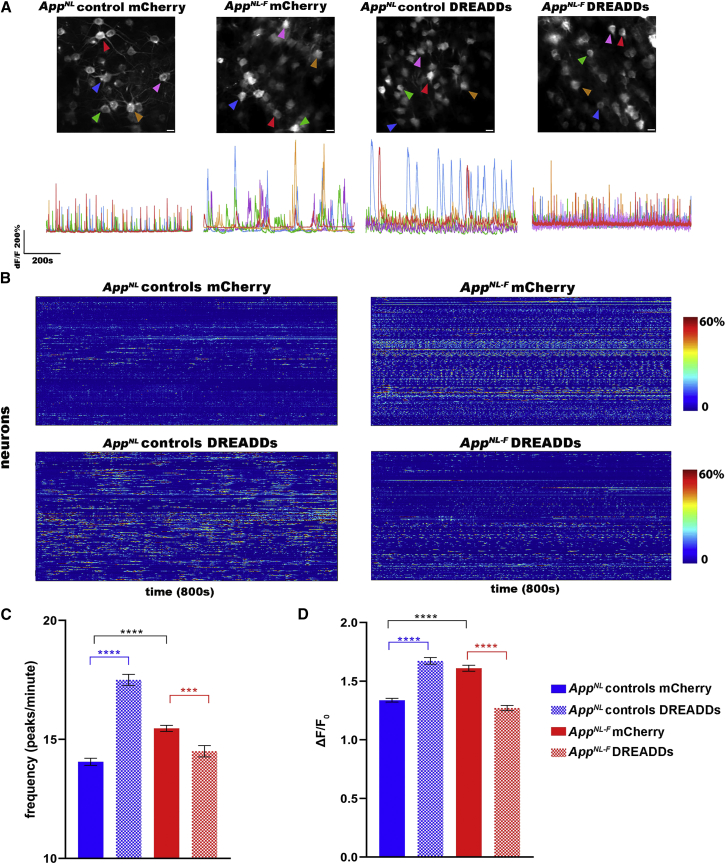
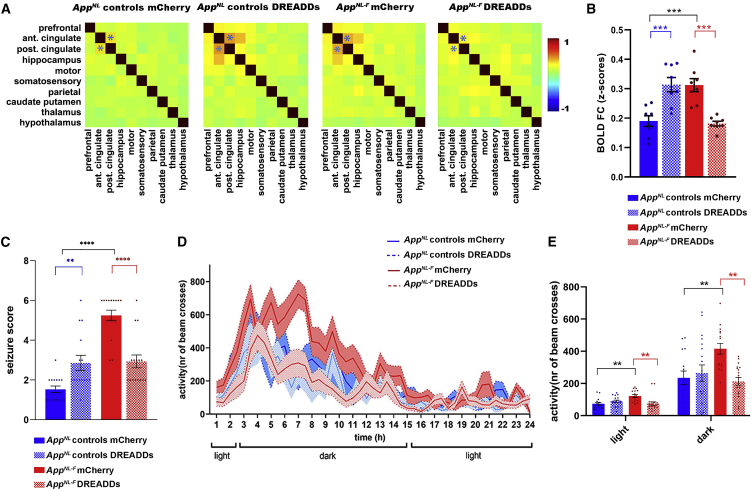
Dysfunctions of network activity and functional connectivity (FC) represent early events in Alzheimer's disease (AD), but the underlying mechanisms remain unclear. Astrocytes regulate local neuronal activity in the healthy brain, but their involvement in early network hyperactivity in AD is unknown. We show increased FC in the human cingulate cortex several years before amyloid deposition. We find the same early cingulate FC disruption and neuronal hyperactivity in AppNL-F mice. Crucially, these network disruptions are accompanied by decreased astrocyte calcium signaling. Recovery of astrocytic calcium activity normalizes neuronal hyperactivity and FC, as well as seizure susceptibility and day/night behavioral disruptions. In conclusion, we show that astrocytes mediate initial features of AD and drive clinically relevant phenotypes.

Keywords: App mice; BOLD rsfMRI; CP: Neuroscience; amyloid pathology; astrocytes; calcium signaling; neuronal hyperactivity.


Conflict of interest statement

Declaration of interests B.D.S. is the Bax-Vanluffelen Chair for Alzheimer’s Disease and is supported by the Opening the Future campaign and Mission Lucidity of KU-Leuven. D.R.T. received speaker honorarium from Biogen (USA), and collaborated with GE-Healthcare (UK), Novartis Pharma Basel (Switzerland), Probiodrug (Germany), and Janssen Pharmaceutical Companies (Belgium).

Figures

None
Graphical abstract
Figure 1
Figure 1
Increased FC of the anterior cingulate cortex in the human brain and AppNL-F mice (A) Amyloid load (CL values ± SEMs) for controls (N = 24) and amyloid accumulators (N = 10). Threshold at CL = 23.5 is indicated by the dotted line. ∗∗∗p < 0.001, 2-way repeated ANOVA with Sidak correction. (B) Mean FC matrices of controls (N = 24) and amyloid accumulators (N = 10). ∗∗∗p < 0.001, 2-sample t test, FDR corrected. Color scale shows Z scores. (C) Mean BOLD FC map of the anterior cingulate cortex of controls and amyloid accumulators (FDR corrected, p < 0.05). Color scale shows t values (i.e., FC between the anterior cingulate cortex and all other voxels in the brain). Statistical map shows anterior cingulate connections that are increased in amyloid accumulators versus controls, 2-sample t test, uncorrected, p < 0.001. (D) BOLD FC (Z scores ± SEMs) between the anterior and posterior cingulate cortex. ∗∗∗p < 0.001, 2-sample t test. (E) Correlation between change in amyloid load (ΔCL between baseline and time point 1) and BOLD FC (between the anterior and posterior cingulate cortex) at baseline for controls (r = 0.14, p = 0.52) and amyloid accumulators (r = 0.86, p = 0.0016). (F) Mean FC matrices of 3-month-old AppNL control (N = 17) and AppNL-F mice (N = 14). p < 0.05, ∗∗p < 0.01, ∗∗∗p < 0.001, 2-sample t test, FDR corrected. Color scale shows Z scores. (G) Mean BOLD FC map of the anterior cingulate cortex of AppNL control and AppNL-F mice (FDR corrected, p < 0.05). Color scale shows t values. Statistical map shows anterior cingulate connections that are increased in AppNL-F mice versus AppNL controls, 2-sample t test, FDR corrected, p < 0.05. (H) BOLD FC (Z scores ± SEMs) between the anterior and posterior cingulate cortex. ∗∗∗p < 0.001, 2-sample t test.
Figure 2
Figure 2
Modulation of astrocyte calcium activity alters network FC in healthy C57BL/6 mice (A–E) The effect of astrocyte modulation (mCherry, DREADDs, or P130PH under the GFAP promotor) on widefield calcium imaging of neurons, which were transfected with GCaMP6f after intravenous (i.v.) injection of AAV-PHP.eB under the hSYN promotor. We allowed 4 weeks for AAV expression and administered CNO (3 mg/kg, intraperitoneally [i.p.]) to activate DREADDs. (A) Brain regions used for correlation analyses are shown on the Allen Mouse Brain Atlas. (B) Mean FC matrices show correlation between ΔF/F0 of neuronal calcium signals for each pair of brain regions in mice expressing mCherry (N = 6), DREADDs (N = 6), or P130PH (N = 5). Color scale shows Z scores. FC between the anterior and posterior cingulate cortex is indicated by asterisk. (C) Graph shows ΔF/F0 correlation between anterior and posterior cingulate regions (Z score ± SEM) for each condition. p< 0.05,∗∗∗p < 0.001, 1-way ANOVA with Sidak correction. (D) Representative FC maps of the anterior cingulate cortex show FC of this region with other pixels in the imaging field-of-view. Color scale shows Z scores. (E) Graph displays maximum FC of each cingulate FC map for all mice per condition (z-max ± SEM). p < 0.05, ∗∗p < 0.01, 1-way ANOVA with Sidak correction. (F–K) The effect of astrocyte modulation (mCherry, DREADDs, or P130PH under the GFAP promotor) on BOLD FC measured with rsfMRI. We allowed 4 weeks for AAV expression and administered CNO (3 mg/kg, i.p.) to activate DREADDs. (F) Brain regions used to calculate BOLD FC matrices are displayed on the Allen Mouse Brain Atlas. (G) Mean BOLD FC matrices show correlation between BOLD signals in mice expressing mCherry (N = 10), DREADDs (N = 8), or P130PH (N = 7). Color scale shows Z scores, representing the strength of FC. BOLD FC between the anterior and posterior cingulate cortex is indicated by asterisk. (H) Mean BOLD FC maps of the cingulate cortex of mice expressing mCherry (N = 10), DREADDs (N = 8), or P130PH (N = 7). Color scale shows t values. (I–K) Quantification of BOLD FC between the anterior and posterior cingulate cortex (Z score ± SEM) of mice after injection of different doses of CNO (1, 3, and 10 mg/kg, i.p., N = 7–9/group) (I), expression duration of P130PH (4, 8, and 12 weeks’ expression, N = 7/group) (J) or after co-injection of DREADDs and P130PH (N = 7/group, CNO 3 mg/kg) (K). p < 0.05, ∗∗p < 0.01, ∗∗∗p < 0.001, ∗∗∗∗p < 0.0001, 1-way ANOVA with Sidak correction for multiple comparisons.
Figure 3
Figure 3
Astrocytes show decreased calcium signaling at early stages of amyloid pathology (A) Representative ΔF/F0 calcium traces of astrocytes in the cingulate cortex of 3-month-old AppNL control and AppNL-F mice expressing the calcium reporter GCaMP6f in addition to either control AAV (mCherry) or DREADDs in astrocytes (GFAP promoter). Scale bar, 20 μm. (B) Heatmaps show astrocyte calcium activity (ΔF/F0 exceeding 2SD baseline, y axis) over time (800 s, x axis) in AppNL control mice expressing mCherry (N = 5 mice, 223 cells) or DREADDs (N = 4 mice, 263 cells), and AppNL-F mice expressing mCherry (N = 4 mice, 291 cells) or DREADDs (N = 4 mice, 236 cells). (C–E) Graphs show percentage of active cells (X2(3, N = 1014) = 119, p < 0.0001), frequency (number of peaks per minute ± SEM), and signal amplitude (ΔF/F0±SEM). ∗∗p < 0.01, ∗∗∗p < 0.001, ∗∗∗∗p < 0.0001, Kruskal-Wallis test with Dunn’s correction. (F and G) Representative images and quantification of astrocytic IP3R2 (IP3R2+GFAP density/100 μm2 ± SEM) and GFAP (percentage area GFAP ± SEM) of immunofluorescent staining in mouse (N = 6 AppNL controls, N = 6 AppNL-F mice, 5 slices per mouse) and human AD cortical tissue (N = 3 controls, N = 4 AD patients, 4 slices per sample). Scale bar, 20 μm. p < 0.05, ∗∗p < 0.01, 2-sample t test.
Figure 4
Figure 4
Recovery of deficient calcium signaling in astrocytes dampens neuronal hyperactivity (A) Representative ΔF/F0 calcium traces of neurons in AppNL control and AppNL-F mice expressing neuronal GCaMP6f (hSYN promoter) in addition to either control AAV (mCherry) or DREADDs in astrocytes (GFAP promoter). Scale bar, 20 μm. (B) Heatmaps show neuronal calcium activity (ΔF/F0 exceeding 2SD baseline, y axis) over time (800 s, x axis) in AppNL control mice expressing mCherry (N = 5 mice, 463 neurons) or DREADDs (N = 4 mice, 640 neurons), and AppNL-F mice expressing mCherry (N = 5 mice, 652 neurons) or DREADDs (N = 5 mice, 466 neurons). (C and D) Graphs show frequency (number of peaks per minute ± SEM) and signal amplitude (ΔF/F0 ± SEM). ∗∗∗p < 0.001, ∗∗∗∗p < 0.0001, Kruskal-Wallis test with Dunn’s correction.
Figure 5
Figure 5
Recovery of deficient astrocyte signaling mitigates network hypersynchrony and behavior hyperactivity in early AD (A and B) BOLD FC matrices (A) and graphs quantifying FC (Z scores ± SEMs) (B) between the anterior and posterior cingulate cortex (indicated in matrices by asterisk) upon modulation of astrocyte calcium activity in AppNL control and AppNL-F mice expressing mCherry or DREADDs (GFAP promoter) (N = 8/group). ∗∗∗p < 0.001, ∗∗∗∗p < 0.0001, 1-way ANOVA with Sidak correction. (C) Seizure susceptibility (seizure score ± SEM) to a subconvulsive dose of PTZ (30 mg/kg) for AppNL control (N = 15/group) and AppNL-F mice (N = 16/group) expressing mCherry or DREADDs. p < 0.05, ∗∗p < 0.01, ∗∗∗∗p < 0.0001, Kruskal-Wallis test with Dunn’s correction. (D and E) Behavior analyses of day/night activity of AppNL control and AppNL-F mice expressing mCherry (AppNL control mCherry N = 15, AppNL-F mCherry N = 16) or DREADDs (AppNL control DREADDs N = 18, AppNL-F DREADDs N = 19) over 24 h (counts of photobeam crosses ± SEMs). ∗∗∗∗p < 0.0001, 1-way ANOVA with Sidak correction.

References

    1. Adamczuk K., De Weer A.S., Nelissen N., Chen K., Sleegers K., Bettens K., Van Broeckhoven C., Vandenbulcke M., Thiyyagura P., Dupont P., et al. Polymorphism of brain derived neurotrophic factor influences β amyloid load in cognitively intact apolipoprotein e ε4 carriers. Neuroimage. Clin. 2013;2:512–520. doi: 10.1016/j.nicl.2013.04.001. - DOI - PMC - PubMed
    1. Adamsky A., Kol A., Kreisel T., Doron A., Ozeri-Engelhard N., Melcer T., Refaeli R., Horn H., Regev L., Groysman M., et al. Astrocytic activation generates De Novo neuronal potentiation and memory enhancement. Cell. 2018;174:59–71.e14. doi: 10.1016/j.cell.2018.05.002. - DOI - PubMed
    1. Aisen P.S., Cummings J., Jack C.R., Morris J.C., Sperling R., Frölich L., Jones R.W., Dowsett S.A., Matthews B.R., Raskin J., et al. On the path to 2025: understanding the Alzheimer’s disease continuum. Alzheimer's Res. Ther. 2017;9:60. doi: 10.1186/s13195-017-0283-5. - DOI - PMC - PubMed
    1. Allman J.M., Hakeem a., Erwin J.M., Nimchinsky E., Hof P. The anterior cingulate cortex. The evolution of an interface between emotion and cognition. Ann. N. Y. Acad. Sci. 2001;935:107–117. doi: 10.1111/j.1749-6632.2001.tb03476.x. - DOI - PubMed
    1. Arranz A.M., De Strooper B. The role of astroglia in Alzheimer’s disease: pathophysiology and clinical implications. Lancet Neurol. 2019;18:406–414. doi: 10.1016/S1474-4422(18)30490-3. - DOI - PubMed

Publication types