. 2022 Aug 23;40(8):111246.
doi: 10.1016/j.celrep.2022.111246.

Responses and functions of dopamine in nucleus accumbens core during social behaviors

Affiliations

Responses and functions of dopamine in nucleus accumbens core during social behaviors

Bing Dai et al. Cell Rep. .

Abstract

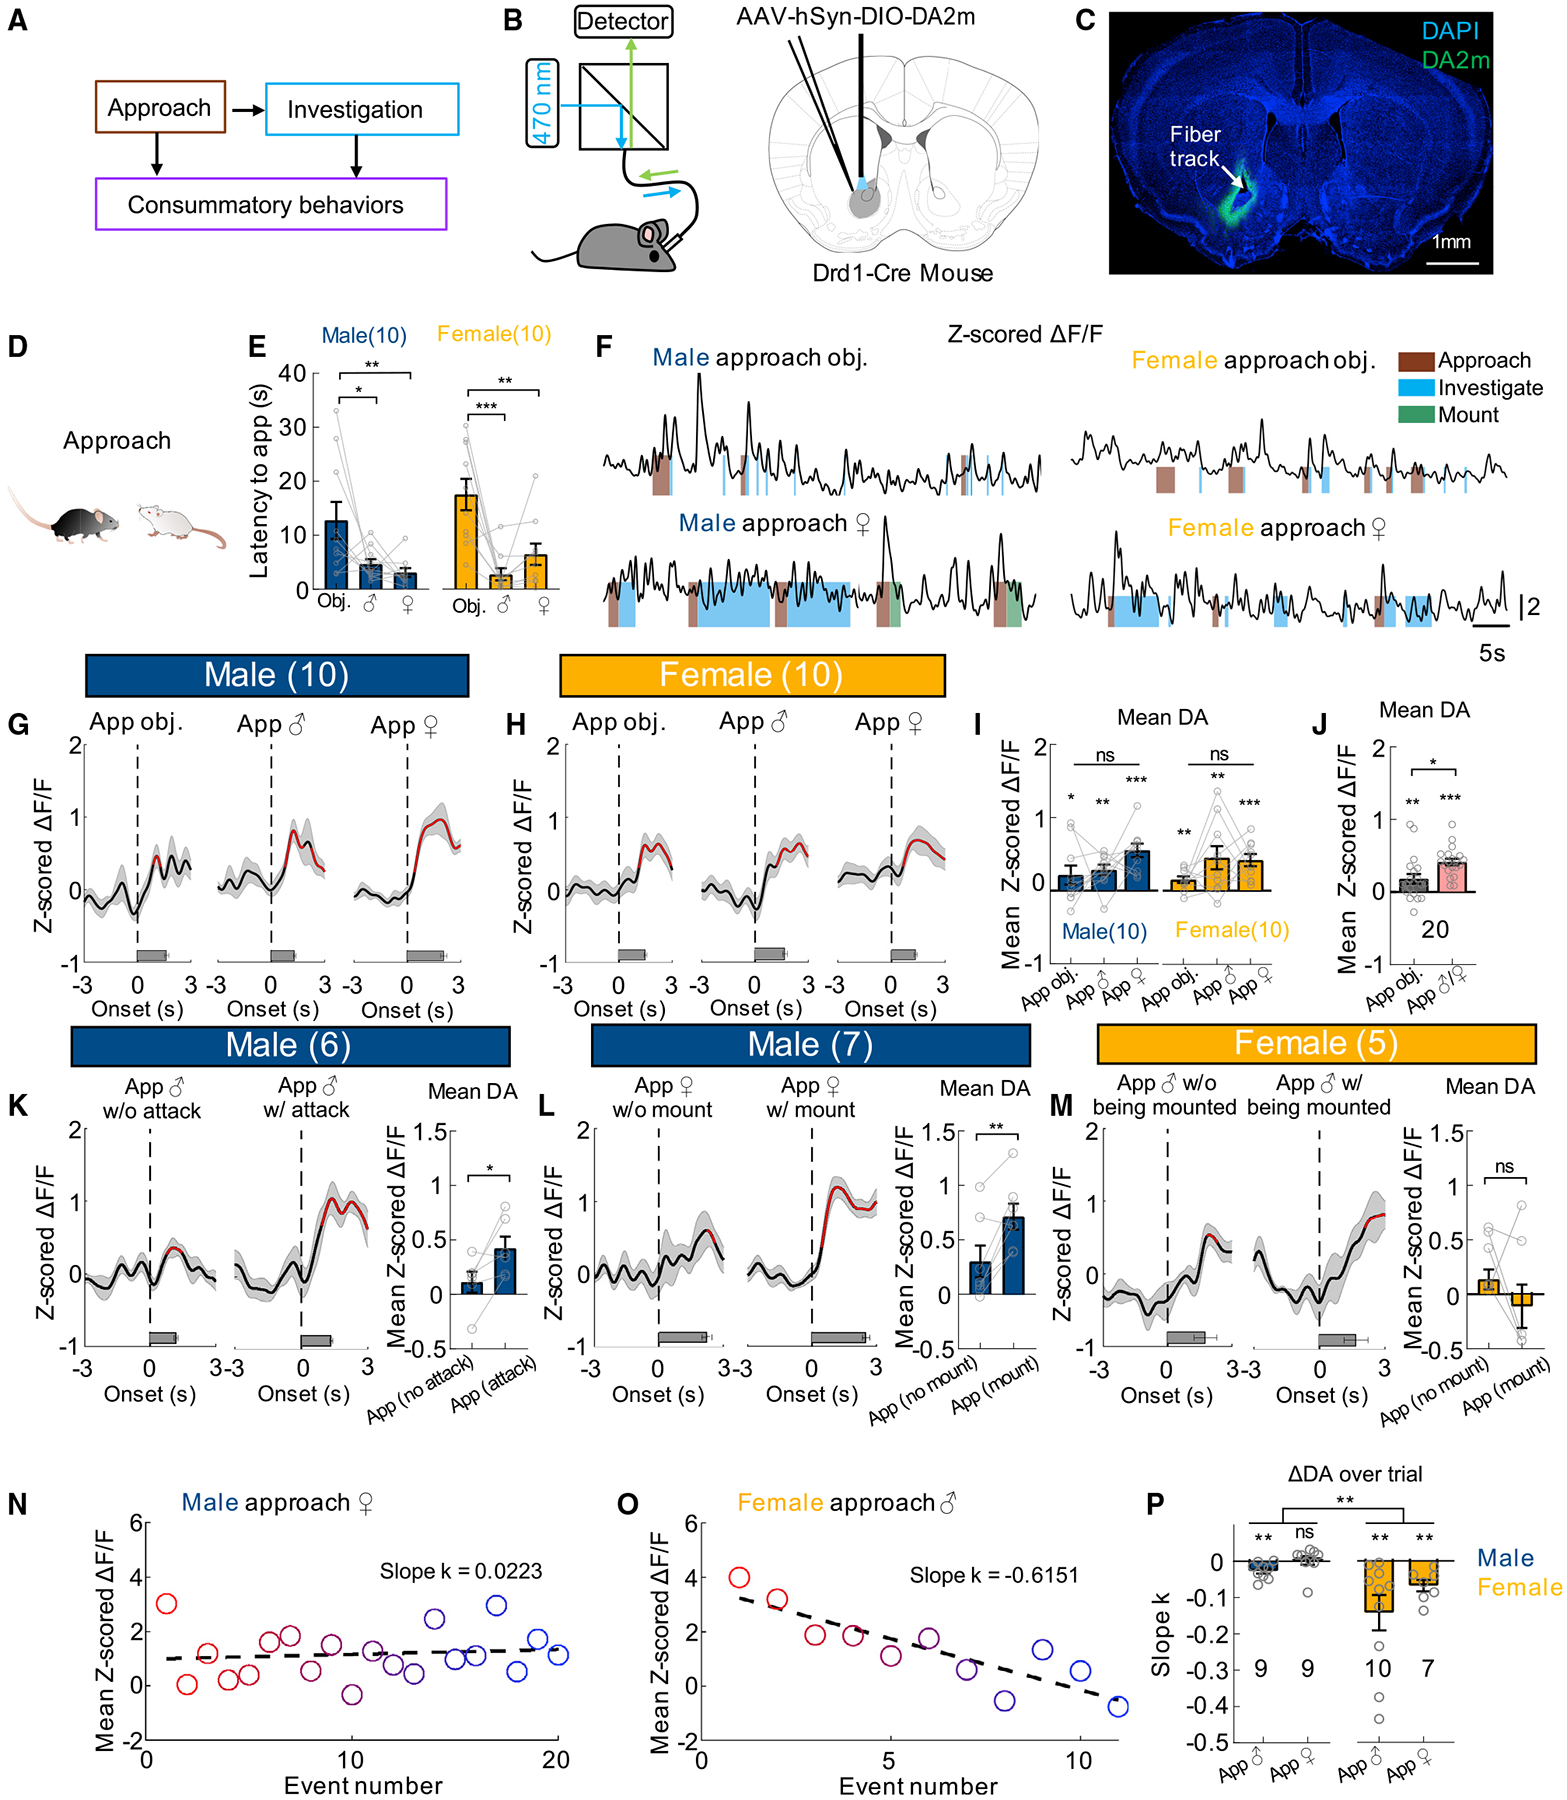
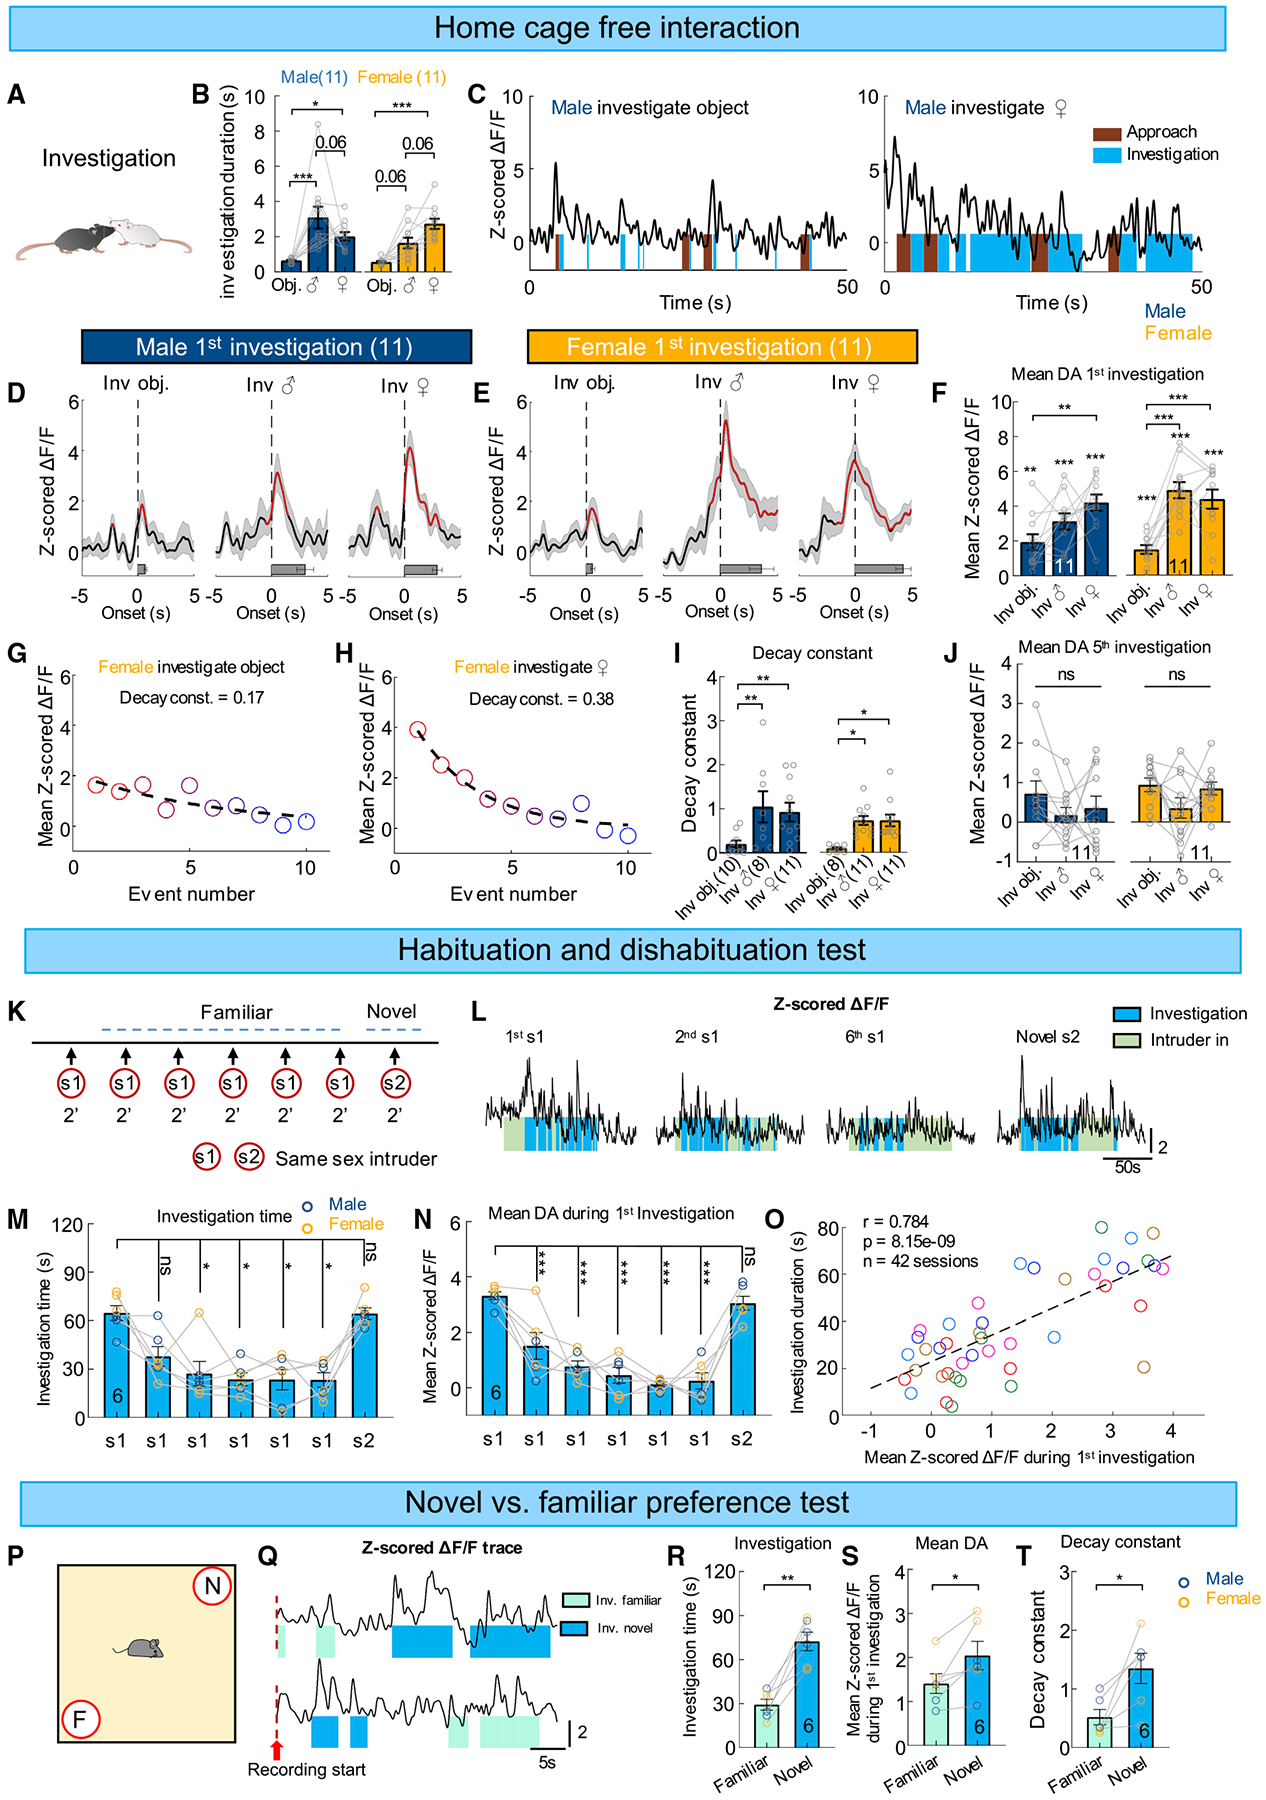
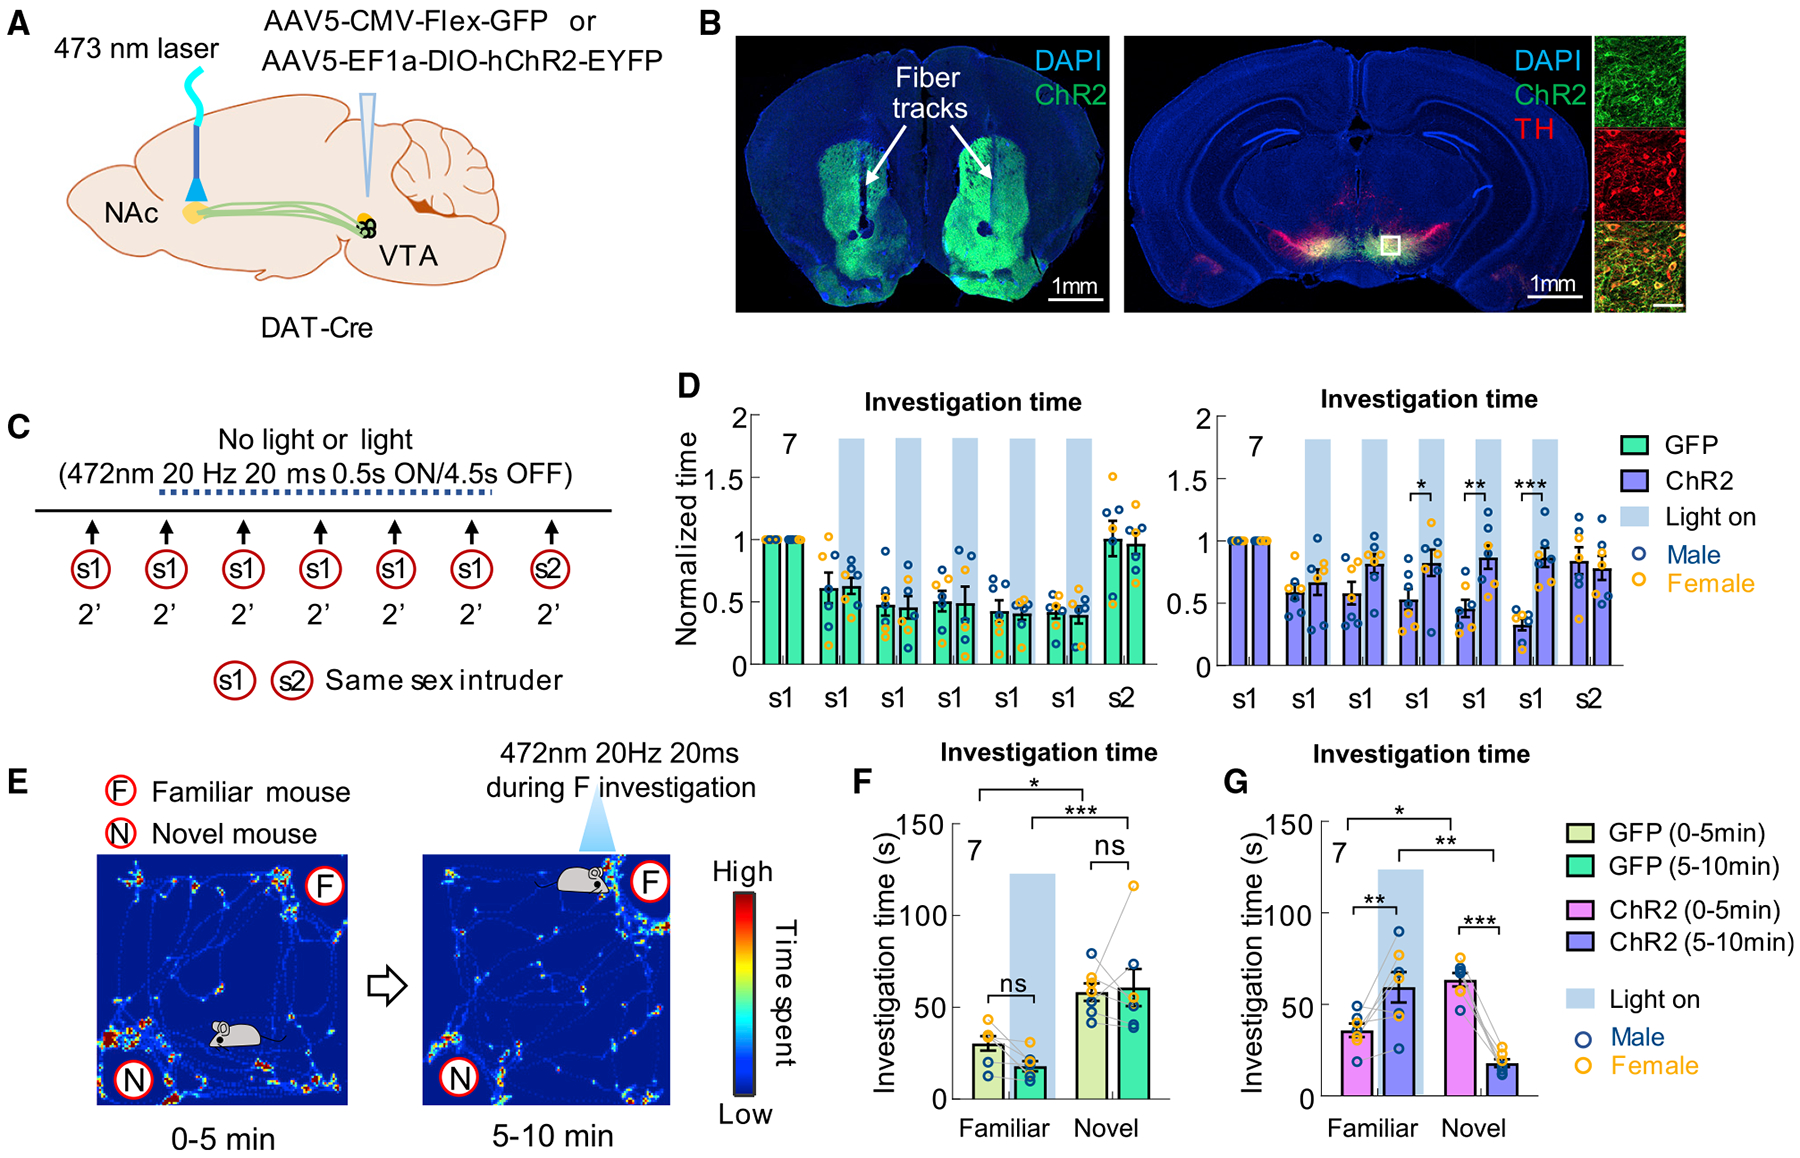
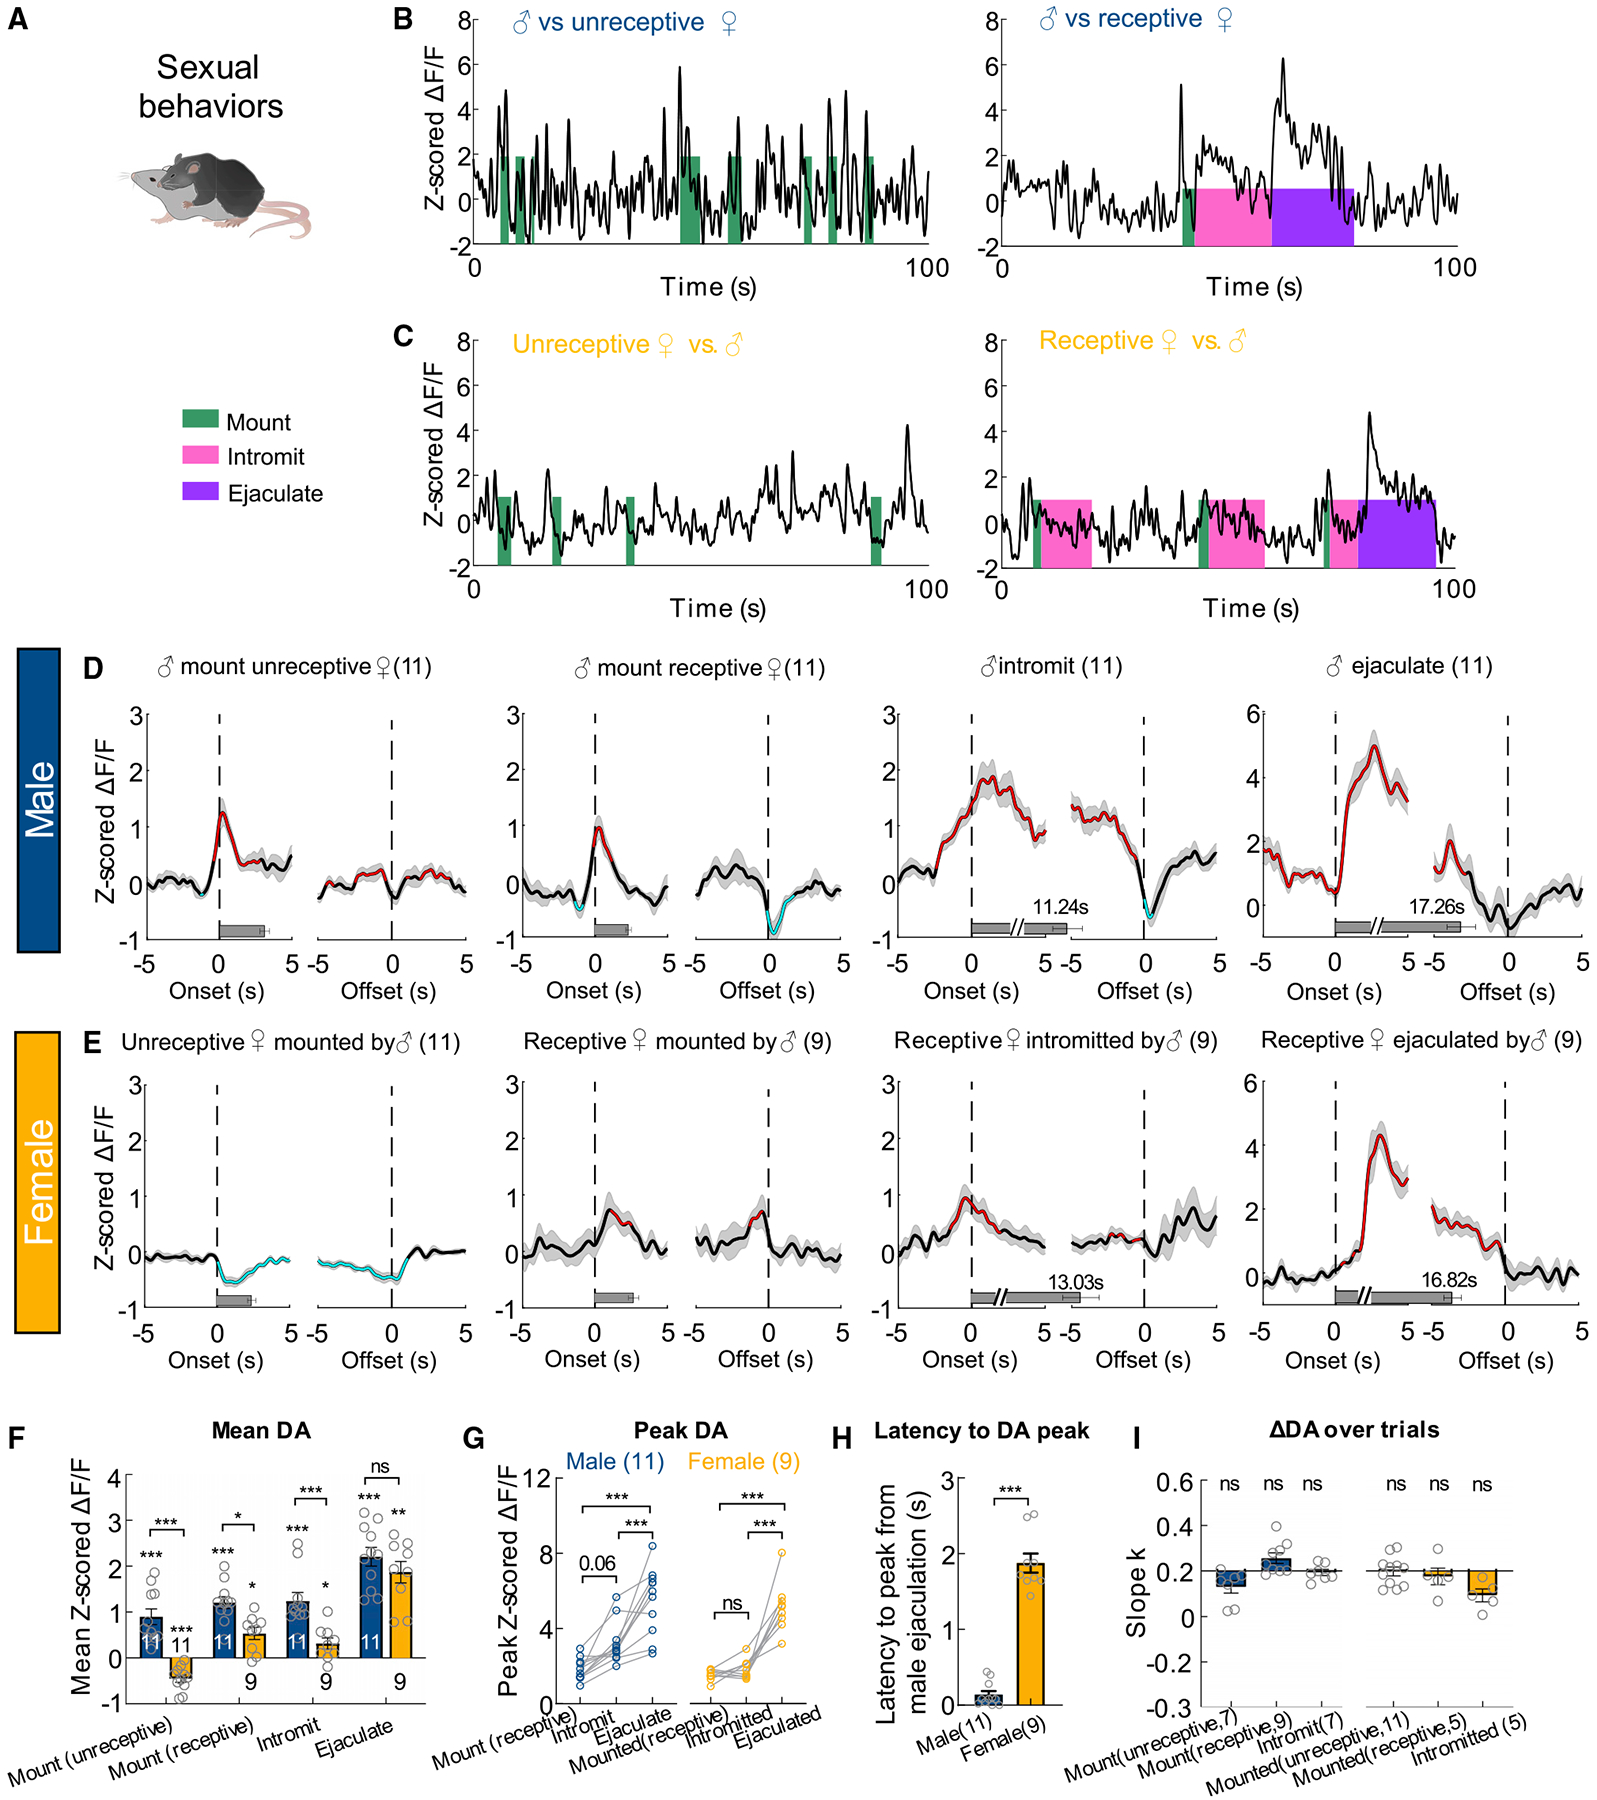
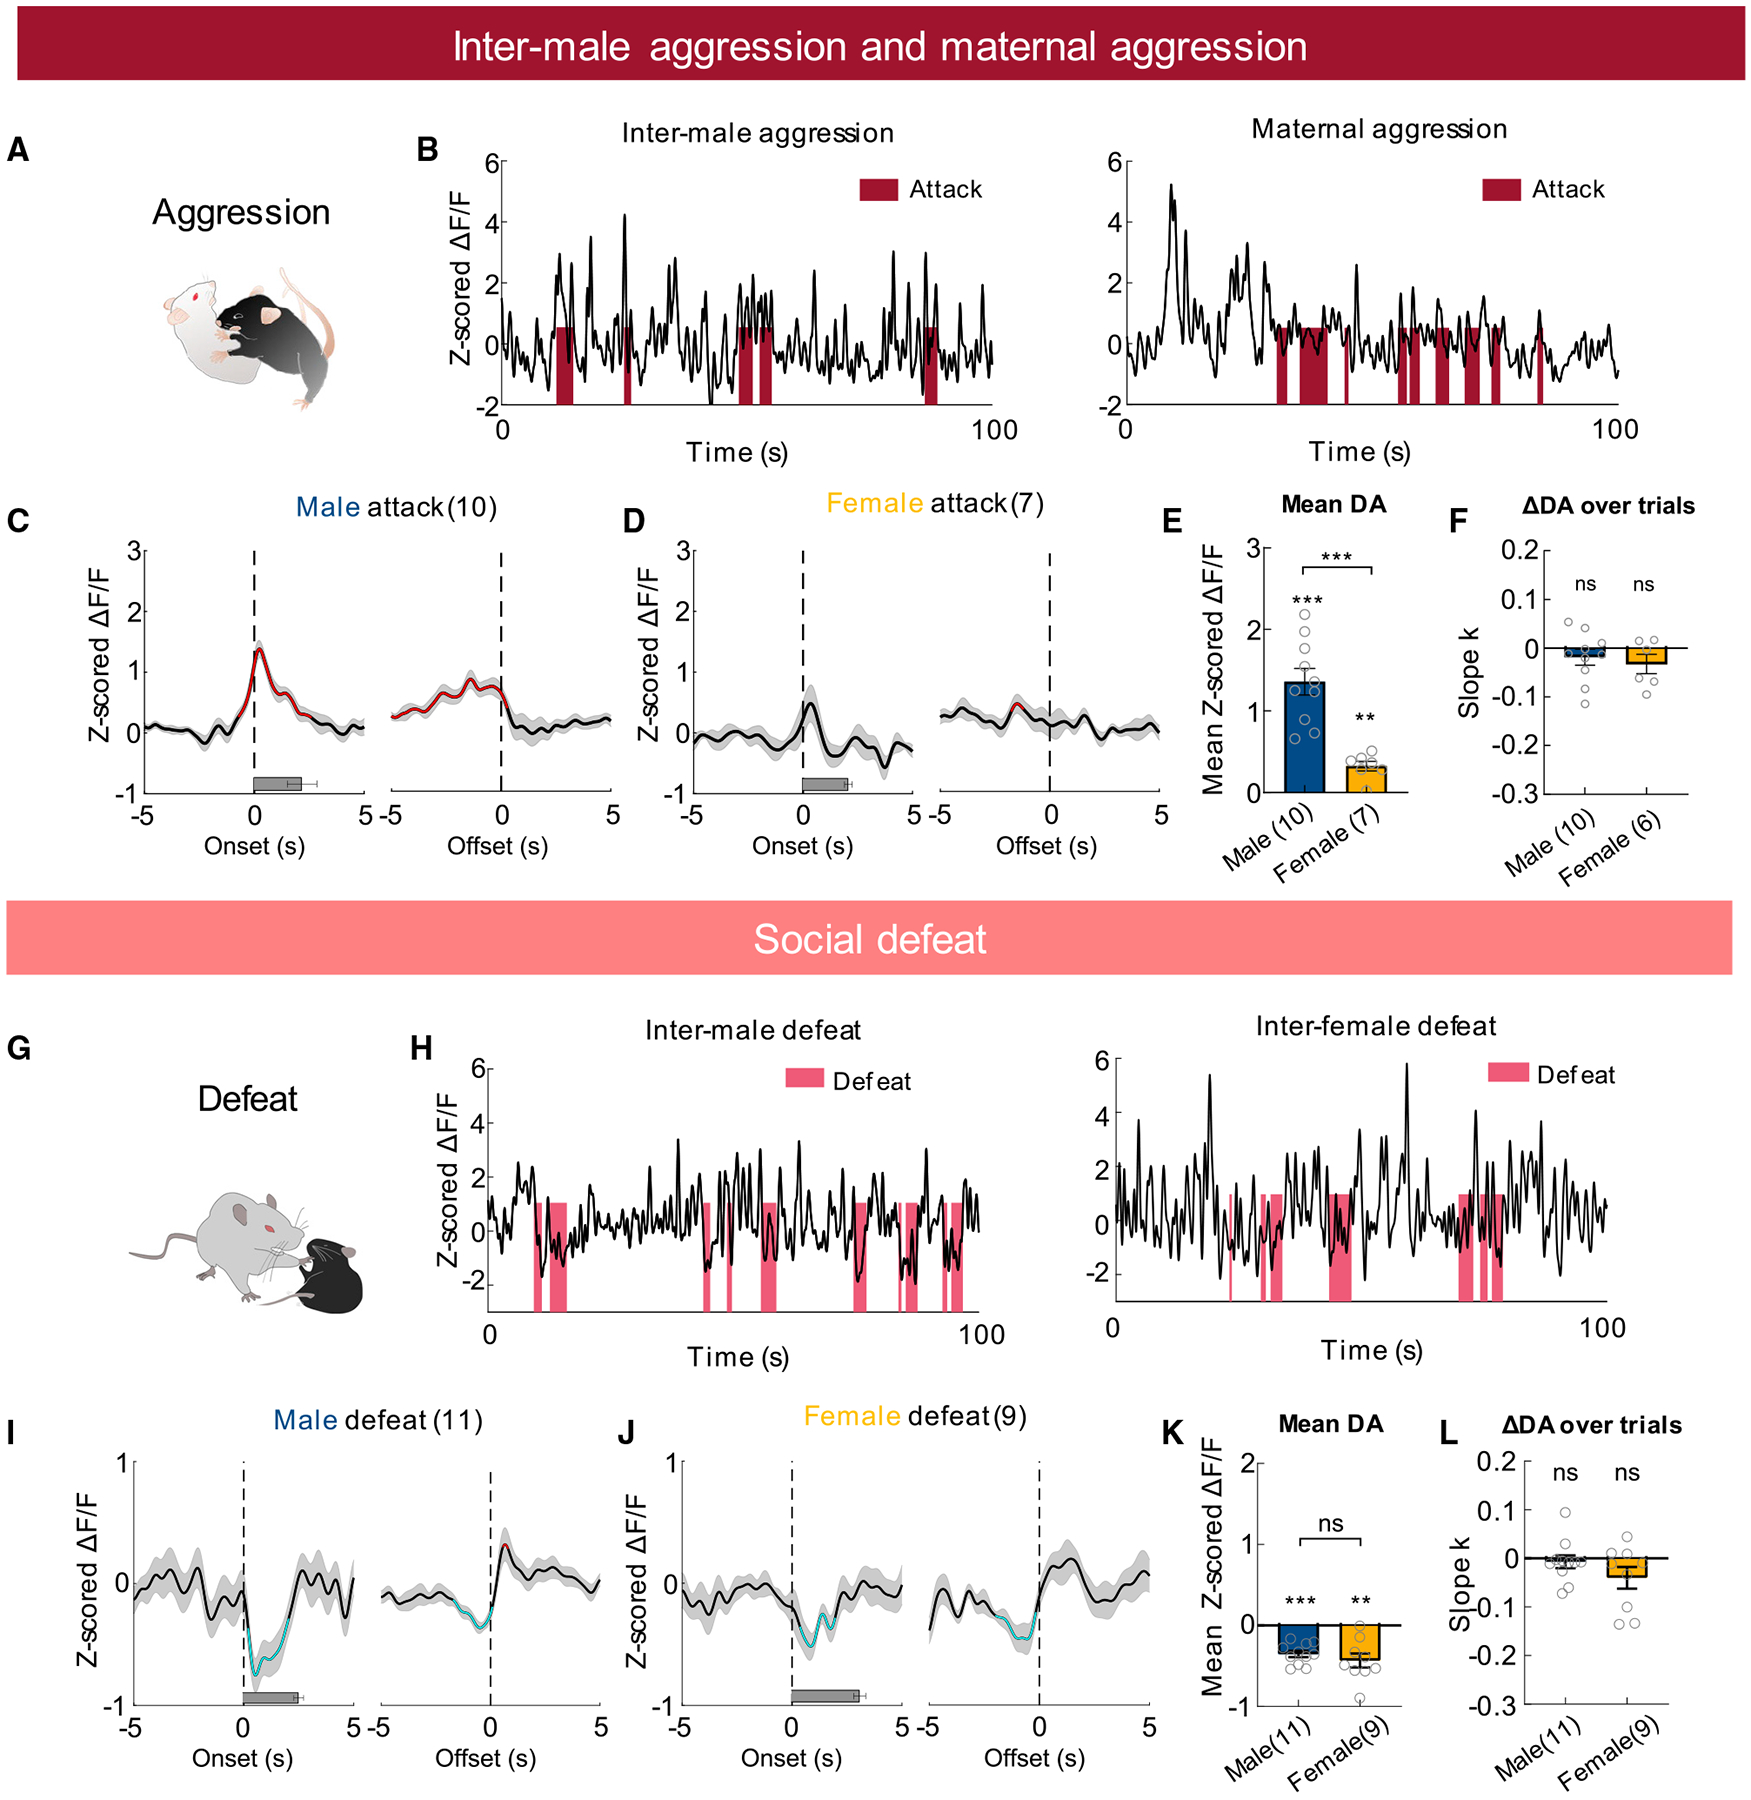
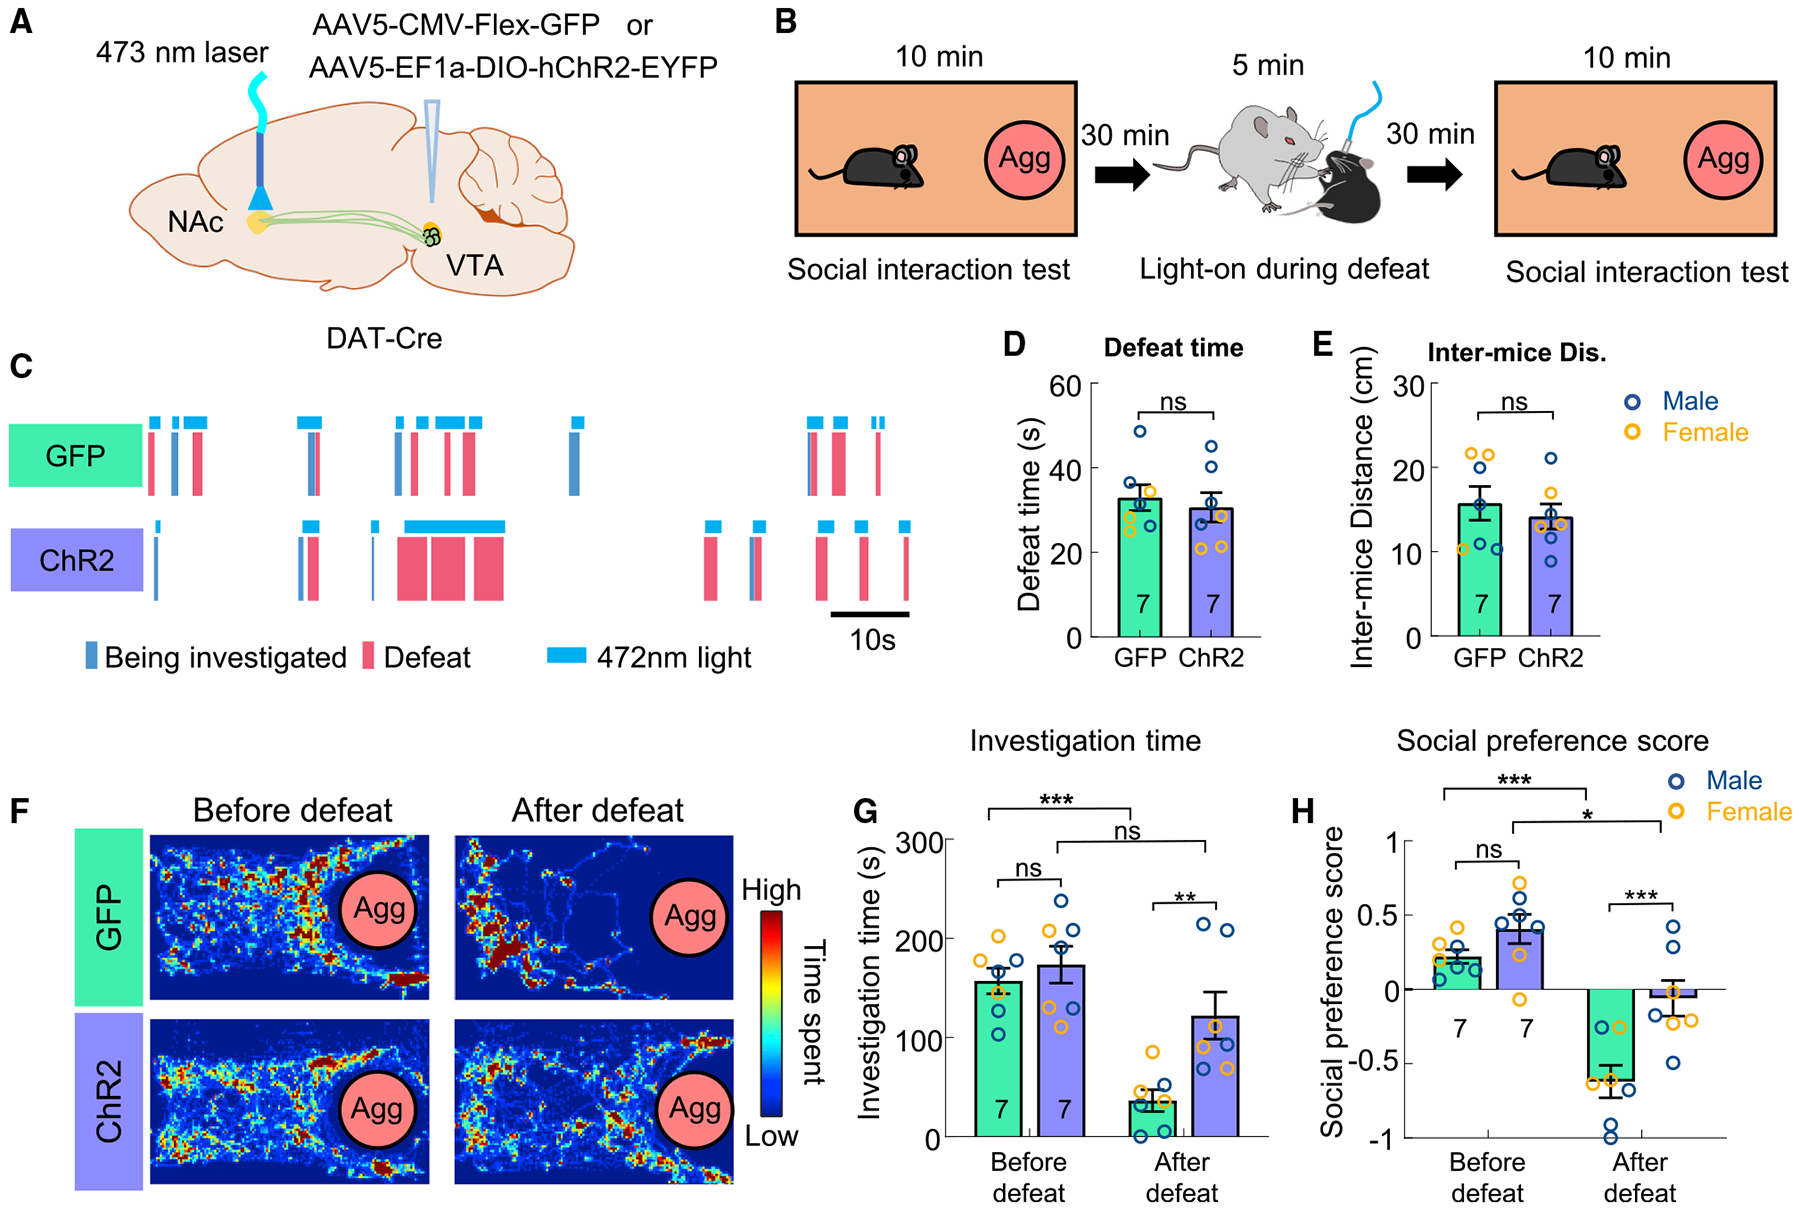
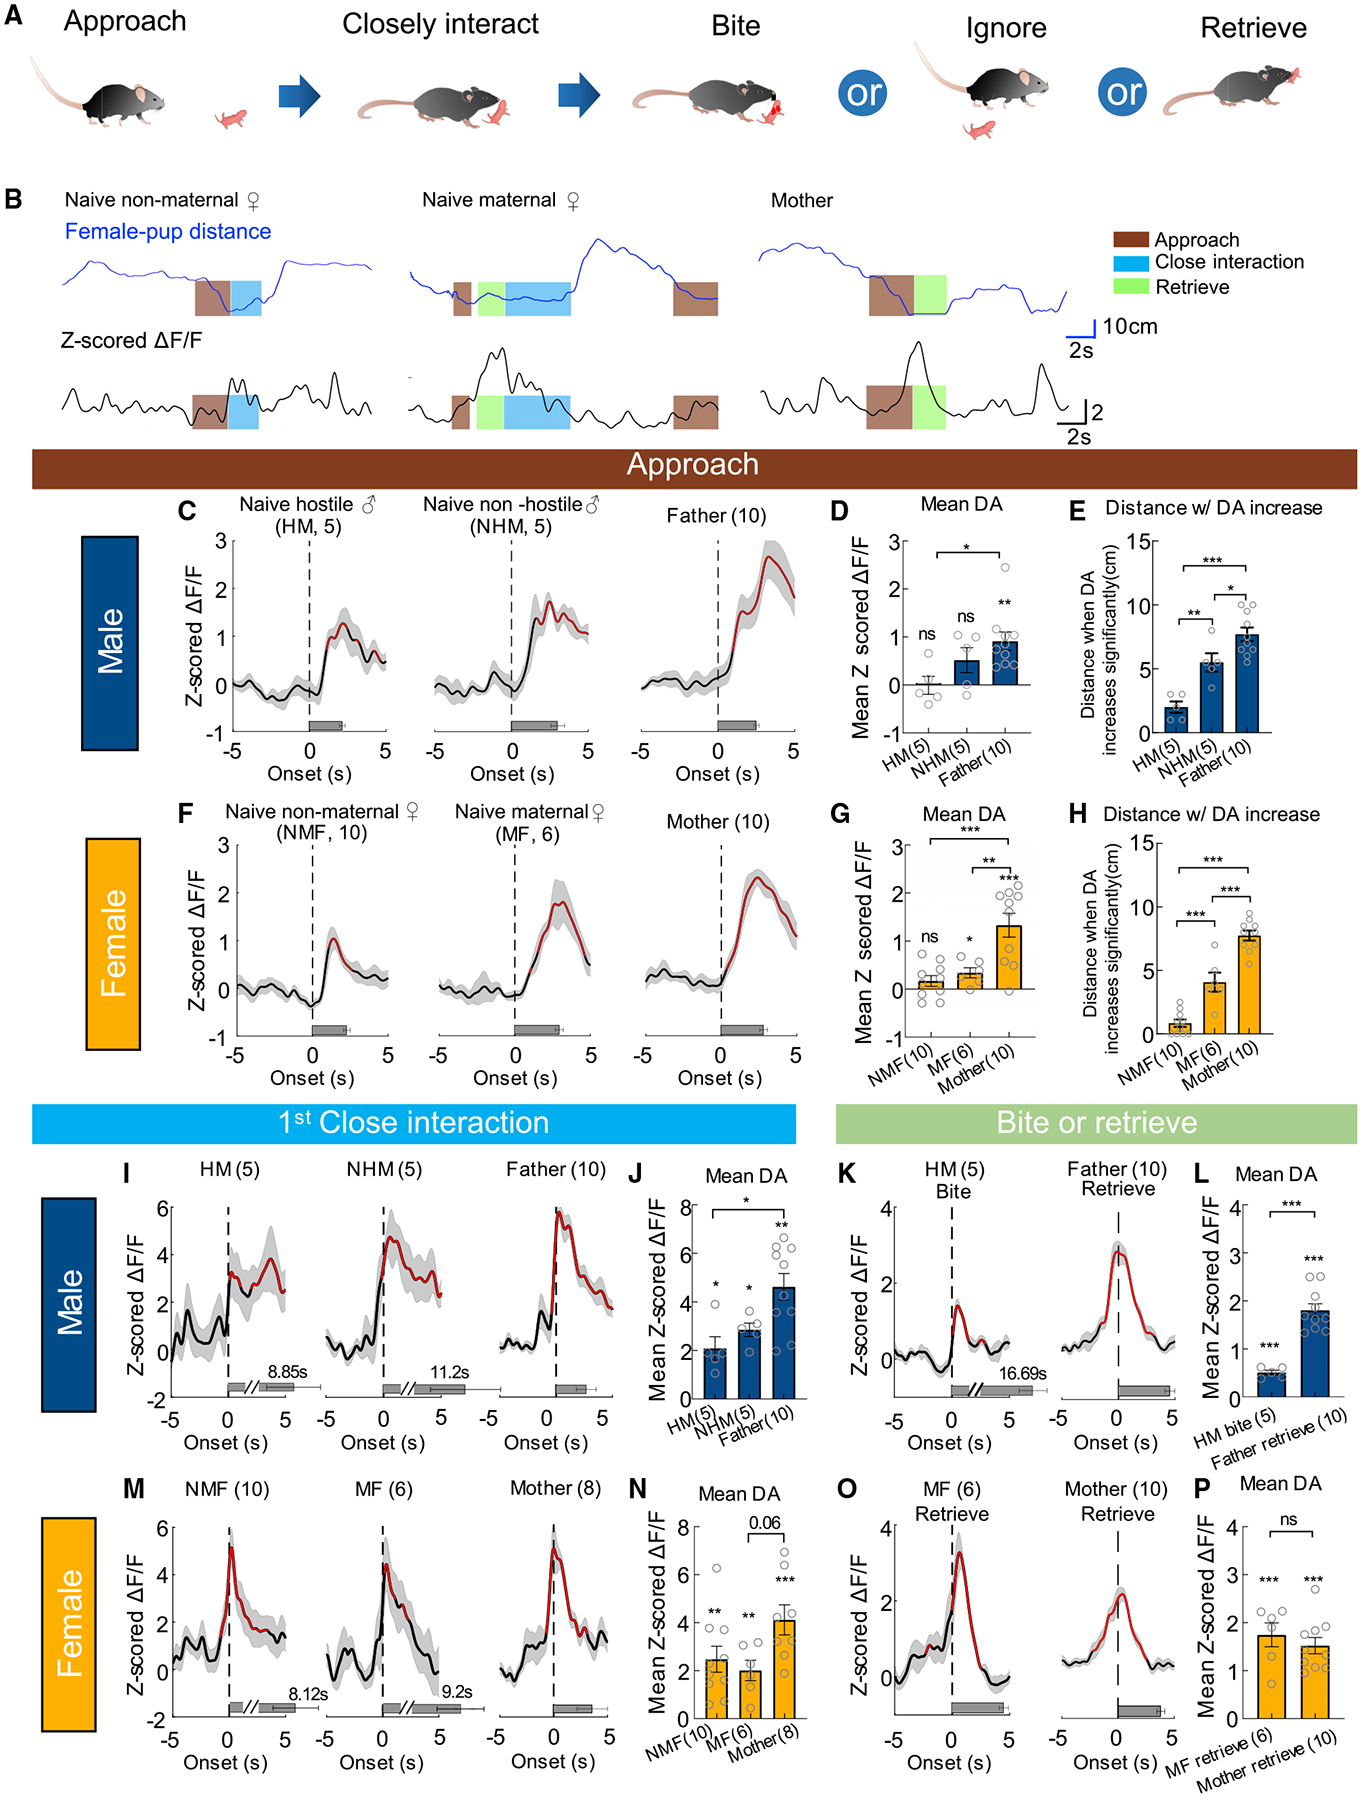
Social behaviors are among the most important motivated behaviors. How dopamine (DA), a "reward" signal, releases during social behaviors has been a topic of interest for decades. Here, we use a genetically encoded DA sensor, GRABDA2m, to record DA activity in the nucleus accumbens (NAc) core during various social behaviors in male and female mice. We find that DA releases during approach, investigation and consummation phases of social behaviors signal animals' motivation, familiarity of the social target, and valence of the experience, respectively. Positive and negative social experiences evoke opposite DA patterns. Furthermore, DA releases during mating and fighting are sexually dimorphic with a higher level in males than in females. At the functional level, increasing DA in NAc enhances social interest toward a familiar conspecific and alleviates defeat-induced social avoidance. Altogether, our results reveal complex information encoded by NAc DA activity during social behaviors and their multistage functional roles.

Keywords: CP: Neuroscience; dopamine; innate social behaviors; nucleus accumbens core; sex difference; social avoidance learning; social interest.


Conflict of interest statement

Declaration of interests The authors declare no competing interests.

Figures

Figure 1.
Figure 1.. DA responses during approaching social and non-social targets
(A) Different stages of social behaviors. (B) The fiber photometry setup and virus injection. Atlas image adopted from Franklin and Paxinos (2007). (C) Representative image showing the expression of GRABDA2m and optic track. Scale bar, 1 mm. (D) Cartoon illustration of social approach. (E) Latency to approach different targets in male and female mice. (F) Representative traces of Z scored ΔF/F of GRABDA2m during social and non-social interaction from example male and female mice. Color shades indicate annotated behaviors. (G–H) Average post-event histograms (PETHs) aligned to the onset of approach for male (G) and female mice (H). (I) Averaged Z scored GRABDA2m responses during approaching various targets. (J) Averaged Z scored GRABDA2m responses during approaching non-social and social targets (average responses of male approach and female approach). (K–M) Left: Average PETHs aligned to the onset of approach followed/not followed by attacking male (K)/mounting female (L) in male mice and being mounted by the male in female mice (M). Right: Mean GRABDA2m responses during indicated approach events. (N and O) A scatterplot showing mean Z scored GRABDA2m responses during repeated male-approach-female events (N) or female-approach-male events (O), overlaid with a linear regression line. (P) Average slope of the linear regression lines of GRABDA2m responses over trials. Numbers on the graphs represent number of test animals. Error bars and shaded areas in (E, G–M, and P) represent ±SEM. In (G, H, and K–M), red line indicates periods with significantly increased DA level, and horizontal bars indicate average durations of the behaviors. (E, I) two-way ANOVA followed by multiple comparison test with Tukey’s correction; (J) Wilcoxon test; (K, L, M) paired t test; (P) two-way mixed model ANOVA. *p < 0.05, **p < 0.01, and ***p < 0.001. See also Figures S1–S6 and Table S1 for detailed statistics.
Figure 2.
Figure 2.. DA responses during male and female investigatory behaviors
(A) A cartoon illustration of social investigation. (B) Averaged investigation duration toward various targets. (C) Representative traces of Z scored ΔF/F of GRABDA2m during object and female interaction from an example male mouse. (D and E) Average PETHs aligned to the onset of the first investigation bout toward a novel object, a male intruder, and a female intruder for male (D) and female mice (E). (F) Averaged Z scored GRABDA2m responses during the first investigation bout toward various targets. Stimulus. (G and H) Scatterplots showing mean Z scored GRABDA2m responses over the first 10 investigation bouts from a female-object (G) and a female-female (H) encounter session, overlaid with fitted one exponential curves. (I) Decay constants of the one exponential curve fitted with the first 10 investigation bouts toward a novel object, a male, and a female conspecific in male and female mice. (J) Averaged Z scored GRABDA2m responses during the fifth investigation bout toward various targets. (K) The experimental design of the habituation and dishabituation test. (L) Representative traces of Z scored ΔF/F of GRABDA2m during the first, second, and sixth 2-min social interactions with the s1 intruder, and with the novel s2 intruder. (M and N) Total investigation duration (M) and mean Z scored GRABDA2m responses during the first investigation (N) in each session of the habituation and dishabituation test. (O) A scatterplot showing Pearson correlation between total investigation duration and mean Z scored GRABDA2m responses during the first investigation in each session. Each color represents one individual animal. (P) The experimental design of novel versus familiar preference test. (Q) Representative traces of Z scored ΔF/F of GRABDA2m during the novel versus familiar preference test from two different example animals. Red dashed lines indicate the start of video recording that occurred immediately after placing the test mouse in the arena center. (R) The total investigation duration toward familiar and novel mice. (S) Mean Z scored GRABDA2m responses during the first investigation toward familiar and novel mice. (T) Decay constant of the one exponential function fitted to the first 10 investigation trials toward familiar and novel mice. Numbers on the graphs represent number of test animals. Error bars and shaded areas in (B, D–F, I, J, M, N, and R–T) represent ±SEM. In (D and E), red line indicates periods with significantly increased DA level, and horizontal bars indicate average durations of the behaviors. (B, F, I, J) Two-way ANOVA followed by multiple comparison test with Tukey’s correction; (F) one-sample t test followed by two-stage step-up method of Benjamini, Krieger, and Yekutieli with 0.05 false discovery rate. (M) Friedman test with Dunn’s multiple comparison test; (N) one-way ANOVA with Tukey’s multiple comparisons test; (R, S) paired t test; (T) Wilcoxon test. *p < 0.05, **p < 0.01, and ***p < 0.001. See also Figures S3 and S7, and Table S1 for detailed statistics.
Figure 3.
Figure 3.. Increasing NAc DA promotes social investigation toward a familiar conspecific
(A) Experimental strategy. (B) Representative images showing ChR2-EYFP in the VTADA cells and NAc, amplified by immunostaining, and optic fiber tracks. Right shows the enlarged view of the boxed area. Scale bars, 1 mm (overview) and 100 μm (zoom-in view). (C) The light stimulation protocol during habituation and dishabituation test. (D) Normalized accumulated investigation duration in each 2-min session of the habituation and dishabituation test in GFP (left) and ChR2 animals (right). (E) The light stimulation protocol during novel versus familiar preference test and heatmap showing the body center distribution of an example mouse during the test. (F and G) Total investigation time of familiar and novel mice during different periods in GFP control animals (F) and ChR2 test animals (G). Numbers in bar graphs represent number of test animals. Error bars in (D, F, and G) represent ±SEM. (D, F, G) Two-way ANOVA with Bonferroni’s multiple comparison test. *p < 0.05, **p < 0.01, and ***p < 0.001. See also Figure S2 and Table S1 for detailed statistics.
Figure 4.
Figure 4.. DA responses during male and female sexual behaviors
(A) A cartoon illustration of mouse mating. (B and C) Representative traces of Z scored ΔF/F of GRABDA2m during various stages of mating in male (B) and female (C) mice. (D and E) Average PETHs aligned to the onset (left) and offset (right) of various mating events, when the female mice were unreceptive or receptive. (F) Averaged Z scored GRABDA2m responses during various mating events, when the female mice were unreceptive or receptive. (G) Comparison of GRABDA2m peak responses during different stages of sexual behaviors in males and females. (H) The latency from the onset of ejaculation to the moment of DA increase. (I) Slope of the best fitted line of the GRABDA2m responses over repeated mating trials. Numbers in bar graphs represent number of test animals. Error bars and shaded areas in (D–I) represent ±SEM. (D and E) Red and cyan respectively indicate periods with significantly increased and decreased DA level; horizontal bars indicate average durations of the behaviors. (F) Two-way mixed model ANOVA with Bonferroni’s multiple comparison test; (G) two-way ANOVA followed by multiple comparison test with Tukey’s correction; (H) Mann-Whitney test; one-sample Wilcoxon test (in F) or one-sample t test (in I) followed by false discovery rate correction. *p < 0.05, **p < 0.01, and ***p < 0.001. See Table S1 for detailed statistics.
Figure 5.
Figure 5.. DA responses during aggressive behaviors and social defeat
(A) A cartoon illustration of mouse attack. (B) Representative traces of Z scored ΔF/F of GRABDA2m during inter-male and maternal aggression. (C and D) Average PETHs aligned to the onset (left) and offset (right) of attack during male-male (C) and female-female agonistic encounters (D). (E) Mean Z scored GRABDA2m responses during attack. (F) Slope of the best fitted line of GRABDA2m responses over repeated attack events. (G) A cartoon illustration of social defeat. (H) Representative traces of Z scored ΔF/F of GRABDA2m during inter-male defeat (left) and inter-female defeat (right). (I and J) Average PETHs aligned to the onset (left) and offset (right) of being attacked during inter-male defeat (I) and inter-female defeat (J). (K) Mean Z scored GRABDA2m responses during social defeat. (L) Slope of the best fitted line of GRABDA2m responses over repeated defeat events. Numbers in bar graphs represent number of test animals. In (C, D, I, and J), red and cyan, respectively, indicate periods with significantly increased and decreased DA level; horizontal bars indicate average durations of the behaviors. (E, K) Unpaired t tests and one-sample t test; (F) one-sample t test; (L) one-sample Wilcoxon test. Error bars and shaded areas in (C–F and I–L) represent ±SEM. **p < 0.01 and ***p < 0.001. See also Figures S3 and S8, and Table S1 for detailed statistics.
Figure 6.
Figure 6.. DA decrease during social defeat is important for defeat-induced social avoidance
(A) Experimental strategy. (B) Behavioral test protocol. (C) Raster plots showing light delivery during defeat (legend below) in a GFP (top) and a ChR2 (bottom) animal. (D) The total defeat time during aggressor encounter in GFP and ChR2 animals. (E) Inter-mice distance during aggressor encounter in GFP and ChR2 animals. (F) Heatmaps showing the distribution of body center location of example GFP (top) and ChR2 (bottom) animals during the social interaction test before and after defeat. (G) The total investigation duration toward aggressors before and after defeat in GFP and ChR2 animals. (H) Social preference score before and after defeat in GFP and ChR2 animals. Numbers in bar graphs represent number of test animals. Error bars in (D, E, G, and H) represent ±SEM. (D, E) Unpaired t tests. (G, H) Two-way ANOVA with Bonferroni’s multiple comparison test. *p < 0.05, **p < 0.01, and ***p < 0.001. See also Figure S2 and Table S1 for detailed statistics.
Figure 7.
Figure 7.. DA responses during pup-directed behaviors in naive and parental mice
(A) A cartoon showing different stages of pup-directed behaviors. (B) Representative traces showing distance from a pup (top) and Z scored ΔF/F of GRABDA2m (bottom) during pup interaction of an example naive non-maternal female mouse (NMF), a naive maternal female (MF), and a mother. Color shades indicate annotated behaviors. (C) Average PETHs aligned to the onset of pup approach for male mice. (D) Mean Z scored GRABDA2m responses during approaching pups for male mice. (E) Distance from pups when the GRABDA2m responses become significantly increased during pup approach in male mice. (F–H) The responses during pup approach in females, following the conventions as in (C–E). (I) Average PETHs aligned to the onset of the first close interaction toward pups for male mice. (J) Mean Z scored GRABDA2m responses during the first close interaction with a pup for male mice. (K) Average PETHs aligned to the onset of biting pups in HMs and retrieving pups in fathers. (L) Averaged Z scored GRABDA2m responses during biting pups and retrieving pups. (M and N) The responses during the first close interaction with a pup in NMFs, MFs, and mothers, following the conventions as in (I and J). Two mothers were excluded as they retrieved pup without investigation. (O and P) The responses during retrieving pups in MFs and mothers, following the conventions as in (K and L). Numbers in bar graphs represent number of test animals. Error bars and shaded areas in (C–P) represent ±SEM. In (C, F, I, K, M, and O), red indicates periods with significantly increased DA level; horizontal bars indicate average durations of the behaviors. (D, E, G, H, N) One-way ANOVA with Tukey’s multiple comparisons test; (J) Kruskal-Wallis test with Dunn’s multiple comparisons test; one-sample t test (in D, G, and N) and one-sample Wilcoxon test (in J) followed by false discovery rate correction; (L, P) unpaired t test and one-sample t test. *p < 0.05, **p < 0.01, and ***p < 0.001. See also Figures S5, S6 and S9, and Table S1 for detailed statistics.

Similar articles

Cited by

References

    1. Afonso VM, Grella SL, Chatterjee D, and Fleming AS (2008). Previous maternal experience affects accumbal dopaminergic responses to pup-stimuli. Brain Res. 1198, 115–123. - PubMed
    1. Afonso VM, King S, Chatterjee D, and Fleming AS (2009). Hormones that increase maternal responsiveness affect accumbal dopaminergic responses to pup-and food-stimuli in the female rat. Horm. Behav 56, 11–23. - PubMed
    1. Afonso VM, Shams WM, Jin D, and Fleming AS (2013). Distal pup cues evoke dopamine responses in hormonally primed rats in the absence of pup experience or ongoing maternal behavior. J. Neurosci 33, 2305–2312. - PMC - PubMed
    1. Aitken TJ, Greenfield VY, and Wassum KM (2016). Nucleus accumbens core dopamine signaling tracks the need-based motivational value of food-paired cues. J. Neurochem 136, 1026–1036. - PMC - PubMed
    1. Ajayi AF, and Akhigbe RE (2020). Staging of the estrous cycle and induction of estrus in experimental rodents: an update. Fertil. Res. Pract 6, 5. - PMC - PubMed

Publication types