. 2022 Aug 23;40(8):111223.
doi: 10.1016/j.celrep.2022.111223.

Pituitary adenomas evade apoptosis via noxa deregulation in Cushing's disease

Affiliations

Pituitary adenomas evade apoptosis via noxa deregulation in Cushing's disease

David T Asuzu et al. Cell Rep. .

Abstract

Sporadic pituitary adenomas occur in over 10% of the population. Hormone-secreting adenomas, including those causing Cushing's disease (CD), cause severe morbidity and early mortality. Mechanistic studies of CD are hindered by a lack of in vitro models and control normal human pituitary glands. Here, we surgically annotate adenomas and adjacent normal glands in 25 of 34 patients. Using single-cell RNA sequencing (RNA-seq) analysis of 27594 cells, we identify CD adenoma transcriptomic signatures compared with adjacent normal cells, with validation by bulk RNA-seq, DNA methylation, qRT-PCR, and immunohistochemistry. CD adenoma cells include a subpopulation of proliferating, terminally differentiated corticotrophs. In CD adenomas, we find recurrent promoter hypomethylation and transcriptional upregulation of PMAIP1 (encoding pro-apoptotic BH3-only bcl-2 protein noxa) but paradoxical noxa downregulation. Using primary CD adenoma cell cultures and a corticotroph-enriched mouse cell line, we find that selective proteasomal inhibition with bortezomib stabilizes noxa and induces apoptosis, indicating its utility as an anti-tumor agent.

Keywords: CP: Cancer; CP: Molecular biology; Cushing’s disease; DNA methylation; bortezomib; preclinical testing; proteasome; single-cell RNA-seq; sporadic pituitary adenoma.


Conflict of interest statement

Declaration of interests The authors declare no competing interests.

Figures

Figure 1.
Figure 1.. Surgical annotation captures canonical pituitary cell classes in post-natal pituitary gland
(A) A sublabial transsphenoidal approach was used for resection of microadenomas (white arrowheads) in patients with Cushing’s disease (CD). Coronal, post-gadolinium contrast enhanced magnetic resonance image from patient P1. Adenoma and adjacent normal pituitary gland were separately annotated during surgery and dissociated into a single-cell suspension, followed by GEM embedding, sequencing, and computational analysis. Scale bar: 2 cm. (B) Summary of demographic data and analysis for patients included in the study. (C) UMAP embedding of cells from the 6 patient samples with CD, GH, NFPA, and PRL adenomas used in scRNA-seq analysis. Cells cluster according to dominant secretory phenotype. (D) UMAP embedding showing the cell-type identities cells from the 6 patient samples. (E) UMAP embedding showing CD sample identity for cells from patients P1, P2, and P3. (F) UMAP plot showing CD patient cells clustering by cell-type identity. Cell types: leukocytes (Les), endothelial cells (ECs), pericytes (Pes), folliculostellate cells (FSs), corticotrophs (Cs), gonadotroph (Gs), somatotrophs (Ss), lactotrophs (Ls), ambiguous/somato-lactotrophs (SLs), and POU1F1-positive, hormone-negative (P+H) cells. GH, growth hormone; NFPA, non-functioning pituitary adenoma; PRL, prolactinoma.
Figure 2.
Figure 2.. Canonical pituitary cell classes are identified across samples
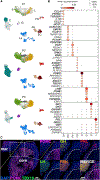
(A) The UMAP plot from Figure 1F split by patient (top, P1; middle, P2; bottom, P3), colored by cell type. (B) Dot plot showing the expression (marker color) and percentage of cells expressing (marker size) for the top 6 cell-type upregulated genes with highest min.logFC.detected from a filtered group of robustly upregulated cell-type marker genes (STAR Methods). Genes used as a priori known classification marker genes are indicated by bold font. (C) Multiplexed immunohistochemistry of tissue from P3, showing localization of key hormone markers in margin and core regions of the sample. White bar: 100 μm. PC, pituitary cells; HPC, hormone-producing cells; Mar, tumor margin; POMC, pro-opiomelanocortin; GH, growth hormone; PRL, prolactin; LH, luteinizing hormone; FSH, follicle-stimulating hormone.
Figure 3.
Figure 3.. Consensus-dominant genes in adenomas causing CD
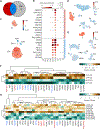
Core and margin sample corticotrophs were separately compared with all other cell types with scran’s scoreMarkers, using patient identity as a blocking factor. Stringent thresholds on effect sizes were used to identify a core set of robustly upregulated markers (STAR Methods). (A) Venn diagram showing the number of core-specific (red), margin-specific (grey), and common (blue) marker genes identified. (B) Dot plot showing the mean expression (marker color) and percentage (marker size) of each cell type expressing core-sample-specific genes (CD signature genes; top group, red in A) and corticotroph marker genes common to core and margin samples, which include canonical marker genes (bottom group, blue in A). Mean expression values are batch corrected across patients using scran correctSummaries. POMC expression was normalized to the second most highly expressed value to better show the levels of other genes (mean POMC: 8.29). (C) UMAP plot of all C cells indicating the CD signature gene score per cell. (D) UMAP plots for all cells from each patient show that cells with high CD signature scores are restricted to cell clusters classified as corticotrophs. (E) UMAP plots for other adenoma subtypes including prolactinoma (PRL) and nonfunctioning pituitary adenoma (NFPA) verify that cells with high CD signature scores are specific to Cushing’s adenomas (C). (F) Independent verification of overexpression of CD signature genes in pairwise bulk RNA-seq analysis of CD adenoma and adjacent normal pituitary gland (P4 and P5). Genes coidentified between bulk RNA-seq and scRNA-seq are color coded as in (B). (G) Bulk RNA-seq comparison of CD and non-CD samples also verified upregulation of several CD signature and corticotroph marker genes.
Figure 4.
Figure 4.. Non-stem-like proliferating cells localize to the adenoma compartment
(A) UMAP plot of corticotroph cells showing cell-cycle gene scores per cell. We defined proliferating cells (Pros) for further study to have a cycle score >0.01. (B) Dot plot showing 12 top expressed genes upregulated in Pros. These cells clearly expressed canonical corticotroph marker genes POMC and TBX19 in addition to cell-cycle genes. (C) UMAP plot showing cell-cycle score across all six scRNA-seq patient samples, showing specificity to the C cluster and some Le cells, as well as localization to the NFPA, and PRL adenoma clusters. (D) SOX2-positive cells are restricted to the cell cluster classified as FS cells and not expressed in the corticotroph compartment. (E) Dot plot of select genes associated with pituitary stem cells (Cox et al., 2017; Fletcher et al., 2019) showing lack of expression in adenoma samples.
Figure 5.
Figure 5.. Human adenomas causing wild-type CD have discrepant PMAIP1 transcript and noxa abundance
(A) UMAP plot demonstrating PMAIP1 abundance in CD adenomas (C) but not in PRL, G, or NFPA adenomas. PMAIP1 was also detected at lower levels in Les and ECs. (B) UMAP plot showing MYC upregulation in CD corticotrophs but not other hormone-producing cells (left panel). MYC expression was also detected in Pes, ECs, and Les. Middle panel: UMAP plot showing overlap of MYC and PMAIP1 expression is mostly limited to CD corticotrophs (yellow dots). Right panel: UMAP plot showing UCHL1 abundance in most hormone-producing cell types in CD. (C) Bulk RNA-seq of CD and non-CD samples verified overexpression of pro-apoptotic genes including PMAIP1 in CD tissues. (D) DNA methylation levels (beta values) at CpG sites associated with the PMAIP1 promoter methylation demonstrating hypomethylation in CD (n = 3) compared with normal (autopsy-derived, n = 20) pituitary glands. *p < 0.05. (E) Multiplex immunohistochemistry (mIHC) of 5 μm thick sections from a CD adenoma. Insets from the core-margin boundary represented by white dashed lines. White bar: 100 μm. Core-margin boundary identified by overlaying expression of POMC, TBX19, and DAPI. Compared with the margin, core adenoma cells show robust overexpression of POMC, TBX19, and MYC; however, noxa expression is decreased within the adenoma core. (F) Representative image from noxa IHC in independent adenoma/normal pairs (n = 10). Pairwise analysis of noxa deconvoluted IHC images (absorbance = mean pixel intensity count per pixel) showing suppressed noxa signal in CD adenomas compared with normal (margin) tissues (p = 0.0013; 95% confidence interval [CI] −0.027 to −0.007). Scale bar: 100 μM. (G) Expected epithelial growth factor (EGF) signaling upregulation and ERK1/2 phosphorylation were found in human CD adenoma primary cell lines (P6_CD and P26_CD). A, adenoma (core); N, normal (margin) pituitary gland. Noxa was undetectable or decreased in core adenomas. (H) A survey of human primary CD adenoma cell lines revealed variable noxa expression compared with sCD adenoma, GH adenoma, and NFPA. CD, corticotroph adenoma causing Cushing’s disease; sCD, hormonally silent corticotroph adenoma; GH, growth-hormone-secreting adenoma; NFPA, non-functioning pituitary adenoma.
Figure 6.
Figure 6.. Proteasome inhibition rescues noxa and accelerates apoptotic cell death in wild-type CD adenomas
(A) Mouse pituitary cells (3 biological replicates) were flow sorted and enriched for cortricotropin-releasing hormone receptor (CRFR1). (B) The cell line enriched for corticotrophs (mCort) demonstrated markers of corticotroph differentiation using PCR arrays (3 biological replicates per cell line). Gene expression remained stable after addition of EGF. (C) The ACTH-producing CD phenotype was recapitulated following lentiviral human EGFR transduction (mCortEGFR) with increased POMC processing to ACTH (n = 3). (D) Representative bright-field image showing mCort cells with elongated processes and abundant intracellular organelles. (E) The tumorigenic sequence of CD adenomas was recapitulated with relative overexpression (qRT-PCR; ΔCT; GAPDH) of both POMC and PMAIP1 (2 experiments in technical triplicates) following lentiviral human EGFR transduction (mCortEGFR). *p < 0.05. (F) Cycloheximide chase study (2 experiments) in murine mCort cells demonstrated post-translational degradation of noxa that was arrested with proteasome inhibitor bortezomib (5 nM, BORT.). (G) Bortezomib (5 nM) decreased MYC protein levels in mCortEGFR but not in mCortEV cells (2 independent experiments). (H) Bortezomib (5 nM) induced minimal transcriptional upregulation of PMAIP1 in mCort cells, suggesting a predominantly post-translational effect (3 independent experiments in technical triplicates). (I) Supernatant from mCortEGFR cultures showed elevated ACTH production with EGFR overexpression recapitulating the adenoma phenotype (ACTH oversecretion; 3 independent experiments in technical triplicates). Additionally, bortezomib exposure reduced ACTH in supernatant from mCortEGFR cells. *p < 0.05. (J) Bortezomib resulted in elevated cleaved PARP (cPARP) and cleaved caspase-3 (cCaspase3) in mCortEGFR cells following exposure to bortezomib (5 nM, 6 h; 2 replicates). (K) Bortezomib exposure for 24 h decreased survival in mCortEGFR cells at lower bortezomib concentrations (IC50: 1.5 nM) compared with in mCortEV cells (IC50: 3.096 nM). **p = 0.0087, 0.0066, and 0.0080 for 24, 48, and 72 h, respectively. Data shown for dose response performed on each cell line in triplicate and timed survival in duplicate. *p < 0.05. (L–N) Biological duplicates. (L) Pairwise analysis of adenoma and normal cells from a patient with CD (P26_CD). Responses to DMSO control versus EGFR inhibitor gefitinib (GEF), UCHL-1 inhibitor LDN-57444 (LDN), or proteasomal inhibitor bortezomib (BORT). Protein levels of EGFR; DMSO, dimethyl sulfoxide; EGFR, epidermal growth factor receptor; UCHL-1, ubiquitin C-terminal hydrolase L1. (M) Patient-derived CD adenoma primary cell lines P7 and P6 demonstrated elevated EGFR expression at baseline that was suppressed with EGF (100 ng, 24 h) exposure. Bortezomib (5 nM, 6 h) induced noxa at a higher level than gefitinib (10 μM, 6 h) or UCHL1 inhibitor LDN (15 μM, 6 h). (N) Bortezomib induced markers of apoptosis with cPARP and cCaspase3 in human-derived primary CD adenoma cells. (O) Bortezomib (24 h) decreased cumulative survival in human-derived primary cell lines from CD (n = 5; IC50: 5.929 nM) and non-CD (n = 3; IC50: 18.42 nM) cell lines (p < 0.0001); data shown in triplicates.

Comment in

Similar articles

Cited by

References

    1. Abbud RA, Takumi I, Barker EM, Ren SG, Chen DY, Wawrowsky K, and Melmed S (2005). Early multipotential pituitary focal hyperplasia in the α-subunit of glycoprotein hormone-driven pituitary tumor-transforming gene transgenic mice. Mol. Endocrinol 19, 1383–1391. 10.1210/me.2004-0403. - DOI - PubMed
    1. Alexander JM, Biller BM, Bikkal H, Zervas NT, Arnold A, and Klibanski A (1990). Clinically nonfunctioning pituitary tumors are monoclonal in origin. J. Clin. Invest 86, 336–340. 10.1172/JCI114705. - DOI - PMC - PubMed
    1. Allaerts W, Tijssen AM, Jeucken PH, Drexhage HA, and de Koning J (1994). Influence of folliculo-stellate cells on biphasic luteinizing hormone secretion response to gonadotropin-releasing hormone in rat pituitary cell aggregates. Eur. J. Endocrinol 130, 530–539. 10.1530/eje.0.1300530. - DOI - PubMed
    1. Andoniadou CL, Matsushima D, Mousavy Gharavy SN, Signore M, Mackintosh AI, Schaeffer M, Gaston-Massuet C, Mollard P, Jacques TS, Le Tissier P, et al. (2013). Sox2+ stem/progenitor cells in the adult mouse pituitary support organ homeostasis and have tumor-inducing potential. Cell Stem Cell 13, 433–445. 10.1016/j.stem.2013.07.004. - DOI - PubMed
    1. Asuzu D, Chatain GP, Hayes C, Benzo S, McGlotten R, Keil M, Beri A, Sharma ST, Nieman L, Lodish M, et al. (2017). Normalized early postoperative cortisol and ACTH values predict nonremission after surgery for Cushing disease. J. Clin. Endocrinol. Metab 102, 2179–2187. 10.1210/jc.2016-3908. - DOI - PMC - PubMed

Publication types

Substances