. 2022 Aug 23;40(8):111248.
doi: 10.1016/j.celrep.2022.111248.

Targeting the tamoxifen receptor within sodium channels to block osteoarthritic pain

Affiliations

Targeting the tamoxifen receptor within sodium channels to block osteoarthritic pain

Megan M McCollum et al. Cell Rep. .

Abstract

Voltage-gated sodium channels (NaV) in nociceptive neurons initiate action potentials required for transmission of aberrant painful stimuli observed in osteoarthritis (OA). Targeting NaV subtypes with drugs to produce analgesic effects for OA pain management is a developing therapeutic area. Previously, we determined the receptor site for the tamoxifen analog N-desmethyltamoxifen (ND-Tam) within a prokaryotic NaV. Here, we report the pharmacology of ND-Tam against eukaryotic NaVs natively expressed in nociceptive neurons. ND-Tam and analogs occupy two conserved intracellular receptor sites in domains II and IV of NaV1.7 to block ion entry using a "bind and plug" mechanism. We find that ND-Tam inhibition of the sodium current is state dependent, conferring a potent frequency- and voltage-dependent block of hyperexcitable nociceptive neuron action potentials implicated in OA pain. When evaluated using a mouse OA pain model, ND-Tam has long-lasting efficacy, which supports the potential of repurposing ND-Tam analogs as NaV antagonists for OA pain management.

Keywords: CP: Neuroscience; DRG neurons; molecular pharmacology; nociceptors; osteoarthritis; pain; sodium channel.


Conflict of interest statement

Declaration of interests The authors declare no competing interests.

Figures
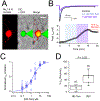
Figure 1.
Figure 1.. Tamoxifen metabolites inhibit endogenous voltage-gated sodium channels expressed in murine DRG neurons.
A) DIC and fluorescence images of voltage clamped DRG neuron isolated and cultured from an NaV1.8-tomato mouse. Continuity with the patched neuron is indicted by the GFP (Alexa Fluor 488 dye 1 nM) loaded into the glass patch electrode. Scale bar = 25 μm B) Top, exemplar sodium currents (INa) recorded in control saline and two concentrations of N-desmethyl tamoxifen (ND-Tam) from a voltage-clamped DRG neuron. INa was activated by 0.2 Hz train of 50 ms depolarizations to −10 mV from −100 mV holding potential. Bottom, time course of peak INa inhibition during control conditions and after 5 minutes of extracellular ND-Tam treatment. C) Resulting drug concentration- INa inhibition relationship for ND-Tam fit to the Hill equation. Open symbols represent responses from individual cells and filled symbols represent average response per concentration. Error is equal to S.E.M. (n = 11) D) A comparison of the percent INa recovery after 3–10 μM ND-Tam or 1 mM carbamazepine (CBZ) inhibition. INa recovery was assessed after 5 minutes in control saline post drug exposure. Fewer INa recovered from ND-Tam exposure compared to CBZ exposure, 14.3 ± 5.4 % and 47.2 ± 9.6 %, respectively, and was statistically significant. (P = 0.03). Error is equal to S.E.M. and the number of cells evaluated per treatment group is indicated within the parentheses.
Figure 2.
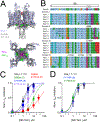
Figure 2.. The NaVMs tamoxifen receptor site is conserved in domain II and IV of human NaV1.7.
A) Structural alignment of human NaV1.7 (PDB: 6J8J) and the ND-Tam bound prokaryotic NavMs F208L channel (PDB: 6SXG)(Shen et al., 2019, Sula et al., 2021). The NavMs and NaV1.7 channel structures are reported to be in either pre-open or inactivated states. Inner (Sitein) and outer (Siteout) ND-Tam binding sites are indicated. B) Multiple sequence alignment of the sixth transmembrane segment (S6) from NavMs (UnitProt ID: A0L5S6) and each domain (I-IV) of DRG sodium channels NaV1.1 (Q99250), NaV1.6 (Q9UQD0); NaV1.7 (Q15858); NaV1.8 (Q9Y5Y9) and NaV1.9 (Q9UI33) using the standard Clustal color scheme by amino acid character. Proposed location of the ND-Tam receptor is boxed in red. The previously identified local antiesthetic/ anti-arrhythmic receptor site is boxed in yellow. C) Comparative ND-Tam potency for NaV1.7 channels expressing alanine substitutions at proposed receptors for tamoxifens, and D) local anesthetic receptor sites. Drug concentration- INa inhibition relationships for ND-Tam are fit to the Hill equation. Open symbols represent responses from individual cells and filled symbols represent average response per concentration. Error is equal to S.E.M. and the number of cells evaluated per treatment group is indicated within the parentheses.
Figure 3.
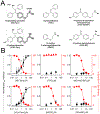
Figure 3.. Structure related activity of analogs at the NaV tamoxifen receptor, as assessed by competitive binding results and DRG sodium current inhibition.
A) Molecular structures of the tested tamoxifen analogues. B) Normalized sodium current inhibition recorded DRG responses (black), and percent specific binding of tritium labeled tamoxifen (red) to membrane preparations expressing NaV1.7, plotted as a function of tamoxifen analog concentration. Open symbols are results recorded from individual neurons. Filled symbols represent the average response at each concentration. Percent specific binding was averaged from four trials. Error is equal to S.E.M.
Figure 4.
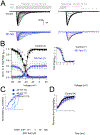
Figure 4.. The mechanism of N-desmethyl tamoxifen inhibition of sensory neuron sodium currents.
A) Voltage step protocol (gray) and resulting DRG INa traces before and after 1 μM ND-Tam application. B) The impact of ND-Tam on voltage-dependent sodium channel function. Left, conductance (G)-voltage and inactivation-voltage relationships were measured by plotting the average conductance and reduction of test pulse INa, respectively, as a function of pre-pulse potential. Both relationships were fit to a Boltzmann equation. Open symbols represent responses from individual cells and filled symbols represent average responses. The half-maximal conductance-voltage relationship was not different (P = 0.90) when measured in control saline (V1/2 = −38.3 ± 0.3 mV) compared to ND-Tam conditions (V1/2 = −37.7 ± 0.4 mV). Right, the test pulse current from control and drug conditions normalized to the same scale. The voltage-dependence of inactivation in control conditions and after drug treatment were equal to −47.6 ± 0.4 mV and −51.9 ± 0.4 mV, respectively, and were statistically different (P = 0.01), based on results from a paired two-tailed Student’s t-test. C) Voltage-dependent inhibition of DRG INa by ND-Tam. The potency of ND-Tam inhibition of INa was assessed using the voltage protocol described in Figure 1B, while using −40 mV, −60 mV and −100 mV holding potentials. The resulting drug concentration-INa relationships were fit to the Hill equation. The corresponding IC50 for each holding potential is listed in Supplemental Table 1 and the P-value from a two-tailed Student’s t-test comparing −100 mV to −60 mV and −40 mV results are indicated on the graph. Open symbols represent responses from individual cells and filled symbols represent average responses. D) DRG neuron INa recovery from inactivation (τrec.) before and after ND-Tam treatment. Sodium currents were inactivated by a 4 ms pre-pulse to 0 mV followed by an identical test pulse separated by increasing recovery times. The ratio of test pulse and pre-pulse current is plotted as a function of recovery time and fit to a single exponential equation. Recovery of INa from inactivation was delayed after 3 μM ND-Tam exposure (τrec. = 1.1 ± 0.1 ms) compared to control conditions (τrec. = 1.4 ± 0.1 ms) and was statistically significant (P = 0.01). Error is equal to S.E.M. and the number of cells evaluated per treatment group are indicated within the parentheses.
Figure 5.
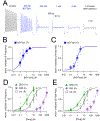
Figure 5.. N-desmethyl tamoxifen inhibits DRG action potential amplitude and frequency.
A) Exemplar action potentials recorded from an isolated DRG neuron in control and ND-Tam-treated conditions using a 1 second, 80 pA injection of current. After the experiment was complete, drug was washed out of the bath for five minutes and recovery from inhibition was retested. Consistent with previous reports, the resting membrane potential of the DRG neurons was −59.2 ± 5 mV (Error is equal to S.D., n = 109)(Wang et al., 1994). B, C) The potency of ND-Tam inhibition on DRG action potential frequency and peak amplitude. Open symbols represent responses from individual cells while filled symbols represent average response per concentration. Error is equal to S.E.M. and the number of cells evaluated per treatment group is indicated within the parentheses. D, E) A comparison of the potency of lidocaine (Lid.), cannabidiol (CBD) and carbamazepine (CBZ) inhibition on action potential frequency and peak amplitude. Drug concentration-INa inhibition relationships are fit to the Hill equation. The corresponding half-maximal inhibitory concentrations (IC50) for each drug are listed in Supplemental Table 3. Open symbols represent responses from individual cells and filled symbols represent average response per concentration. Error is equal to S.E.M. and the number of cells evaluated per treatment group are indicated within the parentheses.
Figure 6.
Figure 6.. ND-Tam produces analgesia in mice with knee hyperalgesia 4 weeks post DMM surgery.
A) Knee withdrawal threshold was measured 4 weeks post DMM surgery and before intra-articular injection of vehicle (50% EtOH) or 50 μM ND-Tam and then at 30 min, 1h, 2h, and 24h post-injection. ND-Tam provided relief from hyperalgesia compared to vehicle 30 minutes after injection (n = 6, P = 0.008). B) Knee withdrawal thresholds assessed 4 weeks post DMM surgery, before and after intra-articular injection of vehicle (0.1% DMSO), 50 μM ND-Tam, 50 μM CBD, or 50 μM lidocaine at 30 min, 1h, 2h, 3h, and 24h time points. P-values are indicated on the graph for time points at which all three drugs are significantly different from vehicle. C) Area under the curve analysis of withdrawal thresholds for vehicle, ND-Tam, CBD, and Lidocaine from 0–3 hours after injection. ND-Tam performed similar to CBD and lidocaine over time (n = 5, P = 0.17, P = 0.13, respectively). D) Knee withdrawal thresholds assessed before DMM surgery (pre-DMM), and 4 weeks post DMM surgery, before (pre-inj) and after 3 days of intra-articular injection of vehicle (0.1% DMSO), 0.5 μM ND-Tam, or 0.5 μM Lidocaine at 0 (day 3 before final injection), 30 min, 1h, 2h, 3.5h, and 24h time points (on day 3 after the final injection). E) Area under the curve analysis of withdrawal thresholds for vehicle, ND-Tam, and Lidocaine from 0–3.5 hours after the 3rd injection. ND-Tam outperforms lidocaine after 3 days of repeated intra-articular injections (n = 5, P = 0.0001). A, B, D) Statistical analysis is stated in the associated data table, Supplemental Table 4; Dashed line indicates maximum of the assay = 450 g.

Similar articles

Cited by

References

    1. AKOPIAN AN, SIVILOTTI L & WOOD JN 1996. A tetrodotoxin-resistant voltage-gated sodium channel expressed by sensory neurons. Nature, 379, 257–62. - PubMed
    1. ALLEN KD, THOMA LM & GOLIGHTLY YM 2022. Epidemiology of osteoarthritis. Osteoarthritis Cartilage, 30, 184–195. - PMC - PubMed
    1. BAGNERIS C, DECAEN PG, NAYLOR CE, PRYDE DC, NOBELI I, CLAPHAM DE & WALLACE BA 2014. Prokaryotic NavMs channel as a structural and functional model for eukaryotic sodium channel antagonism. Proc Natl Acad Sci U S A, 111, 8428–33. - PMC - PubMed
    1. CASTANEDA-CASTELLANOS DR, NIKONOROV I, KALLEN RG & RECIO-PINTO E 2002. Lidocaine stabilizes the open state of CNS voltage-dependent sodium channels. Brain Res Mol Brain Res, 99, 102–13. - PubMed
    1. CATTERALL WA 2012. Voltage-gated sodium channels at 60: structure, function and pathophysiology. J Physiol, 590, 2577–89. - PMC - PubMed

Publication types