. 2022 Sep 15;82(18):3382-3397.e7.
doi: 10.1016/j.molcel.2022.07.011. Epub 2022 Aug 23.

Mitotic DNA synthesis is caused by transcription-replication conflicts in BRCA2-deficient cells

Affiliations

Mitotic DNA synthesis is caused by transcription-replication conflicts in BRCA2-deficient cells

Florian J Groelly et al. Mol Cell. .

Abstract

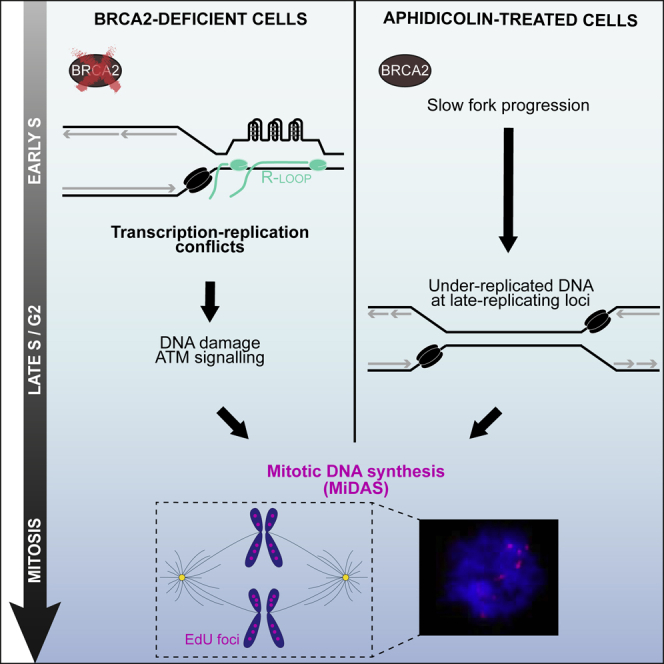
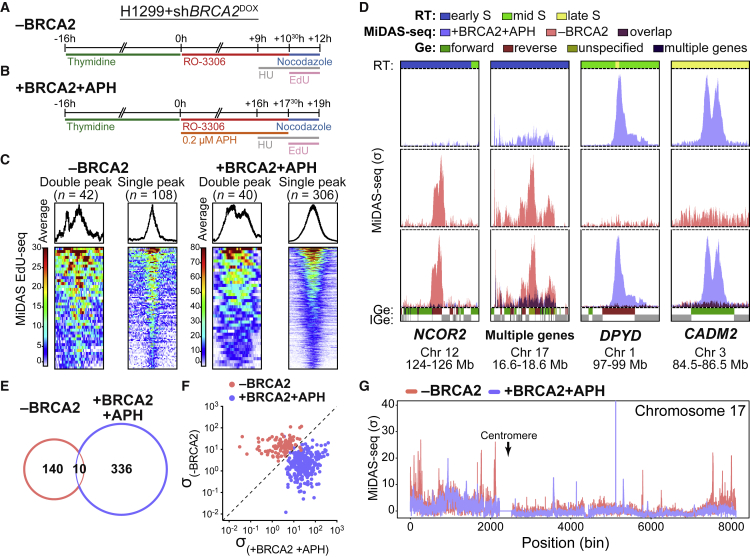
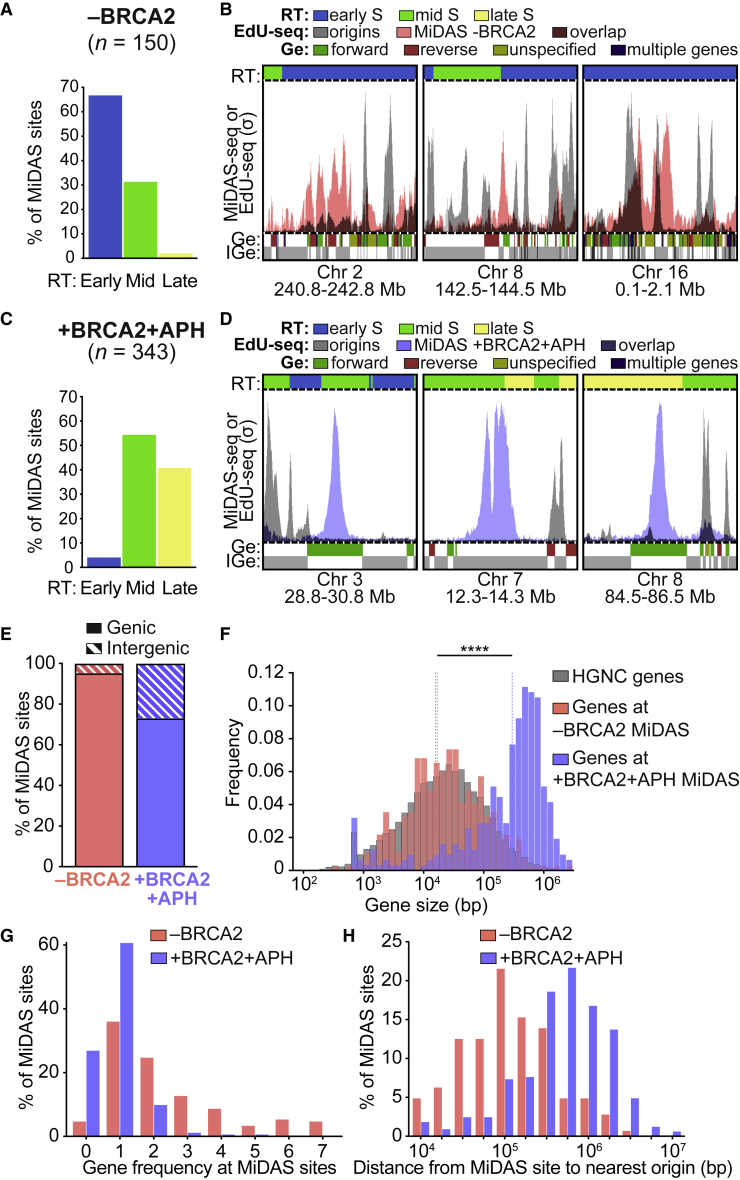
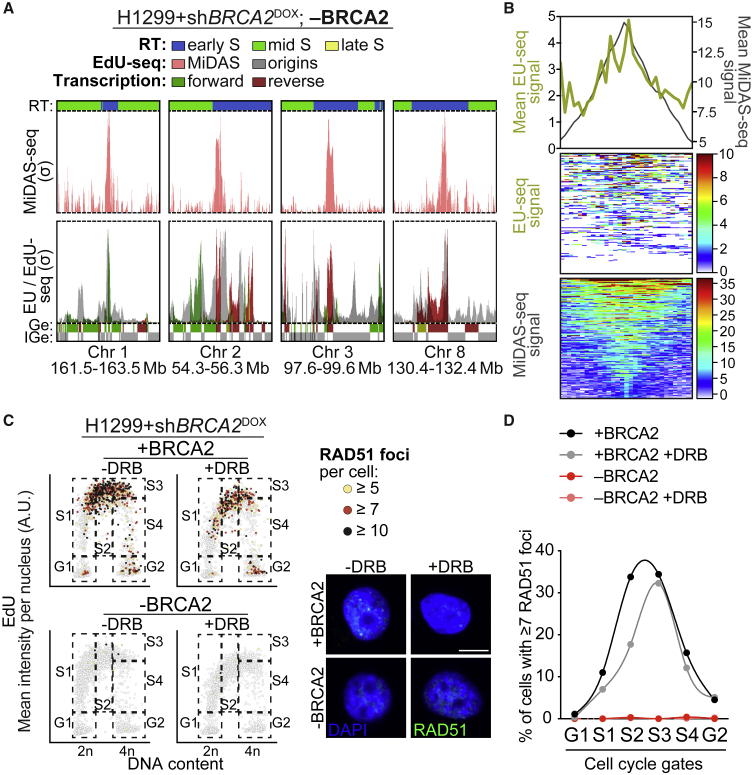
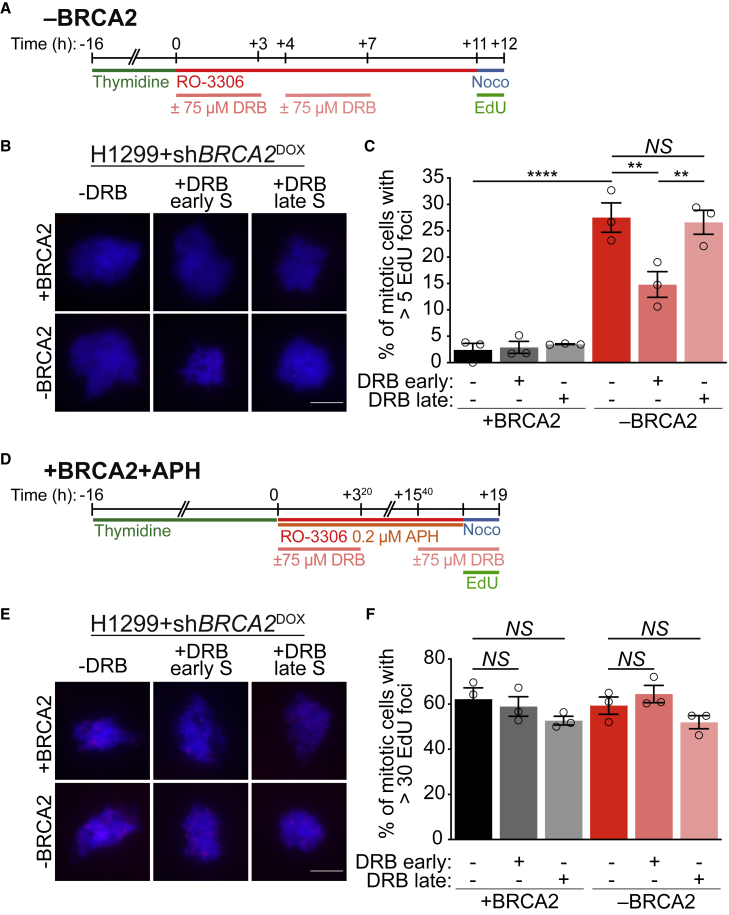
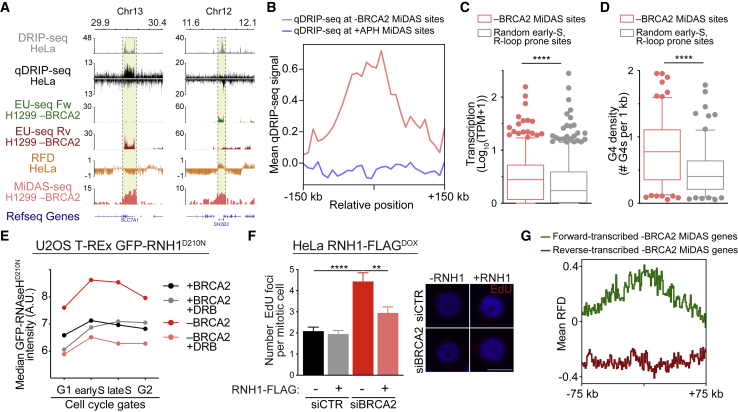
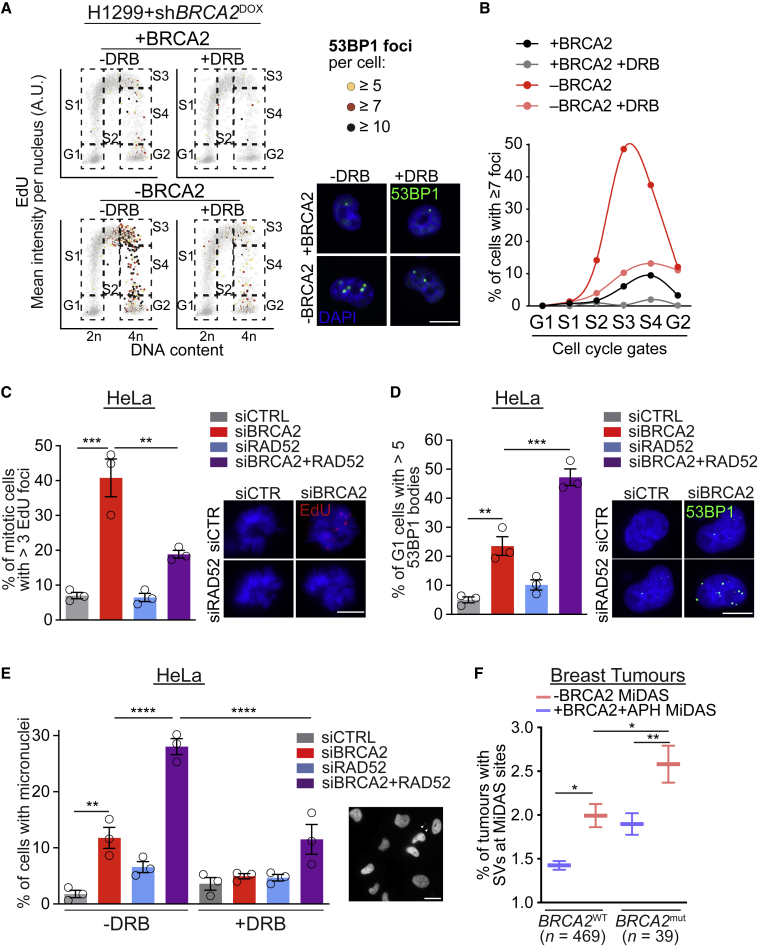
Aberrant replication causes cells lacking BRCA2 to enter mitosis with under-replicated DNA, which activates a repair mechanism known as mitotic DNA synthesis (MiDAS). Here, we identify genome-wide the sites where MiDAS reactions occur when BRCA2 is abrogated. High-resolution profiling revealed that these sites are different from MiDAS at aphidicolin-induced common fragile sites in that they map to genomic regions replicating in the early S-phase, which are close to early-firing replication origins, are highly transcribed, and display R-loop-forming potential. Both transcription inhibition in early S-phase and RNaseH1 overexpression reduced MiDAS in BRCA2-deficient cells, indicating that transcription-replication conflicts (TRCs) and R-loops are the source of MiDAS. Importantly, the MiDAS sites identified in BRCA2-deficient cells also represent hotspots for genomic rearrangements in BRCA2-mutated breast tumors. Thus, our work provides a mechanism for how tumor-predisposing BRCA2 inactivation links transcription-induced DNA damage with mitotic DNA repair to fuel the genomic instability characteristic of cancer cells.

Keywords: BRCA2; MiDAS; R-loops; TRCs; genome stability; mitotic DNA synthesis; transcription-replication conflicts.


Conflict of interest statement

Declaration of interests T.D.H. has a part-time position as Chief Scientific Officer of FoRx Therapeutics, AG.

Figures

None
Graphical abstract
Figure 1
Figure 1
Genome-wide mapping of MiDAS sites in BRCA2-deficient cells (A) Experimental timeline for MiDAS-seq in BRCA2-deficient (−BRCA2) H1299 cells. BRCA2 shRNA was induced by addition of 2 μg/mL DOX to the growth media 48 h before starting the experiment. (B) Experimental timeline for MiDAS-seq in aphidicolin-treated BRCA2-proficient (+BRCA2 +APH) H1299 cells. (C) Average MiDAS-seq signal across all identified peaks in BRCA2-deficient (−BRCA2; n = 150) and aphidicolin-treated BRCA2-proficient (+BRCA2 +APH; n = 346) H1299 cells. Span of genomic region, 880 kb. (D) MiDAS-seq profiles (σ values) at representative genomic regions for BRCA2-deficient (−BRCA2; pink) and for aphidicolin-treated BRCA2-proficient (+BRCA2 +APH; blue) H1299 cells. RT, replication timing; Ge, genes; IGe, intergenic regions. Bin resolution, 10 kb. (E) Venn diagram of overlapping MiDAS sites (within ±600 kb) between BRCA2-deficient (−BRCA2) and aphidicolin-treated BRCA2-proficient (+BRCA2 +APH) H1299 cells. (F) Scatterplots of MiDAS-seq σ values at all peaks shown in (C). (G) Whole-chromosome view of the MiDAS-seq profiles (σ values) across chromosome 17 for BRCA2-deficient (−BRCA2; pink) and aphidicolin-treated BRCA2-proficient (+BRCA2 +APH; blue) H1299 cells. See also Figures S1–S3 and Tables S1 and S2.
Figure 2
Figure 2
MiDAS sites induced by BRCA2 inactivation map to genes within early-replicating genomic regions (A) Distribution of MiDAS sites (n = 150) identified in BRCA2-deficient (−BRCA2) H1299 cells within genomic regions replicating in early, mid, and late S-phase. (B) MiDAS sites identified using MiDAS-seq (pink) and replication initiation sites identified using EdU-seq (Dagg et al., 2021; gray) at representative genomic regions in BRCA2-deficient (−BRCA2) H1299 cells. RT, replication timing; Ge, genes; IGe, intergenic regions. Bin resolution, 10 kb. (C) Similar to (A) for MiDAS sites (n = 343) identified in aphidicolin-treated BRCA2-proficient (+BRCA2 +APH) H1299 cells. Note: 3 sites have undefined replication timing. (D) Similar to (B) for MiDAS sites identified using MiDAS-seq (blue) in aphidicolin-treated BRCA2-proficient (+BRCA2 +APH) H1299 cells. (E) Distribution of genic and intergenic MiDAS sites in BRCA2-deficient (−BRCA2; n = 150; pink) and in aphidicolin-treated BRCA2-proficient (+BRCA2 +APH; n = 346; blue) H1299 cells. (F) Size frequency distribution of all protein-encoding human genes in HGNC database (gray) and of protein-encoding genes within genic MiDAS sites shown in (E). The analysis includes 367 genes in BRCA2-deficient (−BRCA2; pink) and 314 genes in aphidicolin-treated BRCA2-proficient (+BRCA2 +APH; blue) H1299 cells. Dotted lines indicate median values for each gene set. Statistical significance was determined by a two-tailed Mann-Whitney test; ∗∗∗∗p ≤ 0.0001. (G) Gene frequency in the vicinity (±50 kb) of MiDAS site in BRCA2-deficient (−BRCA2; pink) and aphidicolin-treated BRCA2-proficient (+BRCA2 +APH; blue) H1299 cells. (H) Frequency distribution of the distance between each MiDAS site and the nearest origin in BRCA2-deficient (−BRCA2; n = 146; pink) and aphidicolin-treated BRCA2-proficient (+BRCA2 +APH; n = 333; blue) H1299 cells. See also Figure S3.
Figure 3
Figure 3
Genes within MiDAS sites are transcribed in early S-phase (A) Top row: MiDAS-seq profiles (σ value) at representative genomic regions in BRCA2-deficient (−BRCA2) H1299 cells. Bottom row: EU-seq profiles (σ value) for nascent transcription at the same genomic sites, detected 100 min after release from single thymidine block (green, forward direction of transcription; red, reverse). Replication initiation profiles are shown in gray. RT, replication timing; Ge, genes; IGe, intergenic regions. Bin resolution, 10 kb. (B) Average EU-seq signal for nascent transcription (yellow) and MiDAS-seq signal (black), centered across MiDAS peaks (n = 150) identified in BRCA2-deficient (−BRCA2) H1299 cells. Span of genomic region, 200 kb. (C) BRCA2-proficient (+BRCA2) and -deficient (−BRCA2) H1299 cells were treated with 75 μM DRB for 4 h, pulse-labeled with EdU for 30 min. QIBC scatterplots of DNA content versus EdU mean intensity show RAD51 foci number in color scale. Boxes indicate cell populations used for quantification. Representative images of RAD51 foci (green) and DAPI staining (blue) for the 4 conditions are shown. DAPI, 4′,6-diamidino-2-phenylindole. Scale bars, 10 μm. (D) Quantification of cells treated as in (C) and having ≥7 RAD51 foci per cell. Graph shows data from one experiment representative of n = 2 independent experiments.
Figure 4
Figure 4
MiDAS events in BRCA2-deficient cells are dependent on early S-phase transcription (A) Experimental timeline for detection of mitotic EdU foci in BRCA2-proficient (+BRCA2) or deficient (−BRCA2) H1299 cells. BRCA2 shRNA was induced by the addition of 2 μg/mL DOX to the growth media 48 h before starting the experiment. (B) Representative images of cells treated as in (A). Scale bars, 10 μm. (C) Quantification of mitotic cells treated as in (A) and having >5 EdU foci per cell. Graph and error bars represent the mean and SEM of n = 3 independent experiments. A minimum of 50 cells were analyzed per condition per experiment. (D) Experimental timeline for detection of mitotic EdU foci in aphidicolin-treated BRCA2-proficient (+BRCA2+APH) or -deficient (−BRCA2+APH) H1299 cells. BRCA2 shRNA was induced by the addition of 2 μg/mL DOX to the growth media 48 h before starting the experiment. (E) Representative images of cells treated as in (D). Scale bars, 10 μM. (F) Quantification of EdU foci per mitotic cell treated as in (D) >30 foci per cell. Graph and error bars represent the mean and SEM of n = 3 independent experiments. A minimum of 50 cells were analyzed per condition per experiment. p values were calculated using one-way ANOVA followed by a Tukey test. ∗∗p ≤ 0.01; ∗∗∗∗p ≤ 0.0001; NS, p > 0.05. See also Figure S3.
Figure 5
Figure 5
MiDAS events induced by BRCA2 inactivation map to regions of R-loop formation (A) Representative genomic regions of DRIP-seq and qDRIP-seq analyses performed in asynchronous HeLa cells (Crossley et al., 2020; Hamperl et al., 2017), RFD analysis performed in HeLa cells (Petryk et al., 2016), and EU-seq and MiDAS-seq analysis performed in BRCA2-deficient (−BRCA2) H1299 cells. EU-seq was performed 100 min after release from thymidine block. (B) Average qDRIP-seq signal centered across MiDAS peaks identified in BRCA2-deficient (n = 150; −BRCA2; pink) or aphidicolin-treated BRCA2-proficient (n = 346; +BRCA2 +APH; blue) H1299 cells. Span of genomic region, 300 kb. (C) Transcript levels measured by EU-seq 100 min after release from single thymidine block in BRCA2-deficient (−BRCA2) H1299 cells for genes found in the vicinity (±50 kb) of MiDAS sites identified in BRCA2-deficient (−BRCA2) cells or at 150 randomly selected early-replicating, R-loop-prone sites. (D) G-quadruplex (G4) density at MiDAS sites identified in BRCA2-deficient (−BRCA2) cells or at 150 randomly selected early-replicating, R-loop-prone sites. (E) Quantification of RNA-DNA hybrids measured by QIBC of mean chromatin-bound GFP-RNaseH1D210N signal. Graph shows the median values obtained for each of the indicated cell-cycle stages and is representative of n = 3 independent experiments. (F) Quantification of mitotic EdU foci in HeLa expressing a DOX-inducible, FLAG-tagged RNaseH1 (RNH1-FLAG), treated as indicated and collected 9 h after release from single thymidine block with 20 mM EdU added during the final hour. Graph and error bars represent the mean and SEM of a total of 156 mitotic cells per conditions from n = 3 independent experiments. Representative images are shown. Scale bars, 16 μm. (G) Replication fork directionality (RFD) measured by OK-seq (Petryk et al., 2016) at MiDAS sites identified in BRCA2-deficient H1299 cells, which contain a single gene. 22 genes transcribed in the forward direction (green) and 32 genes transcribed in the reverse direction (red) were analyzed. Span of genomic region, 150 kb. p values were calculated using an unpaired two-tailed t test (C and D) or using one-way ANOVA followed by a Tukey test (F). ∗∗p ≤ 0.01; ∗∗∗∗p ≤ 0.0001. See also Figures S4 and S5 and Tables S3 and S4.
Figure 6
Figure 6
RAD52 is required for MiDAS reactions that preserve the genomic integrity of BRCA2-deficient cells (A) BRCA2-proficient (+BRCA2) and -deficient (−BRCA2) H1299 cells were treated with 75 μM DRB for 4 h, pulse-labeled with EdU for 30 min. QIBC scatterplots of DNA content versus EdU mean intensity show 53BP1 foci number in color scale. Boxes indicate cell populations used for quantification. Representative images of 53BP1 foci (green) and DAPI staining (blue) for the 4 conditions are shown. Scale bars, 10 μm. (B) Quantification of cells treated as in (A) and having ≥7 53BP1 foci per cell. Graph shows data from one experiment representative of n = 3 independent experiments. (C) Quantification of mitotic cells with >3 EdU foci collected 9 h after release from single thymidine block. Graph and error bars represent the mean and SEM of n = 3 independent experiments. A minimum of 50 cells were analyzed per condition per experiment. Representative images are shown. Scale bars, 7 μm. (D) Quantification of G1 cells with >5 53BP1 nuclear bodies collected 10 h after release from single thymidine block. Graph and error bars represent the mean and SEM of n = 3 independent experiments. A minimum of 60 cells were analyzed per condition per experiment. Representative images are shown. Scale bars, 7 μm. (E) Quantification of G1 cells with micronuclei collected 10 h after release from single thymidine block and treated or not with DRB during the first 100 min. Graph and error bars represent the mean and SEM of n = 3 independent experiments. A minimum of 90 cells were analyzed per condition per experiment. (F) Percentage of BRCA2-wild-type (n = 469) and BRCA2-mutated (n = 39) breast tumors (Nik-Zainal et al., 2016) containing structural variants (SVs) at individual MiDAS sites. A total of n = 150 MiDAS sites identified in BRCA2-deficient (−BRCA2) H1299 cells and of n = 346 MiDAS sites identified in aphidicolin-treated BRCA2-proficient (+BRCA2 +APH) H1299 cells were analyzed. p values were calculated using one-way ANOVA followed by a Tukey test. p ≤ 0.05; ∗∗p ≤ 0.01; ∗∗∗p ≤ 0.001; ∗∗∗∗p ≤ 0.0001. See also Figure S6.

References

    1. Anand R.P., Lovett S.T., Haber J.E. Break-induced DNA replication. Cold Spring Harb. Perspect. Biol. 2013;5:a010397. doi: 10.1101/cshperspect.a010397. - DOI - PMC - PubMed
    1. Aymard F., Aguirrebengoa M., Guillou E., Javierre B.M., Bugler B., Arnould C., Rocher V., Iacovoni J.S., Biernacka A., Skrzypczak M., et al. Genome-wide mapping of long-range contacts unveils clustering of DNA double-strand breaks at damaged active genes. Nat. Struct. Mol. Biol. 2017;24:353–361. doi: 10.1038/nsmb.3387. - DOI - PMC - PubMed
    1. Bai Y., Symington L.S. A Rad52 homolog is required for RAD51-independent mitotic recombination in Saccharomyces cerevisiae. Genes Dev. 1996;10:2025–2037. doi: 10.1101/gad.10.16.2025. - DOI - PubMed
    1. Balmus G., Pilger D., Coates J., Demir M., Sczaniecka-Clift M., Barros A.C., Woods M., Fu B., Yang F., Chen E., et al. ATM orchestrates the DNA-damage response to counter toxic non-homologous end-joining at broken replication forks. Nat. Commun. 2019;10:87. doi: 10.1038/s41467-018-07729-2. - DOI - PMC - PubMed
    1. Bhatia V., Barroso S.I., García-Rubio M.L., Tumini E., Herrera-Moyano E., Aguilera A. BRCA2 prevents R-loop accumulation and associates with TREX-2 mRNA export factor PCID2. Nature. 2014;511:362–365. doi: 10.1038/nature13374. - DOI - PubMed

Publication types

LinkOut - more resources