. 2022 Aug;10(8):e004832.
doi: 10.1136/jitc-2022-004832.

Snail-regulated exosomal microRNA-21 suppresses NLRP3 inflammasome activity to enhance cisplatin resistance

Affiliations

Snail-regulated exosomal microRNA-21 suppresses NLRP3 inflammasome activity to enhance cisplatin resistance

Han-Ying Cheng et al. J Immunother Cancer. 2022 Aug.

Abstract

Background: Compared with the precise targeting of drug-resistant mutant cancer cells, strategies for eliminating non-genetic adaptation-mediated resistance are limited. The pros and cons of the existence of inflammasomes in cancer have been reported. Nevertheless, the dynamic response of inflammasomes to therapies should be addressed.

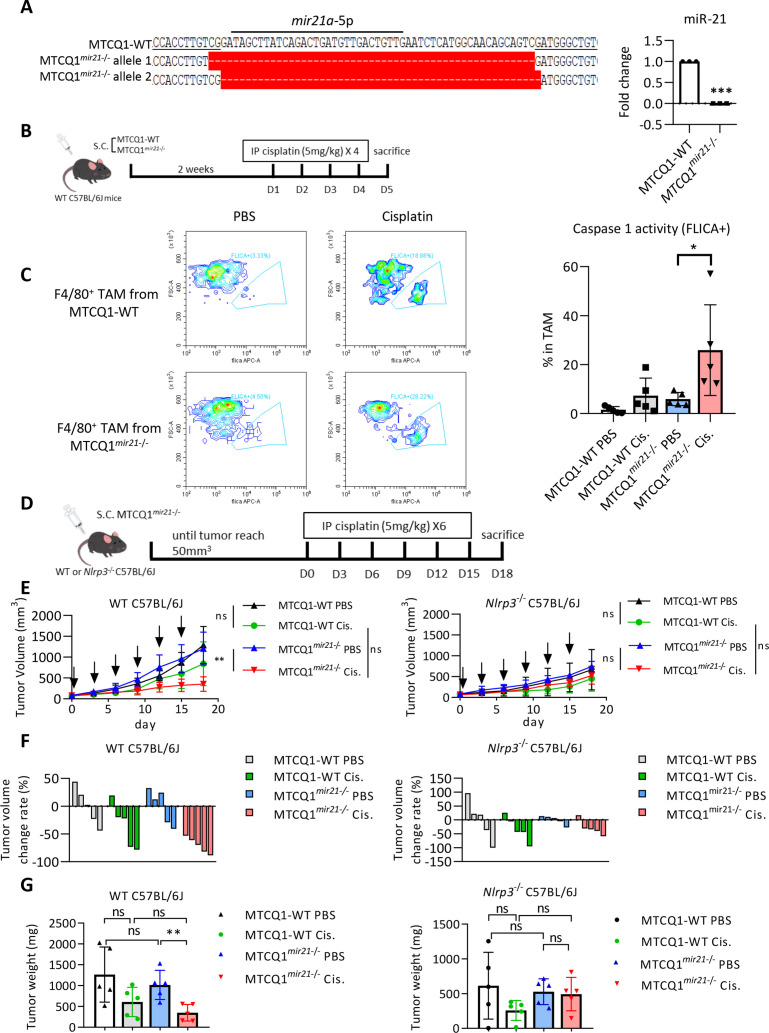
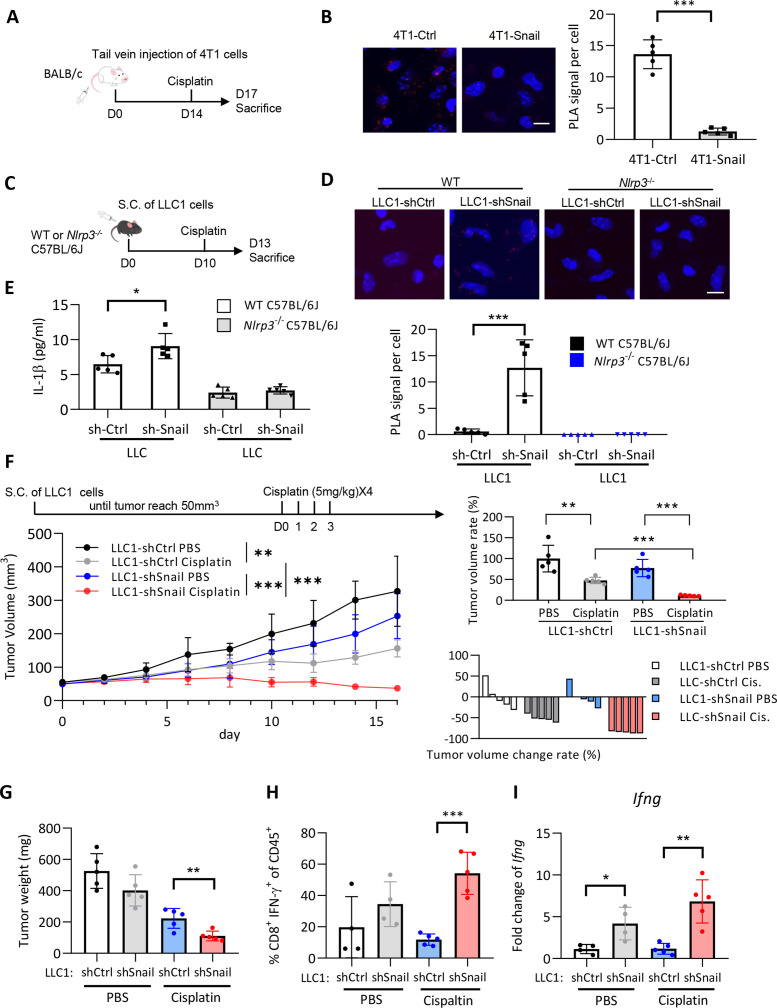
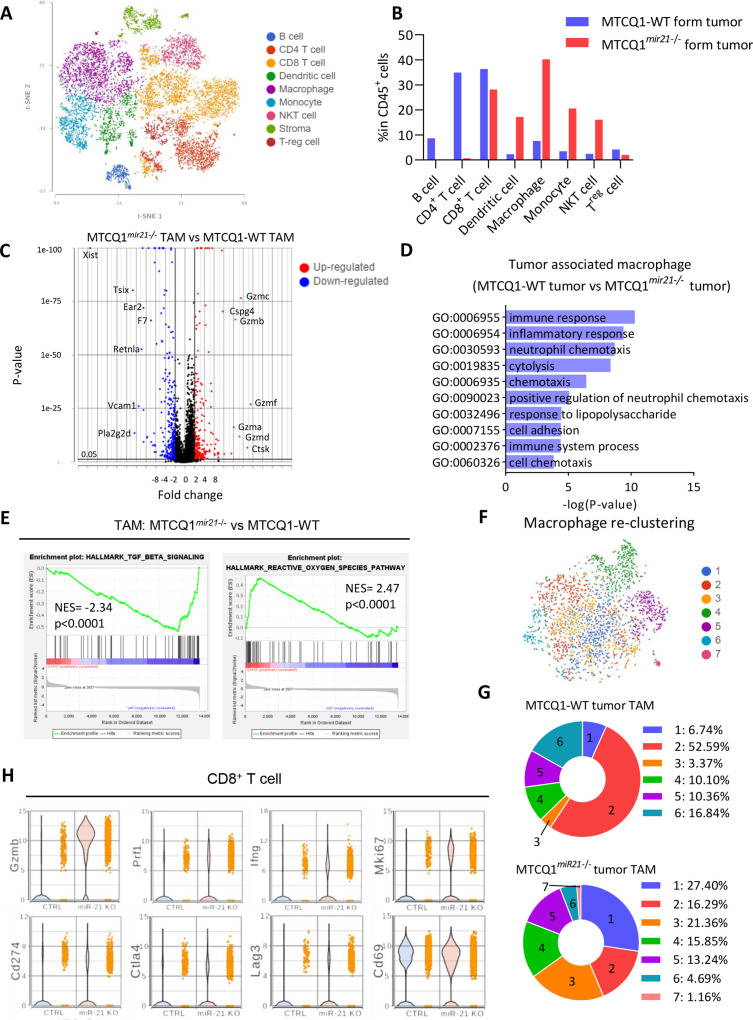
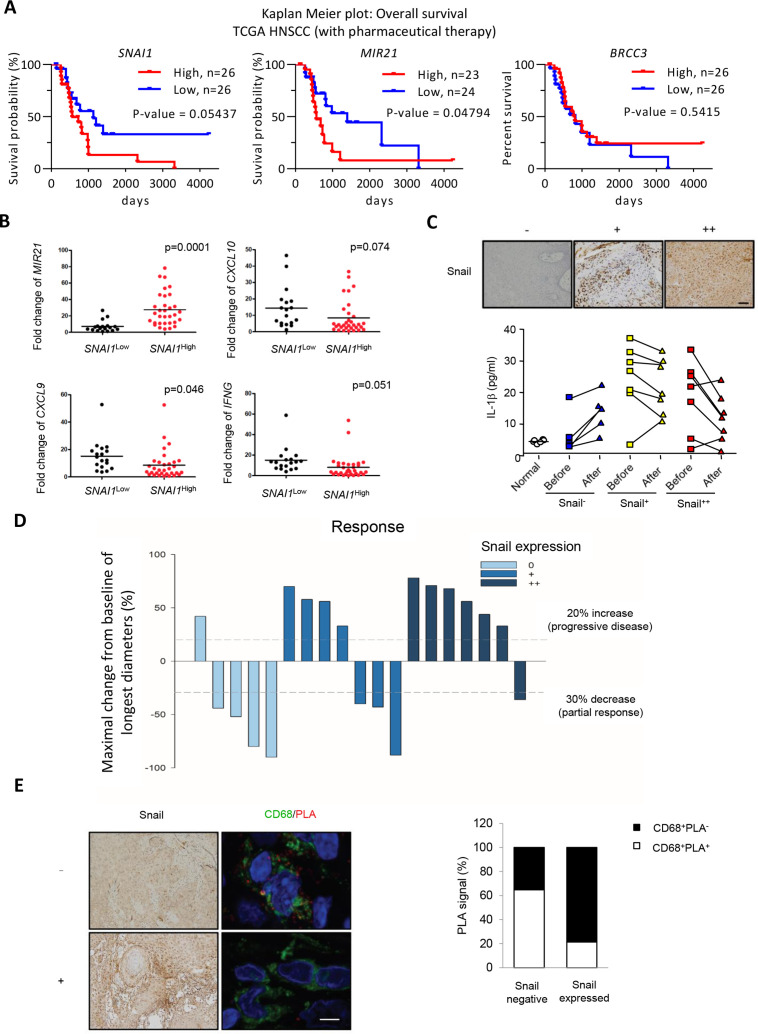
Methods: Tumor-derived exosomes were purified by differential ultracentrifugation and validated by nanoparticle tracking analysis and transmission electron microscopy. A proximity ligation assay and interleukin-1β (IL-1β) level were used for detecting activation of NLRP3 inflammasomes. RNA sequencing was used to analyze the exosomal RNAs. MIR21 knocked out human monocytic THP cells and mir21 knocked out murine oral cancer MTCQ1 cells were generated for confirming the exosomal delivery of microRNA (miR)-21. Syngeneic murine models for head and neck cancer (C57BLJ/6J), breast cancer (BALB/C) and lung cancer (C57BL/6J) were applied for examining the impact of Snail-miR21 axis on inflammasome activation in vivo. Single-cell RNA sequencing was used for analyzing the tumor-infiltrated immune cells. Head and neck patient samples were used for validating the findings in clinical samples.

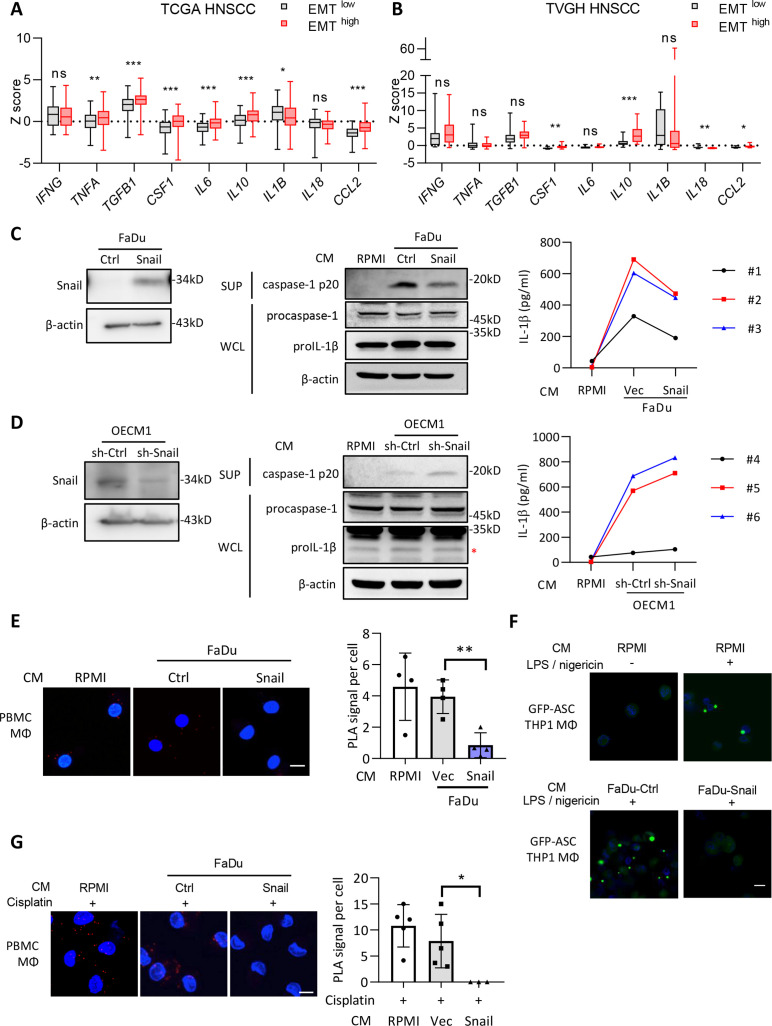
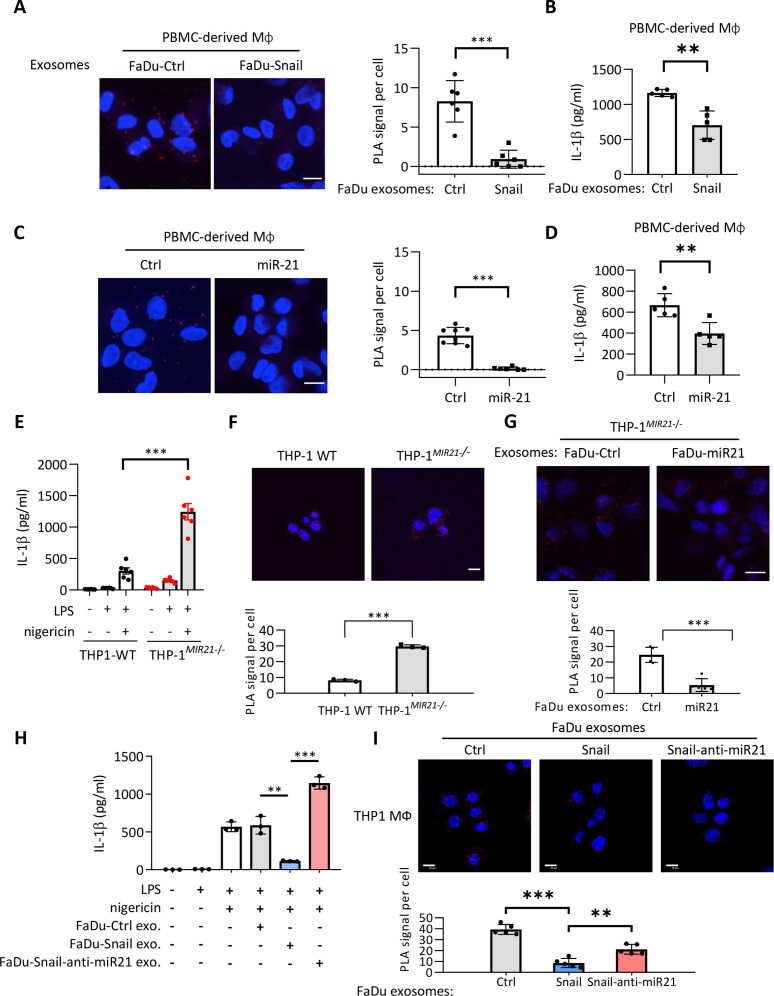
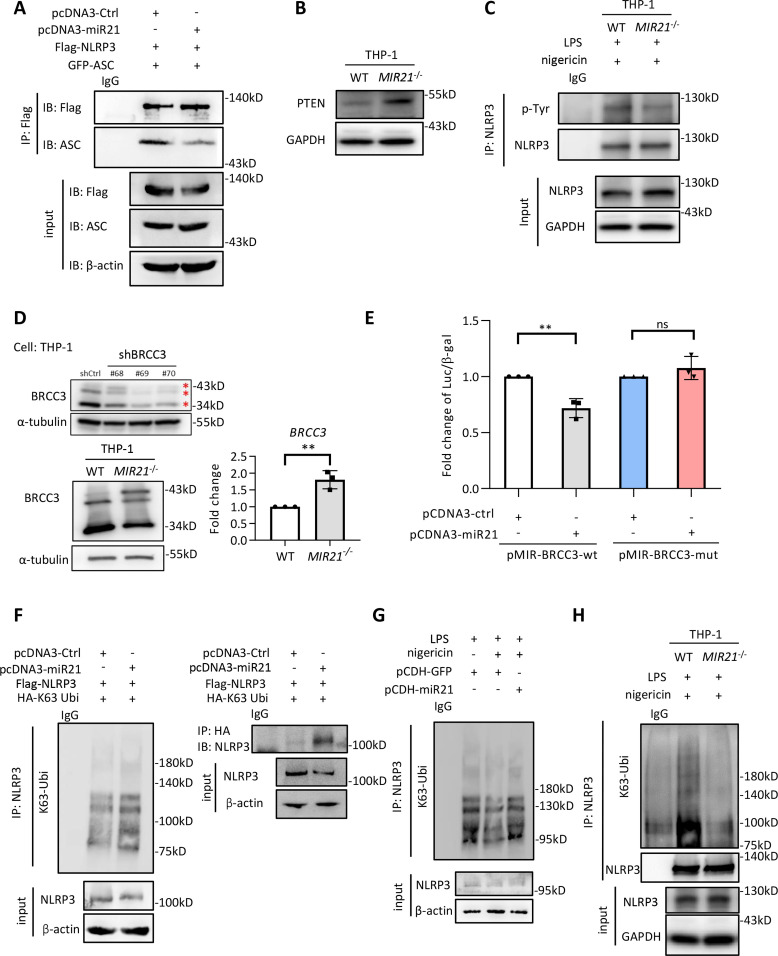
Results: We demonstrated that in cancer cells undergoing Snail-induced epithelial-mesenchymal transition (EMT), tumor cells suppress NLRP3 inflammasome activities of tumor-associated macrophages (TAMs) in response to chemotherapy through the delivery of exosomal miR-21. Mechanistically, miR-21 represses PTEN and BRCC3 to facilitate NLRP3 phosphorylation and lysine-63 ubiquitination, inhibiting NLRP3 inflammasome assembly. Furthermore, the Snail-miR-21 axis shapes the post-chemotherapy tumor microenvironment (TME) by repopulating TAMs and by activating CD8+ T cells. In patients with head and neck cancer, the Snail-high cases lacked post-chemotherapy IL-1β surge and were correlated with a worse response.

Conclusions: This finding reveals the mechanism of EMT-mediated resistance beyond cancer stemness through modulation of post-treatment inflammasome activity. It also highlights the dynamic remodeling of the TME throughout metastatic evolution.

Keywords: head and neck neoplasms; immunity, innate; macrophages; tumor microenvironment.


Conflict of interest statement

Competing interests: None declared.

Figures

Figure 1
Figure 1
The supernatants of Snail-expressing cancer cells inhibit activation of NLRP3 inflammasomes. (A–B) Analysis of the expression of the inflammation-related genes in the TCGA HNSCC database (A) or Taipei Veterans General Hospital (TVGH) database. The samples were categorized as the EMThigh and EMTlow group according to the expression of the EMT-related genes (VIM, FN1, CDH2, ITBG6, FOXC2, MMP2, MMP3, MMP9, SOX10, SNAI1, SNAI2, TWIST1, GSC, CDH1, DSP, TJP1) (see Chae et al). n=521 for TCGA, n=65 for TVGH. The boxplots show the minimum, first quartile, medium, third quartile, and maximum. *p<0.05, **p<0.01, ***p<0.001, ns=no significance by Student’s t-test. (C) Left, western blot of Snail in FaDu-Ctrl/Snail. β-actin was a loading control. Middle, immunoblots of cleaved caspase-1 p20 in supernatants (SUP), pro-caspase-1 and pro-IL-1β in whole cell lysates (WCL) of PBMC-derived macrophages cultivated in conditioned media (CM) from FaDu cells stably transfected with Snail or a control vector (Ctrl) for 48 hours. RPMI was a control for CM. β-actin was a loading control for immunoblots of WCL. Right, ELISA for analyzing the level of secreted IL-1β from PBMC-derived macrophages cultivated with the conditional media from FaDu-Snail/FaDu-Vec. Peripheral blood mononuclear cells were isolated from three different healthy donors (case #1, #2, and #3). (D) Left, western blot of Snail in OECM1-sh-Ctrl/sh-Snail. β-actin was a loading control. Middle, immunoblots of cleaved caspase-1 p20 in SUP, pro-caspase-1 and pro-IL-1β in WCL of PBMC-derived macrophages cultivated in CM from OECM1 cells receiving short hairpin RNA against Snail (sh-Snail) or a control sequence (sh-Ctrl) for 48 hours. RPMI was a control for CM. β-actin was a loading control for immunoblots of WCL. Right, ELISA for analyzing the level of secreted IL-1β from macrophages cultivated with the conditional media from FaDu-Snail/FaDu-Vec. Peripheral blood mononuclear cells were isolated from three different healthy donors (case #4, #5, and #6). (E) Left, representative images of proximity ligation assay (PLA) for detecting NLRP3 and ASC interaction in PBMC-derived macrophages cultivated in CM from FaDu-Vec or FaDu-Snail. The red dots indicate the PLA signals. Scale bar, 10 μm. Right, quantification of number of PLA signals per cell. For each group, at least a total of 18 cells from four randomly selected fields were used for PLA quantification. Data represent means±SD. **p<0.01 by Student’s t-test. (F) Representative immunofluorescent images of THP1-derived macrophages transfected with GFP-tagged ASC, stimulated with nigericin and cultivated with the CM from FaDu-Ctrl, FaDu-Snail, or RPMI for 24 hours. Scale bar, 10 µm. (G) PLA for detecting NLRP3 and ASC interaction in cisplatin-activated PBMC-derived macrophages incubated with CM from FaDu-Vec/FaDu-Snail. Left, representative images. Red dots indicate PLA signals. Scale bar, 10 µm. Right, quantification of PLA signals per cell. For each group, at least total 16 cells from five random selections (three for FaDu-Snail) were used for PLA quantification. Data represent means±SD. *p<0.05 by Student’s t-test. Scale bar, 10 µm. EMT, epithelial-mesenchymal transition; HNSCC, head and neck squamous cell carcinoma; IL, interleukin; PBMC, peripheral blood mononuclear cells; TCGA, The Cancer Genome Atlas.
Figure 2
Figure 2
Exosomes from Snail-miR-21 axis activated cancer cells suppress NLRP3 inflammasome activity of macrophages. (A) Representative images of PLA for detecting NLRP3 and ASC interaction in PBMC-derived macrophages incubated with the exosomes from FaDu-Vec/FaDu-Snail. The red dots indicate the PLA signals. Scale bar, 10 µm. Right, quantification of number of PLA signals per cell. For each group, at least a total of 50 cells from six randomly-selected fields were used for PLA quantification. Data represent means±SD. ***p<0.001 by Student’s t-test. (B) ELISA for analyzing the level of secreted IL-1β by PBMC-derived macrophages incubated with exosomes from FaDu-Vec/FaDu-Snail. n=5 independent experiments (each experiment contains two technical replicates). Data represent means±SD. **p<0.01 by Student’s t-test. (C) Left, representative images of PLA for detecting NLRP3 and ASC interaction in PBMC-derived macrophages transduced with miR-21 or a control agomir. The red dots indicate the PLA signals. Scale bar, 10 µm. Right, quantification of number of PLA signals per cell. For each group, at least a total of 60 cells from randomly-selected fields (six for miR-21 group and eight for ctrl group) were used for PLA quantification. Data represent means±SD. ***p<0.001 by Student’s t-test. (D) IL-1β ELISA of PBMC-derived macrophage. miR-21 agomir or a control sequence (Ctrl) was transduced to macrophage. n=5 independent experiments (each experiment contains two technical replicates). Data represent means±SD. **p<0.01 by Student’s t-test. (E) ELISA for analyzing the level of secreted IL-1β by macrophages derived from wild-type THP1 (THP1-WT) or MIR21-knockout THP1 (THP1MIR21–/–). The macrophages were treated with/without LPS (1 µg/mL) and nigericin (5 µM). n=6 (each contains two technical replicates) for each group. Data represent means±SD. ***p<0.001 by Student’s t-test. (F) Representative images of PLA for detecting NLRP3 and ASC interaction in THP1-WT/THP1MIR21–/–-derived activated macrophages. The red dots indicate the PLA signals. Scale bar, 10 µm. Right, quantification of number of PLA signals per cell. For each group, at least a total of 400 cells from five randomly selected fields were used for PLA quantification. Data represent means±SD. ***p<0.001 by Student’s t-test. (G) Representative images of PLA for detecting NLRP3 and ASC interaction in THP1MIR21–/–-derived macrophages incubated with exosomes from FaDu cells transfected with miR-21-expressing vector (FaDu-miR21) or a control vector (FaDu-Ctrl). The red dots indicate the PLA signals. Scale bar, 10 µm. For each group, at least a total of 400 cells from five randomly selected fields were used for PLA quantification. Data represent means±SD. ***p<0.001 by Student’s t-test. (H) ELISA for analyzing the level of secreted IL-1β by THP1-derived macrophages. The macrophages were treated with/without LPS (1 µg/mL) and nigericin (5 µM) and the exosomes from FaDu cells transfected with a control vector (FaDu-ctrl), Snail-expressing vector (FaDu-Snail), Snail and anti-miR-21 (FaDu-Snail-anti-miR-21). n=3 (each contains two technical replicates) for each group. Data represent means±SD. **p<0.01, ***p<0.001 by Student’s t-test. (I) Representative images of PLA for detecting NLRP3 and ASC interaction in THP1MIR21–/–-derived activated macrophages incubated with exosomes from FaDu cells transfected with a control vector, a miR-21-expressing vector, or Snail together with an antagomir for miR-21 (Snail-anti-miR21). The red dots indicate the PLA signals. Scale bar, 10 µm. For each group, at least a total of 400 cells from five randomly selected fields were used for PLA quantification. Data represent means±SD. **p<0.01, ***p<0.001 by Student’s t-test. IL, interleukin; miR, micro RNA; PBMC, peripheral blood monoclear cells; PLA, proximity ligation assay.
Figure 3
Figure 3
The miR-21-containing exosomes represses BRCC and PTEN to reduce NLRP3 inflammasome activity. (A) Immunoprecipitation (IP)-western blots to show the interaction of NLRP3 and ASC in HEK293T cells transfected with Flag-NLRP3, GFP-ASC and miR-21/control vector. IgG is a control for IP. (B) Immunoblots for examining the expression of PTEN in macrophages derived from THP-WT or THP1MIR21–/–. (C) IP-western blots to show the tyrosine phosphorylation of THP-WT/THP1MIR21–/–-derived macrophages primed by LPS (1 µg/mL) and activated by nigericin (5 µM). IgG is a control for IP. (D) Left upper, western blot of BRCC3 in THP1 cells receiving short hairpin RNA against BRCC3. Left lower, western blots of BRCC3 in THP-WT/THP1MIR21-derived macrophages. α-tubulin was a loading control. Right, quantitative real-time PCR for examining the relative expression of BRCC3 in THP-WT/THP1MIR21–/–-derived macrophages. n=3 (each contains two technical replicates). Data shows mean±SD. **p<0.01 by Student’s t-test. (E) BRCC3 3’-UTR reporter assay. The wild-type or miR-21 binding site mutated 3’-UTR reporter constructs of BRCC3 (pMIR-BRCC3-wt and pMIR-BRCC3-mut), pcDNA3-miR21/control vector and β-galactosidase were co-transfected to HEK293T cells. Data represent means±SD. **p<0.01 by Student’s t-test. n=3 independent experiments (each contains two technical replicates). (F) IP-western blot to show the K63-ubiquitylated NLRP3 in HEK293T cells transfected with miR-21 or a control vector. NLRP3 (left panel) or HA-tagged K63 ubiquitin (right panel) was immunoprecipitated for immunoblotting. IgG is a control for IP. (G) IP-western blot to show the K63-ubiquitylated NLRP3 in THP1-derived activated macrophages primed by LPS (1 µg/mL) and transfected with miR-21 or a control vector. Nigericin (5 µM) was used to activate inflammasome. IgG is a control for IP. (H) IP-western blot to show the K63-ubiquitylated NLRP3 in THP1-WT/THP1MIR21–/–derived activated macrophages. IgG is a control for IP. miR, micro RNA; UTR, untranslated region.
Figure 4
Figure 4
Depletion of mir-21 potentiates response to chemotherapy in oral cancer cells. (A) Left, genomic sequence of mir21a-5p of wild-type murine oral cancer cell line MTCQ1 (MTCQ-WT) and mir-21 knockout subline MTCQ1mir21–/–. Right, quantitative real-time PCR for analyzing the expression of mir-21 of MTCQ-WT and MTCQ1mir21–/–. Data represent means±SD. ***p<0.001 by Student’s t-test. n=3 independent experiments (each experiment contains two technical replicates). (B) Schema of the experiment for assaying inflammasome activities of murine tumors. 1×10⁶ of MTCQ1-WT or MTCQ1mir21–/– cells were inoculated to the subcutaneous region of the wild-type C57BL/6J mice for 2 weeks. Cisplatin 5 mg/kg was given intraperitoneally for 4 consecutive days. The mice were sacrificed on the fifth day after the start of cisplatin injection. F4/80+ tumor associated macrophages (TAMs) were harvested and caspase 1 activity (FLICA+) was analyzed by flow cytometry. (C) Left, representative data of the flow cytometry analysis for the caspase 1 activity of the TAMs (F4/80+FLICA+) after treated with cisplatin or the control PBS. n=5 for each group. Data shows mean±SD. *p<0.05 by Student’s t-test. (D) Schema of the experiment of (E) and (F). 1×10⁶ of wild-type MTCQ1 cells (MTCQ1-WT) or MTCQ1mir21−/− cells were inoculated to the subcutaneous region of the wild-type or Nlrp3−/− C57BL/6J mice. After the tumor size reached 50 mm3 (day 0), intraperitoneal injection of cisplatin (50 mg/kg) or PBS was given every 3 days for a total of six doses, and the tumor size were measured every 3 days. Mice were sacrificed at the 18th day and tumor weight were measured. (E) The volume the MTCQ1-WT/MTCQ1mir21−/−-formed tumors in wild-type or Nlrp3/− mice treated with cisplatin or PBS. n=5 for each group. Data shows mean±SD. **p<0.01, ns=no significance by Student’s t-test. (F) The waterfall plots to indicate the tumor volume change of each mouse. (G) The weight of the MTCQ1-WT/MTCQ1mir21−/−-formed tumors in wild-type or Nlrp3−/− mice treated with cisplatin or PBS. n=5 for each group. Data shows mean±SD. **p<0.01 ns=no significance by Student’s t-test. miR, micro RNA; PBS, phosphate buffered saline.
Figure 5
Figure 5
Snail limits chemotherapy-induced NLRP3 inflammasome activation in vivo. (A) Schema of the experiment. 2.5×10⁵ 4T1 cells expressing Snail or a control vector were intravenously injected into the tail veins of BALB/c mice. 4T1 tumor-bearing mice received a single injection of cisplatin (5 mg/kg) at the 14th day after tumor cell injection. The mice were sacrificed at the 17th day and the F4/80+ macrophages isolated from the lungs of the mice were subjected to PLA analysis. (B) PLA signal of NLRP3 and ASC interaction in pulmonary macrophages of 4T1-Snail/4T1-Ctrl. Left, the representative immunofluorescent images for showing the interaction of ASC-NLRP3 in F4/80+ macrophages isolated from lungs of mice. The red dots indicate the PLA signals. Right, quantification of PLA signals per cell. For each mouse, four high power fields from random selection were used for PLA quantification. Scale bar, 10 µm. n=5 for each group. ***p<0.001 by Student’s t-test. (C) Schema for animal experiment. 5×10⁵ LLC1 cells were inoculated into the subcutaneous area of the WT or Nlrp3–/– C57BL/6J mice. A single dose of cisplatin (5 mg/kg) was given at the 10th day after tumor cell injection. The mice were sacrificed at the 13th day after tumor injection. The F4/80+ TAMs were harvested for PLA for detecting the NLRP3-ASC interaction. (D) PLA signal of NLRP3 and ASC interaction. Upper, the representative immunofluorescent images for showing the NLRP3-ASC interaction in F4/80+ TAMs isolated from tumors. For each mouse, at least a total of 30 cells from eight randomly-selected fields were used for PLA quantification. Lower, quantification of PLA signals per cell. Scale bar, 10 µm. ***p<0.001 by Student’s t-test. (E) Serum IL-1β level of mice 3 days after cisplatin treatment (n=5). Data shows means±SD. *p<0.05 by Student’s t-test. (F) Left upper, schema of the experiment. LLC1 cells (2.5×10⁵) were inoculated to the subcutaneous region of C57BL/6 mice. Cisplatin (5 mg/kg) was given at 0, 1, 2, 3 day after tumor cell injection. The mice were sacrificed at the 16th day after cisplatin/PBS treatment. Left lower, tumor volume curve. Right upper, tumor volume change presented in %. Right lower: a waterfall plot to show the volume change of each tumor. n=5 for each group. Tumor volume is shown in mean±SD, and tumor volume reduction rate shows mean±SD. **p<0.01, ***p<0.001 by Student’s t-test. (G) The tumor weight of LLC1-formed tumors in (F). Data shows mean±SD. **p<0.01 by Student’s t-test. (H) Quantification of the percentages of CD8+IFNγ+ tumor-infiltrating lymphocytes among CD45+ tumor-infiltrating leukocytes in different groups of mice as panel (F). The harvested tumors were dissociated and the tumor-infiltrating leukocytes were analyzed by flow cytometry. For PBS groups, n=4; for cisplatin groups, n=5. ***p<0.001 by Student’s t-test. (I) Quantitative real-time PCR for analyzing the expression level of Ifng in different groups of LLC1-formed tumors as panel (F) and (G). For PBS groups, n=4; for cisplatin groups, n=5. *p<0.05, **p<0.01 by Student’s t-test. IFN, interferon; IL, interleukin; PBS, phosphate buffered saline; PLA, proximity ligation assay; TAM, tumor-associated macrophages.
Figure 6
Figure 6
Tumorous mir-21 shapes the infiltrated immune cells of syngeneic murine oral cancers. (A) The t-distributed stochastic neighbor embedding and immune cell type clustering (see Liu et al) of CD45+ cells in MTCQ1-WT and MTCQ1mir21–/–-formed tumors 3 days after cisplatin (5 mg/kg) injection. (B) Different immune cell type distribution between MTCQ1-WT and MTCQ1mir21–/–-formed tumor. (C) Volcano plots of the differential expressed genes of the TAMs from MTCQmir21–/– versus MTCQ1-WT-formed tumors. Red, upregulated genes; blue, downregulated genes. (D) GO enrichment analysis of the biological pathways of the TAMs from MTCQ1 mir21–/– versus MTCQ1-WT-formed tumors. (E) GSEA of the TGF-β signaling gene set (M5896) and reactive oxygen species pathway gene set (M5938) in MTCQ1mir21–/– TAMs versus MTCQ1-WT TAMs. (F) Re-clustering of the TAMs from MTCQ1-WT and MTCQ1mir21–/– -formed tumors. (G) Distribution of the TAM clusters of MTCQ1-WT or MTCQ1mir21–/– TAM. (H) Violin plots for showing the expression of the T cell activation genes (Gzmb, Pfr1, Ifng, Mki67) and immune checkpoint genes (Cd274, Ctla4, Lag3, Cd69) expression in CD8+ T cells of the MTCQ1-WT and MTCQ1mir21–/– tumors. GSEA, Gene Set Enrichment Analysis; GO, Gene Ontology; miR, micro RNA; TAM, tumor-associated macrophages; TGF-ß: transforming growth factor ß.
Figure 7
Figure 7
Snail limits chemotherapy-induced NLRP3 inflammasome activation in patients with HNSCC. (A) Kaplan-Meier plots for analyzing the influence of differential expression of SNAI1, MIR21, and BRCC3 on overall survival of patients with HNSCC with pharmaceutical therapy from TCGA database. The log-rank p value is shown in each panel. (B) Quantitative real-time PCR for analyzing the expression level of MIR21, CXCL10, IFNG and SNAI1 in HNSCC samples. n=50. The SNAI1High (n=32) is defined as the level higher than mean value, and the SNAI1Low (n=18) is defined as the level lower than mean value. (C) Upper, IHC staining of Snail with differential expressions in representative HNSCC samples. Scale bar, 50 µm. Lower, serum IL-1β level in patient with HNSCC before and 1 day after chemotherapy. (D) A waterfall plot for illustrating the response to chemotherapy of patients with HNSCC in (C). (E) Left, IHC staining of Snail (left) and immunofluorescent staining (right) of CD68 (green)/NLRP3-ASC PLA (red) in representative HNSCC samples. Right, quantification of the results. Three Snail-negative and two Snail-positive HNSCC samples were used in the experiment. For each sample, at least five CD68+ TAMs were quantified for PLA signals. The result is shown as the percentage of PLA-positive among CD68+ TAMs. Scale bar, 5 µm. HNSCC, head and neck squamous cell carcinoma; IHC, immunohistochemistry; PLA, proximity ligation assay; TAM, tumor-associated macrophages; TCGA, The Cancer Genome Atlas.

References

    1. Marine J-C, Dawson S-J, Dawson MA. Non-Genetic mechanisms of therapeutic resistance in cancer. Nat Rev Cancer 2020;20:743–56. 10.1038/s41568-020-00302-4 - DOI - PubMed
    1. Ye X, Weinberg RA. Epithelial-Mesenchymal plasticity: a central regulator of cancer progression. Trends Cell Biol 2015;25:675–86. 10.1016/j.tcb.2015.07.012 - DOI - PMC - PubMed
    1. Shibue T, Weinberg RA. Emt, CSCs, and drug resistance: the mechanistic link and clinical implications. Nat Rev Clin Oncol 2017;14:611–29. 10.1038/nrclinonc.2017.44 - DOI - PMC - PubMed
    1. Hsu DS-S, Wang H-J, Tai S-K, et al. . Acetylation of snail modulates the cytokinome of cancer cells to enhance the recruitment of macrophages. Cancer Cell 2014;26:534–48. 10.1016/j.ccell.2014.09.002 - DOI - PubMed
    1. Lee C-C, Lin J-C, Hwang W-L, et al. . Macrophage-Secreted interleukin-35 regulates cancer cell plasticity to facilitate metastatic colonization. Nat Commun 2018;9:3763. 10.1038/s41467-018-06268-0 - DOI - PMC - PubMed

Publication types