. 2022 Aug 24;13(1):4967.
doi: 10.1038/s41467-022-32555-y.

A neural correlate of perceptual segmentation in macaque middle temporal cortical area

Affiliations

A neural correlate of perceptual segmentation in macaque middle temporal cortical area

Andrew M Clark et al. Nat Commun. .

Abstract

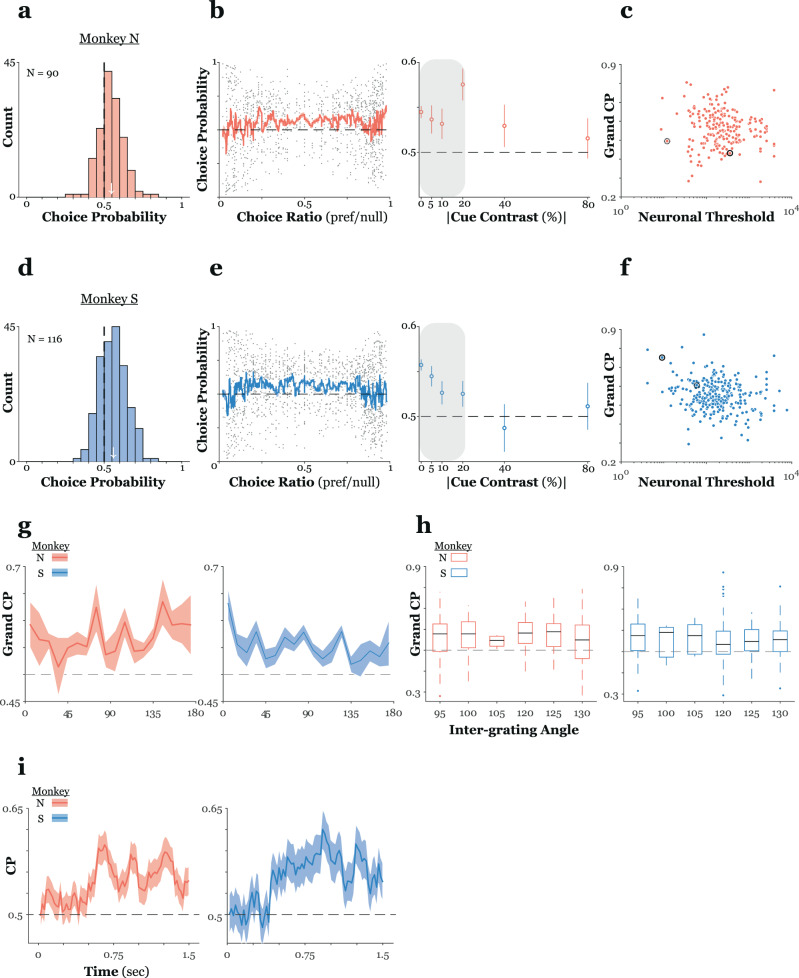
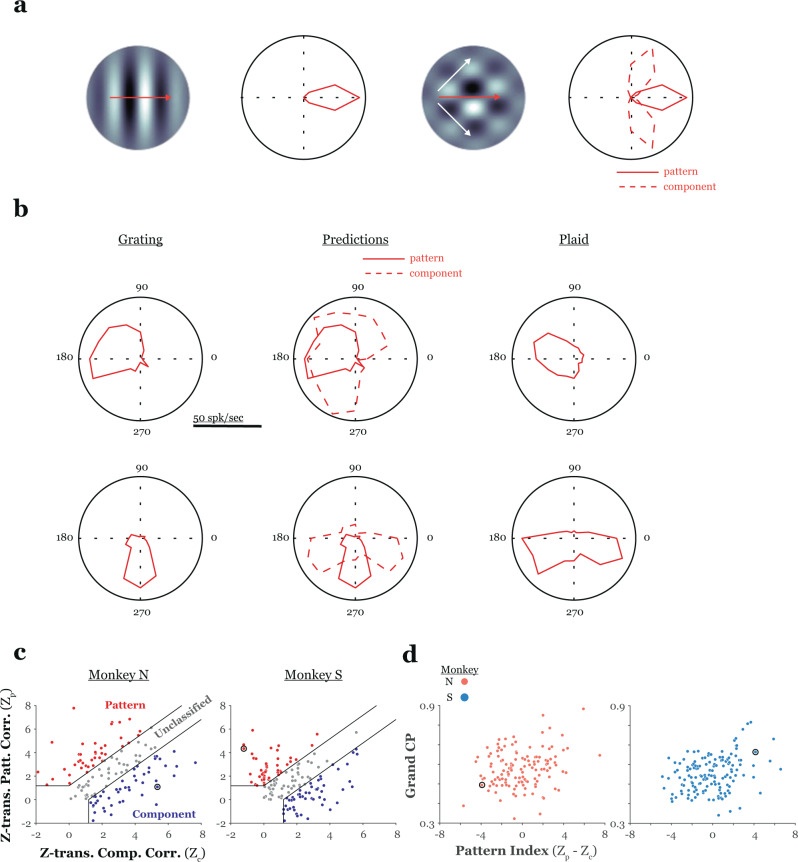
High-resolution vision requires fine retinal sampling followed by integration to recover object properties. Importantly, accuracy is lost if local samples from different objects are intermixed. Thus, segmentation, grouping of image regions for separate processing, is crucial for perception. Previous work has used bi-stable plaid patterns, which can be perceived as either a single or multiple moving surfaces, to study this process. Here, we report a relationship between activity in a mid-level site in the primate visual pathways and segmentation judgments. Specifically, we find that direction selective middle temporal neurons are sensitive to texturing cues used to bias the perception of bi-stable plaids and exhibit a significant trial-by-trial correlation with subjective perception of a constant stimulus. This correlation is greater in units that signal global motion in patterns with multiple local orientations. Thus, we conclude the middle temporal area contains a signal for segmenting complex scenes into constituent objects and surfaces.


Conflict of interest statement

The authors declare no competing interests.

Figures

Fig. 1
Fig. 1. The hard problem of segmentation in visual perception.
a Cartoon illustration of the problem of perceptual segmentation. An observer’s perception of depth in the Necker cube (left) alternates between two plausible interpretations (right). This is because there are no cues in the image that allow the brain to determine unambiguously the three-dimensional orientation of the figure (provided by the monocular cue of occlusion on the right). b When presented with multiple motion signals in close spatial proximity the visual system must determine whether local samples arise from one or multiple objects. The ambiguity inherent in local motion signals, that is, a family of object motions can yield the same local motion, results in multiple equally plausible interpretations of the visual input, i.e., the vector fields here could arise from the coherent motion of a single surface or the transparent motion of overlapping surfaces. c (left) Example of our textured plaid stimuli. Square wave gratings drifting normal to their orientation (“component directions” - white arrows) were superimposed to form plaid patterns. Plaids could be perceived as either coherent motion in a single, pattern, direction (red arrow) or transparent motion in the component directions. Plaid perception was biased through the addition of a random dot texturing cue. (middle) The region highlighted in yellow is expanded and shown for a sequence of frames separately for coherent and transparent cues. Dot motion in each case is represented by the green and red arrows. (right) The (x,y) positions of the highlighted dots are plotted versus frame number. In the coherent case, all texture drifted in a single direction. In the transparent case, texture moved in the component directions. d Cartoon illustration of our motion segmentation task. Monkeys began each trial by fixating on a small point. After a brief delay, a plaid pattern with a particular type (coherent/transparent) and magnitude (e.g., contrast) of texture cue appeared at the location of the MT RF. Plaids could drift in one of two possible pattern directions on each trial. After stimulus offset, choice targets appeared well above and below the MT RF. Monkeys needed to indicate their plaid perception via a saccade to the appropriate choice target.
Fig. 2
Fig. 2. Performance in a motion segmentation task.
a Examples of monkeys’ behavior in a representative session (n ≥ 20 trials per stimulus condition). In the left (right) panel, data from a single session from monkey N (S) is plotted as the fraction of coherent choices (ordinate) versus the signed contrast of the texture cue (abscissa). Here, transparent (coherent) texture assumed negative (positive) values. Responses are plotted separately according to the direction of pattern motion on a trial (up (90°) or down (270°)). For both animals, performance, either the contrast for which answers split 50/50 (PSE – filled arrows) or the amount of texture contrast required to support a specific level of performance (threshold – open arrows), was similar across drift directions in these sessions. b Histograms of the R2 values for fitted cumulative Gaussian functions. Data from monkey S (N) are shown at the left (right). c (top) PSE measured for plaids drifting down (ordinate) is plotted versus PSE for plaids drifting up (abscissa), marginals represent the PSE distribution for each condition, arrows mark the mean for each condition. Data for all sessions from monkey N (S) is given in the left (right) column. (bottom) Same conventions as for PSE data, but for the threshold of fitted functions. There was no significant difference in either PSE or threshold across pattern directions (see text). d PSE and slope (ordinates) are plotted versus the normalized angle separating component grating directions (“inter-grating angle” - abscissa). Open circles are means; solid line is the best-fit regression model, dashed lines are 95% confidence intervals for the regression models. There was a significant correlation between PSE and normalized inter-grating angle but not between slope and normalized inter-grating angle, suggesting a shifting, but not steepening or flattening, of the psychometric function with changes in the angle separating component gratings. (monkey N, n = 32 sessions; monkey S, n = 43 sessions). In all panels, error bars represent standard error of the mean.; coh. coherent, PSE point of subjective equality, Norm. normalized.
Fig. 3
Fig. 3. Representative MT single-unit responses to textured plaid stimuli.
a Polar plot of the direction tuning profile in response to a single sine grating for a representative MT unit from monkey S. The angle represents direction of grating motion and magnitude represents firing rate, this unit’s preferred direction roughly overlapped one of the component directions in plaids with a pattern direction of 90° (up). b Peri-stimulus time histograms (PSTHs) in response to plaids drifting in a pattern direction of 90° (shown schematically on the left) for the unit shown in a. Responses are sorted according to the type (coherent/transparent – middle/right panels, respectively) and Michelson contrast (color cued across PSTHs) of the texture cue. Only responses on correct trials for a low and a high contrast texture cue of each type are shown. This cell responded better to upward drifting plaids with transparent texture cues, with responses to these patterns increasing with increasing texture contrast. c, d Conventions as in a and b but for a different MT unit from monkey S with a preferred direction that nearly overlay the pattern direction for downward drifting plaids. This unit preferred downward drifting plaids with coherent texture cues, with responses to these patterns increasing with increasing texture contrast. In all panels, shaded regions represent the standard error of the mean. spks. spikes, sec. seconds.
Fig. 4
Fig. 4. Quantifying MT responses to textured plaids.
a Firing rate is plotted against signed texture contrast separately for plaids drifting either up (left) or down (right), solid lines are best fit linear regressions, data in the top (bottom) rows are from the unit shown in Fig. 3a, b (Fig. 3c, d). The sign of the regression slope was used to assign a preferred texture cue (coherent/transparent) for each unit/plaid direction combination (n ≥ 20 trials for each stimulus condition). Error bars represent standard error of the mean. b Neurometric functions for the units shown in a are depicted alongside psychometric functions collected during the same session. For each function, we now plot the percentage of preferred cue choices (ordinate) (see text) against signed texture contrast (abscissa). Texture contrast was reordered so that preferred cues assume positive values and null cues assume negative values. Data from upward (downward) drifting plaids is shown in the left (right) panels; data in the top (bottom) row are from the unit shown in Fig. 3a, b (Fig. 3c, d). The ratio of neurometric to psychometric threshold (N/P) is given in each panel. spks. spikes, sec. seconds, dir. direction, pref. preferred, psy. psychometric, neuro. neurometric.
Fig. 5
Fig. 5. Neuronal sensitivity to plaid segmentation cues.
a The left panels show the distribution of the N/P ratio (neuronal/psychophysical threshold); each cell contributes two data points, one for each direction of pattern motion. In the right panels, psychophysical threshold (ordinate) is plotted versus neuronal threshold (abscissa) for all units in the sample. Data in the top (bottom) row is from monkey N (S). b The normalized threshold ratio is plotted against the magnitude of the difference between the best plaid direction and a unit’s preferred direction. The “best” direction was defined as the plaid pattern direction that was closest to a unit’s preferred direction (measured with single sine gratings). Data was first binned by normalized preferred direction (10° bins), threshold ratios were then normalized to the maximum and averaged within each bin. Units with preferred directions that were slightly greater or less than plaid component directions showed the greatest difference in sensitivity across plaid pattern directions. c Rose histograms of the distribution of preferred directions for all MT units recorded from each monkey.
Fig. 6
Fig. 6. MT activity co-varies with perceptual segmentation judgments on a trial-by-trial basis.
a Distribution of choice probabilities for plaids with no texture cue for the sample recorded from monkey N. Each cell could contribute up to two data points (one for each direction of plaid motion). A mean CP greater than chance (white arrow) indicates that, overall, there was a significant relationship between MT activity and perception. b To examine the influence of any potential choice biases we calculated CP separately for any stimulus for which the monkey made at least a single error. Choice probability is plotted against choice ratio (pref/null) for all stimuli (left) and versus the absolute value of the contrast of the texture cue (right – data from 120 single units). Solid line and the shaded region in the left panel is the mean ± s.e.m. for a 20-point moving average. Choice probabilities calculated for stimuli with unbalanced choice ratios, e.g., those plaids with high cue contrast, were more variable and clustered around chance. Gray shaded region in the right panel highlights the cue contrasts included in the grand choice probability calculation. c Grand choice probability (ordinate) is plotted versus neuronal threshold (abscissa). There was a significant negative correlation between choice probability and threshold. d–f Convention as in a–c but, unless otherwise noted, are for data from 157 single units from monkey S. g Grand choice probability (ordinate) is plotted against normalized preferred direction (abscissa) separately for both monkeys. Each MT unit contributed two data points (one for each plaid pattern direction). h Box plots of grand choice probability for each inter-grating angle. Solid lines mark the median, the bottom and top edges of the box indicate the 25th and 75th percentiles respectively, whiskers extend to 1.5x the inter-quartile range, outliers are marked beyond this limit. Data in the left (right) panel is from 120 (157) single units from monkey N (S). i Grand choice probability (ordinate) is plotted against time from stimulus onset (abscissa). Grand CP was calculated in a sliding bin (100 ms width, 10 ms steps) throughout a trial and then averaged across units.
Fig. 7
Fig. 7. Relationship between MT pattern-motion sensitivity and choice-related activity in the plaid segmentation task.
a Schematic illustration of pattern-component tuning stimuli and hypothetical grating (left) and plaid direction tuning curves (right) (see Materials and Methods). Briefly, if a cell integrates across plaid components to signal pattern motion, then one would expect tuning curves to be identical for single grating and plaid stimuli (last column, solid curve). Conversely, if a cell did not integrate component directions to signal pattern motion, one would expect a bi-lobed tuning curve, with a peak for each direction of plaid motion that translates a single component in the unit’s preferred direction (final column, dashed curve). b (left) Sine grating direction tuning curves for the unit shown in Figs. 3 and 4 (top row – unit from Figs. 3a, b and 4a, b (top); bottom panel – unit from Figs. 3c, d and 4a, b (bottom)). (middle) Pattern and component predictions calculated from the grating tuning profiles. (right) Plaid tuning for these units. The unit in the top (bottom) panel was classified as a pattern (component) cell. Note that there is not a one-to-one correspondence between pattern-component classification and a cell’s coherent/transparent motion preference (cf. textured plaid responses for these units in Fig. 4a). c The z-scored pattern partial correlation coefficient (ordinate) is plotted versus the z-scored component partial correlation coefficient (abscissa) for all cells recorded from monkey N (left) and S (right). Thick lines represent significance criteria used to classify cells. d Grand choice probability (ordinate) is plotted versus pattern index (Zp – Zc) (abscissa). Data in the left (right) panel are from monkey N (S). Black circles highlight data from the example units. In both animals, there was a significant correlation between grand choice probability and pattern index, indicating a greater perceptual correlation for cells that signal pattern direction in stimuli with multiple component directions.
Fig. 8
Fig. 8. Possible circuitry underlying the relationship between pattern selectivity and choice probability.
a A two-stage model of component- and pattern-direction selectivity and the potential influence of top-down feedback on choice-related activity in MT. Here, pattern direction selectivity (PDS - “P”) at the MT stage arises through: (i) broad sampling over direction selective inputs consistent with a particular pattern velocity, and (ii) strong tuned suppression. MT stage component direction selective (CDS) cells (“C”) sample narrowly over input directions and lack strong tuned suppression.Untuned suppression confers gain control in both populations. Colored arrows represent units’ preferred direction. Only a subset of V1-MT connections and a single pattern- and component-direction selective unit are illustrated for clarity. In the case of a feedforward (FF) interpretation of our results, the broader input tuning and strong tuned suppression in PDS cells (highlighted in red) generates a larger difference in activity in response to patterns with multiple motions. This population drives upstream decision circuits and biases perception in our segmentation task. Conversely, in the feedback (FB) case, perceptual decisions are generated in upstream circuits by both sensory evidence and cognitive biases and a greater influence of top-down FB on PDS cells (thicker line) generates the choice signal. b Illustration of an alternative model of CDS and PDS units. Here, PDS signals in MT arise via not only direct V1 input but also via indirect inputs from a V1-V2-MT pathway. The model indirect pathway is configured to confer selectivity for texture boundaries (plaid overlap regions). MT stage CDS cells perform a weighted sum on direct and indirect inputs and send outputs to PDS units. PDS tuning arises via competitive inhibition. Again, only those connections necessary to sketch the basic model architecture are shown. Here, distinct FF mechanisms from those posited in a could be responsible for driving greater variability in PDS cell plaid responses, which would, again, drive biases in decision circuits. Alternatively, greater CP in PDS cells could still be the result of a bias in the strength or efficacy of FB connections to PDS cells. There is evidence supporting both two- and three-stage models of MT PDS and FF and FB explanations for CP.

Similar articles

References

    1. Wertheimer M. Untersuchungen zur Lehre von der Gestalt II. Psychologische Forsch. 1923;4:301–350. doi: 10.1007/BF00410640. - DOI
    1. Roelfsema PR. Cortical algorithms for perceptual grouping. Annu. Rev. Neurosci. 2006;29:203–227. doi: 10.1146/annurev.neuro.29.051605.112939. - DOI - PubMed
    1. Self MW, et al. The segmentation of proto-objects in monkey primary visual cortex. Curr. Biol. 2019;29:1019–1029. doi: 10.1016/j.cub.2019.02.016. - DOI - PubMed
    1. von Der Heydt R. Figure-ground organization and the emergence of proto-objects in the visual cortex. Front. Psychol. 2015;6:1695. - PMC - PubMed
    1. Wallach H. Ueber visuell whargenommene bewegungrichtung. Psychologische Forsch. 1935;20:325–380. doi: 10.1007/BF02409790. - DOI

Publication types