. 2022 Sep;609(7928):747-753.
doi: 10.1038/s41586-022-05110-4. Epub 2022 Aug 24.

Divergent genomic trajectories predate the origin of animals and fungi

Affiliations

Divergent genomic trajectories predate the origin of animals and fungi

Eduard Ocaña-Pallarès et al. Nature. 2022 Sep.

Abstract

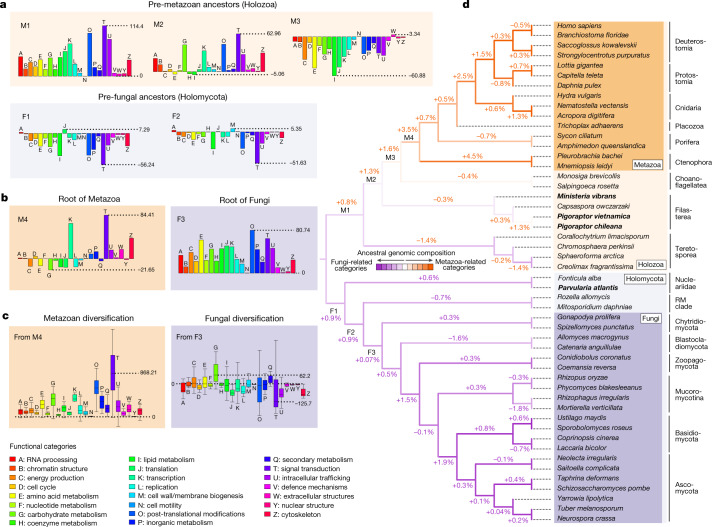
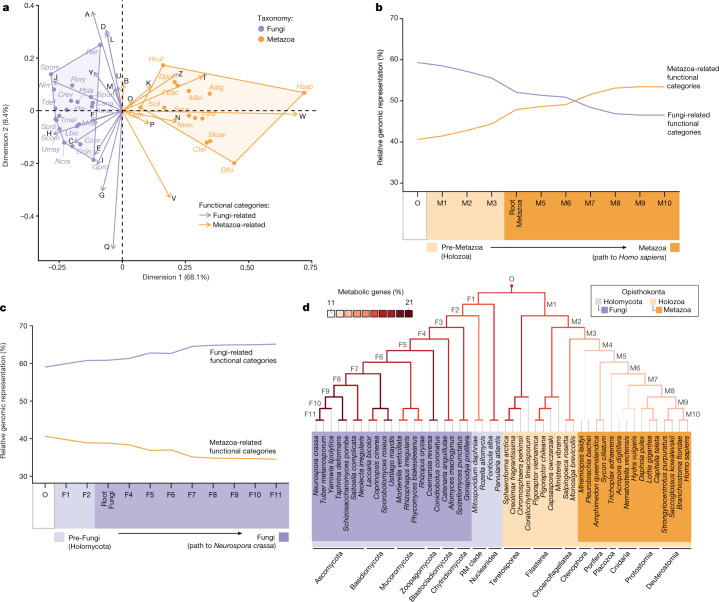
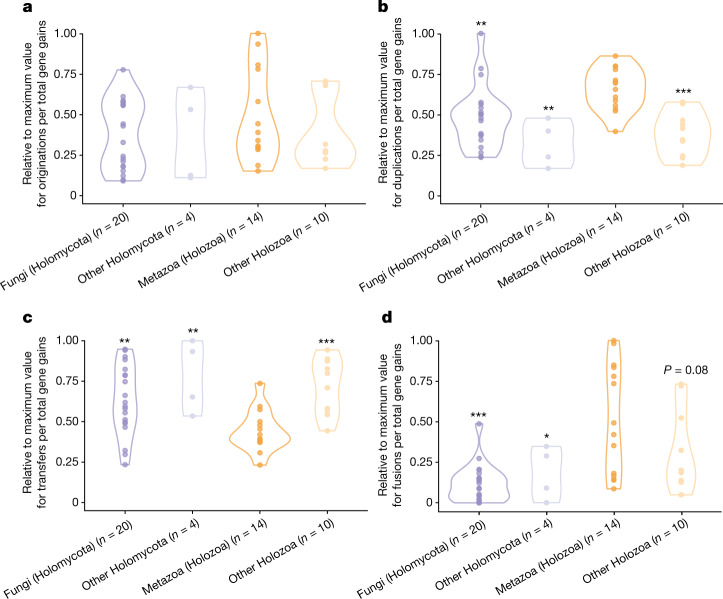
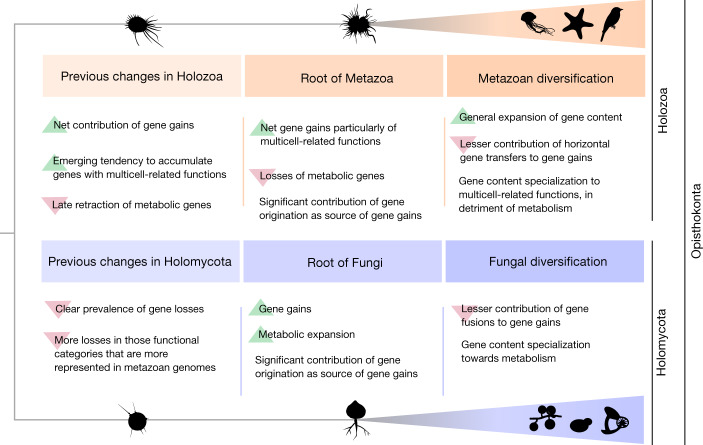
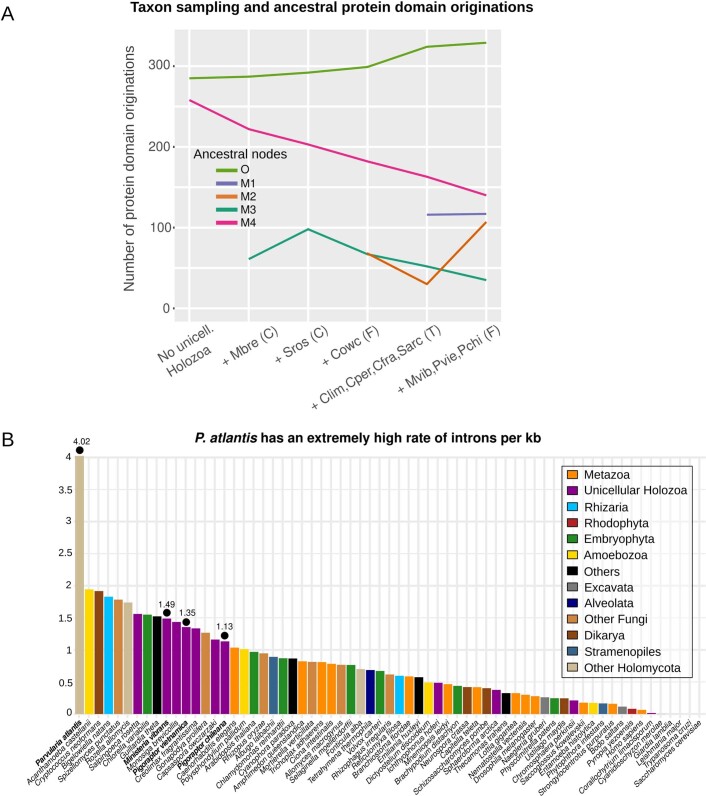
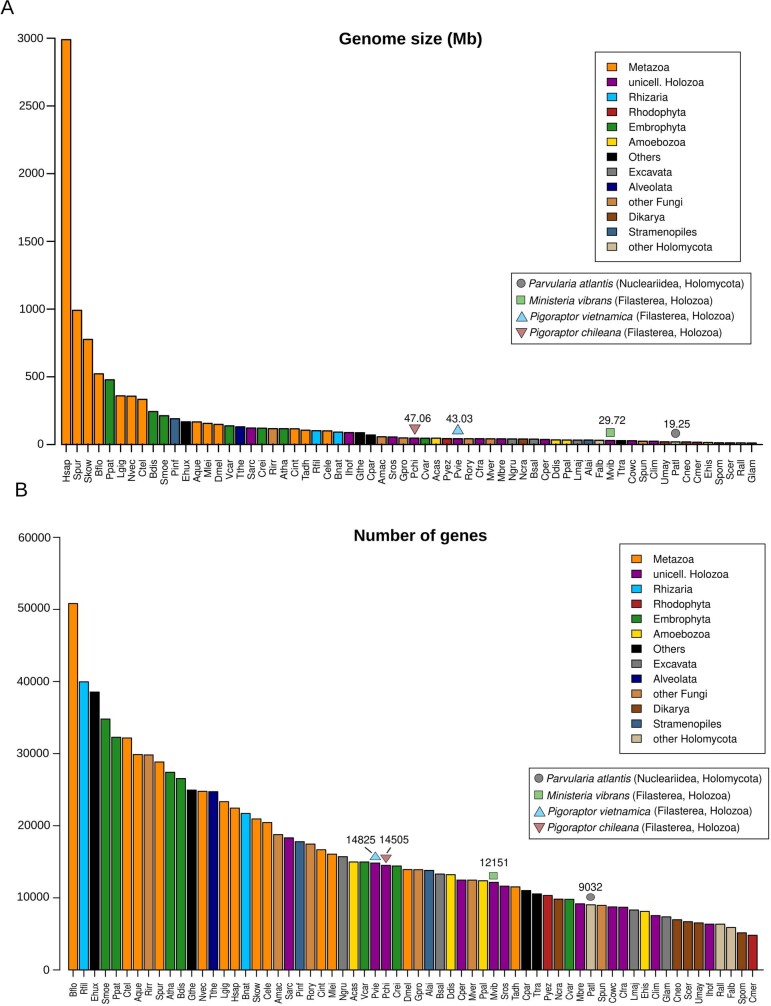
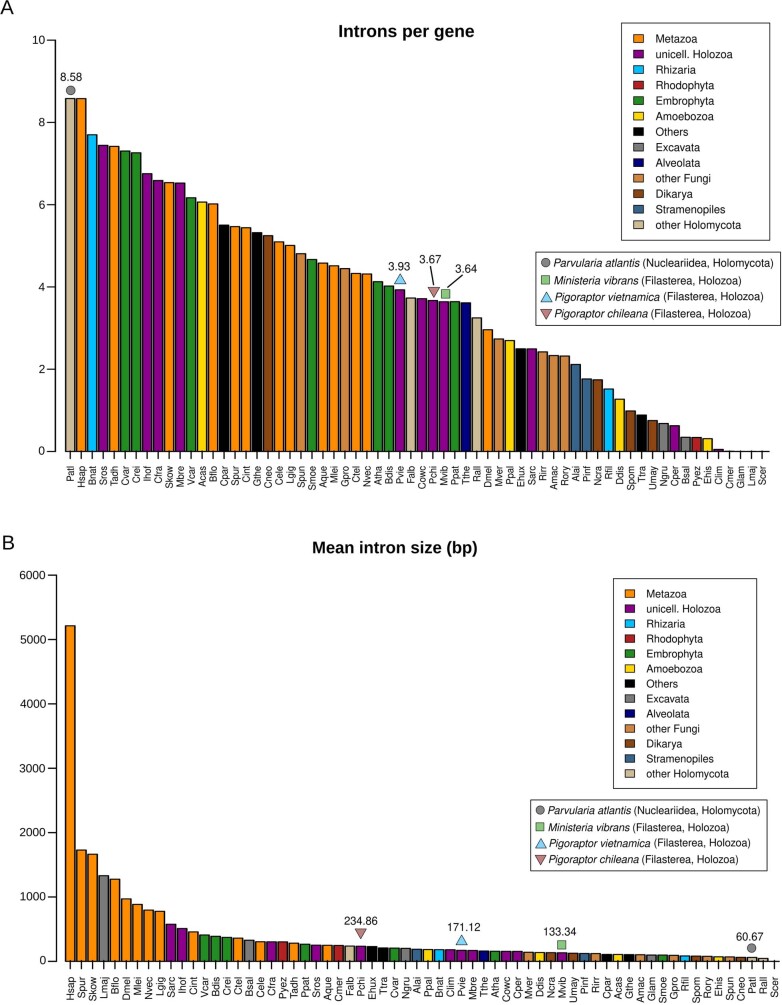
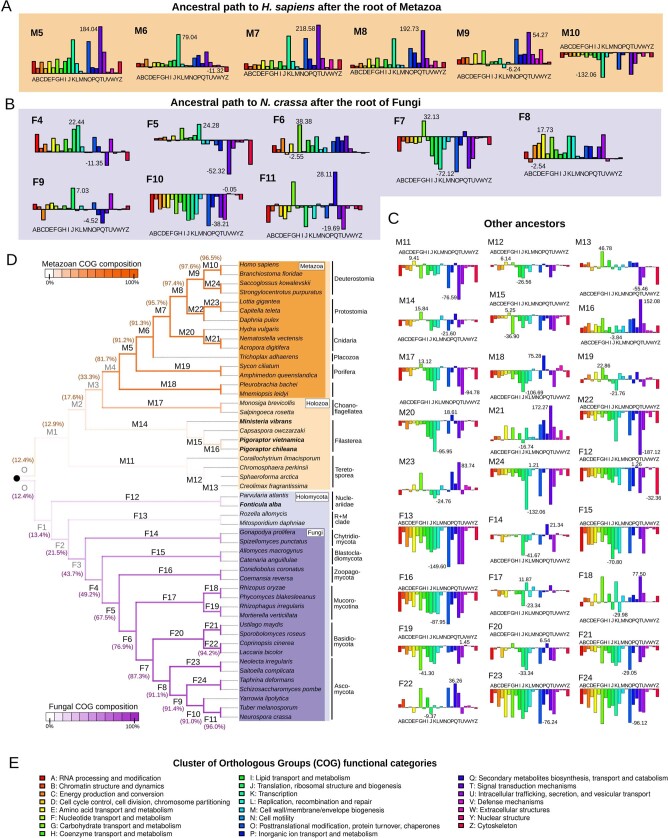
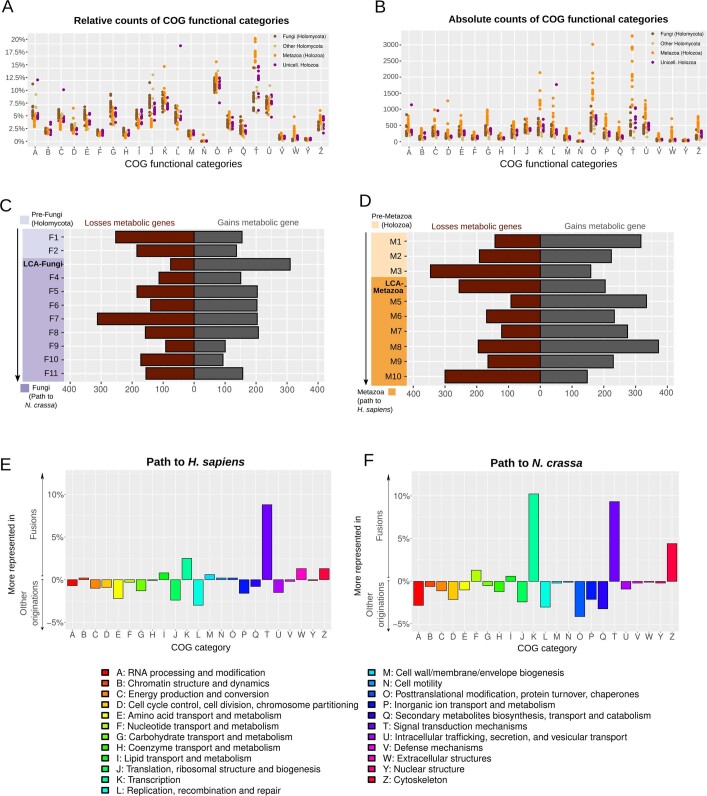
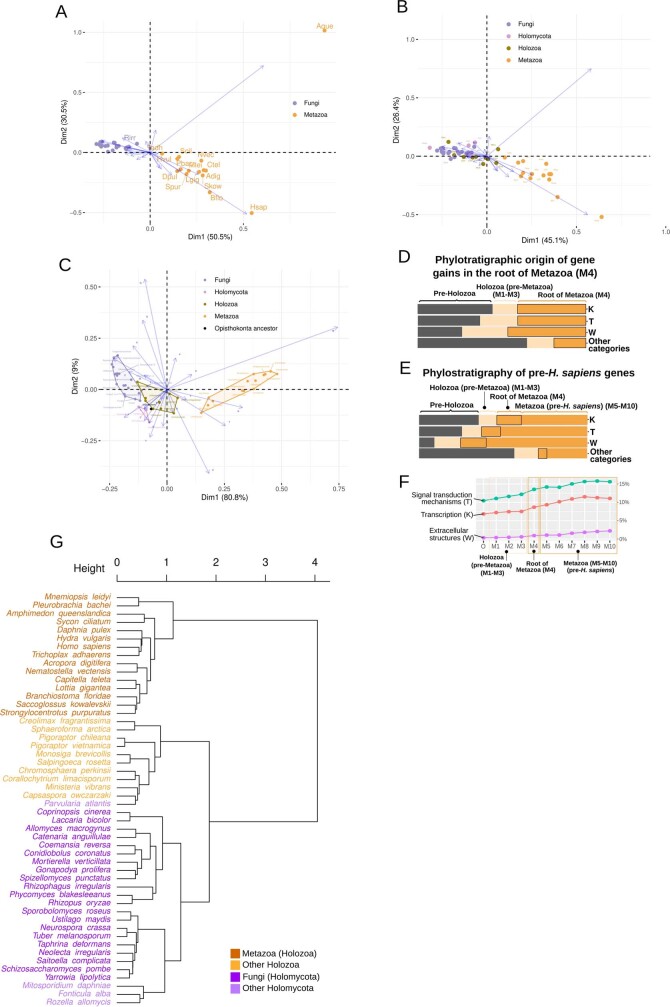
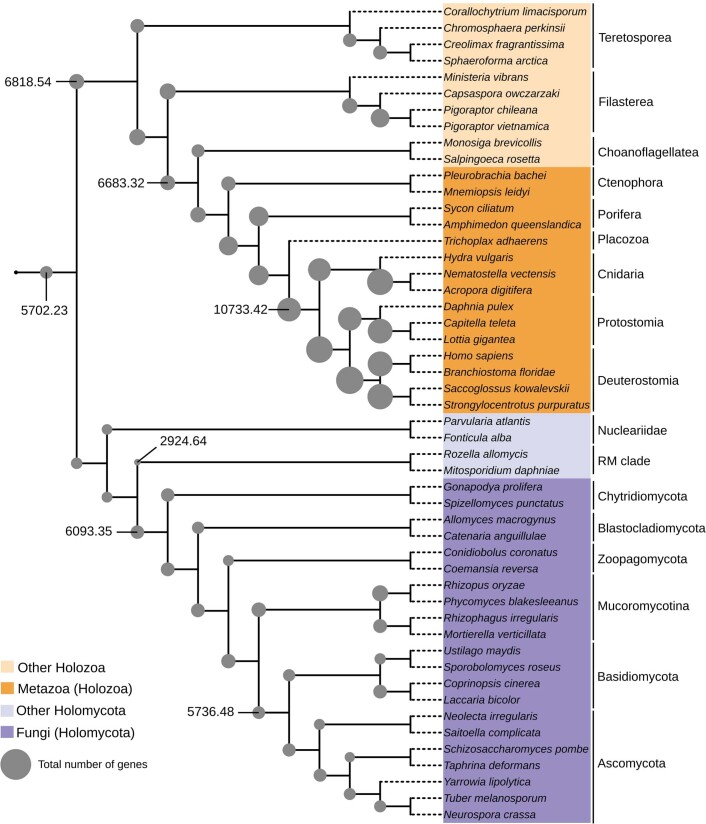
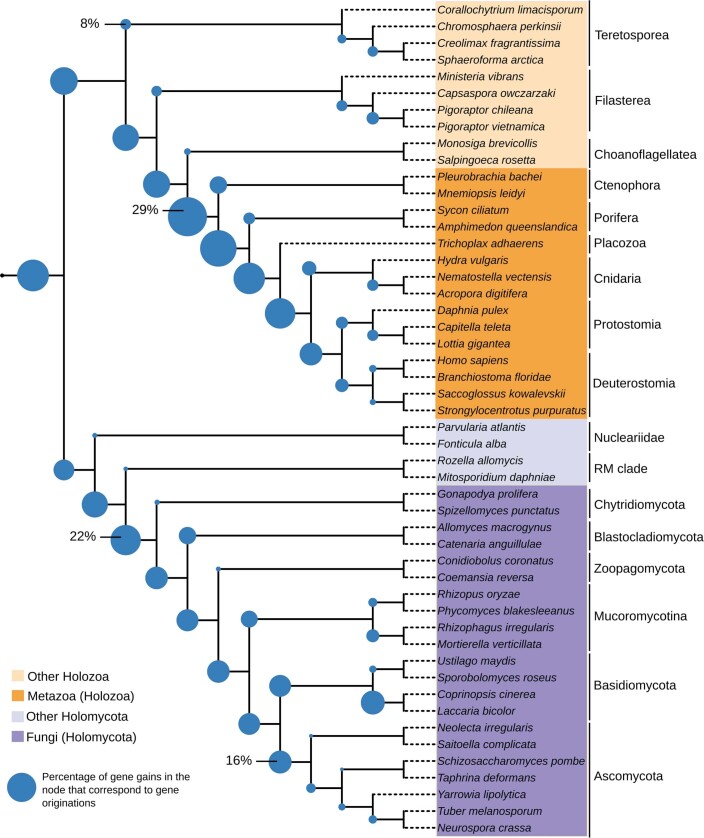
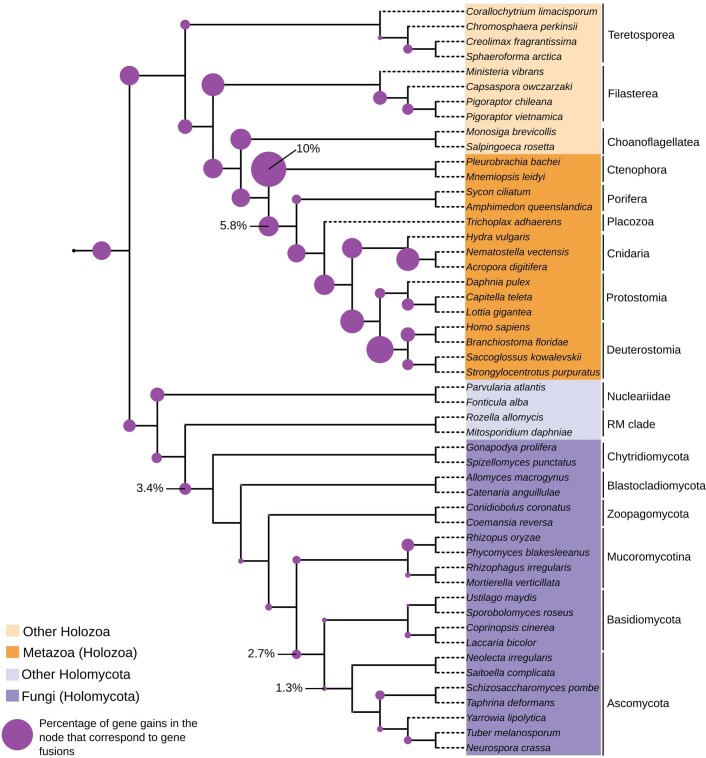
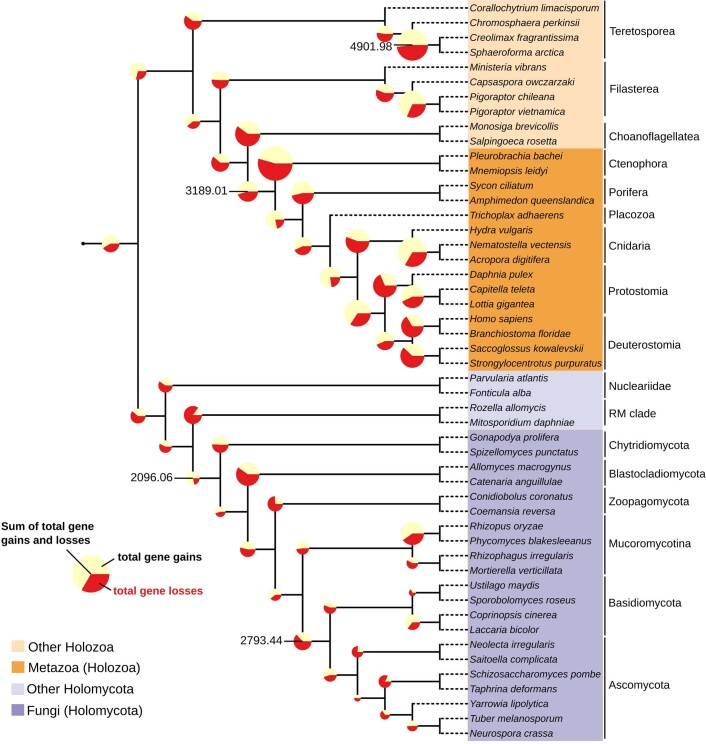
Animals and fungi have radically distinct morphologies, yet both evolved within the same eukaryotic supergroup: Opisthokonta1,2. Here we reconstructed the trajectory of genetic changes that accompanied the origin of Metazoa and Fungi since the divergence of Opisthokonta with a dataset that includes four novel genomes from crucial positions in the Opisthokonta phylogeny. We show that animals arose only after the accumulation of genes functionally important for their multicellularity, a tendency that began in the pre-metazoan ancestors and later accelerated in the metazoan root. By contrast, the pre-fungal ancestors experienced net losses of most functional categories, including those gained in the path to Metazoa. On a broad-scale functional level, fungal genomes contain a higher proportion of metabolic genes and diverged less from the last common ancestor of Opisthokonta than did the gene repertoires of Metazoa. Metazoa and Fungi also show differences regarding gene gain mechanisms. Gene fusions are more prevalent in Metazoa, whereas a larger fraction of gene gains were detected as horizontal gene transfers in Fungi and protists, in agreement with the long-standing idea that transfers would be less relevant in Metazoa due to germline isolation3-5. Together, our results indicate that animals and fungi evolved under two contrasting trajectories of genetic change that predated the origin of both groups. The gradual establishment of two clearly differentiated genomic contexts thus set the stage for the emergence of Metazoa and Fungi.


Conflict of interest statement

The authors declare no competing interests.

Figures

Fig. 1
Fig. 1. Lineages leading to modern Metazoa and Fungi experienced sharply contrasting trajectories of genetic changes.
a,b, Net gains and losses of ‘Cluster of Orthologous Groups’ categories with functional information (hereafter referred to as functional categories) since the divergence of Opisthokonta to the emergence of both groups. See Extended Data Fig. 4 for full category names and for information on the other ancestral nodes. c, Boxplot distribution of the cumulative net gains and losses of functional categories that occurred in each of the ancestral paths leading to the extant representatives of Metazoa (n = 15) and of Fungi (n = 21) since the origin of both groups (Supplementary Tables 1 and 2). Outliers are not represented, but a fully displayed version of c is available in Supplementary Fig. 1. Note that, on average, Metazoa tended to accumulate genes for every functional category, whereas only a few categories experienced net gains in the path to modern Fungi. d, Changes in functional category composition during the evolution of Opisthokonta, with percentages indicating the magnitude of change in each ancestor (Supplementary Table 3). Metazoa-related and Fungi-related categories are indicated in Fig. 2a. The cladogram shown was reconstructed based on the most supported topologies found for Holozoa and Holomycota in the phylogenetic analyses (Supplementary Information 3). Genomic data were produced for the four species in bold.
Fig. 2
Fig. 2. Gradual compositional change at the gene function level predated the origin of Metazoa and Fungi.
a, Correspondence analysis on the functional category compositions of modern metazoan and fungal gene contents (see species names in Supplementary Table 4). Amphimedon queenslandica was excluded because its outlier behaviour impairs proper data visualization (Extended Data Fig. 6a). Metazoa and Fungi cluster separately in dimension 1, the axis concentrating the largest fraction of variability (68.1%). Functional categories were grouped as Fungi-related or Metazoa-related from their contribution to dimension 1. b,c, Evolution of the functional category compositions in the ancestral paths leading to the species that got the highest scores by the machine learning classifiers that were trained to detect functional category compositions characteristic of Metazoa (b) and Fungi (c) (Supplementary Table 5). See the functional category composition of each ancestral node in Fig. 1d. d, Evolution of metabolic genomic representation in Opisthokonta, measured as the percentage of gene content represented by Kyoto Encyclopedia of Genes and Genomes (KEGG) Orthology Groups related to metabolism (Supplementary Table 3). Fungi have a larger fraction of their gene content involved in metabolism.
Fig. 3
Fig. 3. Taxonomic differences in the relative contribution of gene originations, gene duplications, horizontal gene transfers and gene fusions to gene gains.
ad, Dots correspond to the percentage of gene gains explained by each mechanism in every ancestral lineage of Opisthokonta (Supplementary Table 6; values were normalized to the maximum value found in each plot for a better representation of differences between groups). For every plot, the asterisks indicate the groups that present significantly lower (b and d) or higher (c) distribution of values than Metazoa (Holozoa), according to one-tailed Mann–Whitney U-test results. *P ≤ 0.05, **P ≤ 0.01 and ***P ≤ 0.001 (see exact P values in Supplementary Table 6).
Fig. 4
Fig. 4. The large genetic differences between modern animals and fungi are the outcome of two contrasting trajectories of genetic changes that preceded the origin of both groups.
These divergent trajectories started immediately after the split of their last common ancestor (Opisthokonta) into Holozoa and Holomycota and continued during the emergence and diversification of Metazoa and Fungi.
Extended Data Fig. 1
Extended Data Fig. 1. The importance of taxon sampling in ancestral gene content reconstructions and intron density across eukaryotes.
(A) Influence of taxon sampling in the ancestral reconstruction of protein domains innovations (Pfam domains). Note that with the addition of taxon sampling from unicellular relatives of animals (Choanoflagellatea -C-, Filasterea -F-, Teretosporea -T-), the number of pre-metazoan protein domain originations increase at the expense of originations that were originally detected at M4 in the 'No unicell. Holozoa' condition. The origin of every protein domain was inferred at the last common ancestor of all the species in which the domain is represented. This analysis was carried out with the taxon sampling euk_db, first excluding all representatives from C, F and T groups ('No unicell. Holozoa'), and then progressively adding data from these groups in a chronological order corresponding to when the genomic data from the representatives of these groups became publicly available. Ancestral node abbreviations: M4 = last common ancestor (LCA) of Metazoa. M3 = LCA of Choanoflagellatea and M4. M2 = LCA of Filasterea and M3. M1 = LCA of Teretosporea and M2. O = LCA of Opisthokonta. (See Fig. 1d for an illustration of the phylogenetic context of these ancestral nodes). (B) Distribution of introns per kb in an eukaryotic dataset including the four genomes sequenced for this manuscript as well as the metrics included in the Fig. 1—source data 1 of ref. .
Extended Data Fig. 2
Extended Data Fig. 2. Genome size and gene count metrics in eukaryotes.
Distrubtion of (A) 'Genome size (Mb)' and (B) 'Number of genes' in an eukaryotic dataset including the four genomes produced as well as the metrics included in the Fig. 1—source data 1 of ref. .
Extended Data Fig. 3
Extended Data Fig. 3. Intron per gene and mean intro size metrics in eukaryotes.
Distrubtion of (A) 'Introns per gene' and (B) 'Mean intron size (bp)' in an eukaryotic dataset including the four genomes produced as well as the metrics included in the Fig. 1—source data 1 of ref. . Whereas a potential loss of non-coding regions in the P. atlantis genome during the metagenome decontamination could have led to an underestimation of the genome size metric, the high ratio of introns per gene and the small size of introns found strongly suggests that the intron-richness of this nucleariid is not an artefactual result.
Extended Data Fig. 4
Extended Data Fig. 4. Evolution of functional category composition in Opisthokonta.
(AC) Net gains and losses of functional categories in those ancestral nodes that are not represented in Fig. 1. (D) Consensus phylogeny of Opisthokonta as reconstructed from the phylogenetic analyses (Supplementary Information 3). Genomic data was produced for the four species in bold. Branch colors correspond to the weighted average probability retrieved for every ancestor (internal branches) by the machine-learning classifiers that were trained to detect differential COG-compositional features of extant Metazoa and of Fungi (see Methods). Branch colors in the Holozoa clade represent the weighted averages from the metazoan predictors, and in the Holomycota clade the weighted average from the fungal predictors (Supplementary Table 5). (E) Cluster of Orthologous Groups (COG) categories with functional information (referred to as functional categories along the manuscript).
Extended Data Fig. 5
Extended Data Fig. 5. Differences in functional category composition, metabolic gene content changes and differential contribution of gene fusion originations vs non-fusion originations to each functional category in Opisthokonta.
(A) Relative and (B) absolute counts of functional categories in the opisthokont species from euk_db (Supplementary Tables 7 and 8, respectively). (C) Gains and losses of metabolic genes (KEGG orthology groups) in the Opisthokonta nodes preceding H. sapiens and (D) in the Opisthokonta nodes preceding N. crassa (Supplementary Table 9). (E) Differential representation of functional categories among fusion originations vs non-fusion originations in the Opisthokonta nodes preceding H. sapiens and (F) in the Opisthokonta nodes preceding N. crassa (Supplementary Table 10).
Extended Data Fig. 6
Extended Data Fig. 6. Correspondence analyses contribution biplots on functional category compositions in Opisthokonta, phylostratigraphic analyses of functional category changes in the evolutionary path towards extant Metazoa and clustering of Opisthokonta species based on gene family content composition.
Correspondence Analyses contribution biplot for the relative representation of functional categories (Supplementary Table 7) in the species from euk_db dataset representing (A) Metazoa and Fungi (B) Opisthokonta (i.e., Metazoa, Fungi, and also the other Holozoa and Holomycota sampled, Supplementary Table 4), and (C) every ancestor represented by an internal node in the Opisthokonta phylogeny (see Fig. 7 in Supplementary Information  3 for a mapping of every ancestral lineage to the phylogeny). (D) Phylostratigraphic origin of each functional category for those gene families that experienced increments in copy number (either gene gains or gene originations) in the last common ancestor of Metazoa for each functional category (Supplementary Table 12). (E) Phylostratigraphy of the ancestral gene content of Homo sapiens for each functional category (Supplementary Table 11). (F) Increment in the relative representation of functional categories which are particularly important for animal multicellularity since the divergence of Opisthokonta (Supplementary Table 13). (G) Similarities in gene family (orthogroups) composition between all the Opisthokonta species included in our study. We first computed the raw similarity value for each pair of species by inspecting those gene families found in both species and adding up for each of these families the lowest copy number value found among the two species. Each raw similarity value was then normalized by multiplying it by two and dividing it by the maximum possible similarity value that could have been found for that pair of species, which corresponds to the sum of members that every gene family has in the two species (species-specific families were not considered) (Supplementary Table 14). The dendrogram was reconstructed using the 'ward.D' method from the R package hclust.
Extended Data Fig. 7
Extended Data Fig. 7. Gene content size changes in Opisthokonta evolution.
Gene content size inferred for every ancestral node of the Opisthokonta phylogeny as shown by the size of corresponding pie chart (values are shown for some nodes in order to illustrate the proportionality between the diameter size and the numeric values).
Extended Data Fig. 8
Extended Data Fig. 8. Relative contribution of gene originations to gene gains in Opisthokonta evolution.
Percentages of gene gains corresponding to gene originations (including gene fusions) inferred for every ancestral node of the Opisthokonta phylogeny as shown by the size of corresponding pie chart (values are shown for some nodes in order to illustrate the proportionality between the diameter size and the numeric values).
Extended Data Fig. 9
Extended Data Fig. 9. Relative contribution of gene fusions to gene gains in Opisthokonta evolution.
Percentages of gene gains corresponding to gene fusions inferred for every ancestral node of the Opisthokonta phylogeny as shown by the size of corresponding pie chart (values are shown for some nodes in order to illustrate the proportionality between the diameter size and the numeric values).
Extended Data Fig. 10
Extended Data Fig. 10. Gene gains and losses in Opisthokonta evolution.
Sum of gene gains and gene losses (and the fraction of the sum corresponding to each one) inferred for the internal nodes of the Opisthokonta phylogeny as shown by the size of corresponding pie chart (values are shown for some nodes in order to illustrate the proportionality between the diameter size and the numeric values).

Comment in

  • The origin of animals and fungi.
    Koch L. Koch L. Nat Rev Genet. 2022 Nov;23(11):648-649. doi: 10.1038/s41576-022-00533-1. Nat Rev Genet. 2022. PMID: 36075981 No abstract available.

Similar articles

Cited by

References

    1. Adl SM, et al. Revisions to the classification, nomenclature, and diversity of eukaryotes. J. Eukaryot. Microbiol. 2019;66:4–119. doi: 10.1111/jeu.12691. - DOI - PMC - PubMed
    1. Torruella G, et al. Phylogenomics reveals convergent evolution of lifestyles in close relatives of animals and fungi. Curr. Biol. 2015;25:2404–2410. doi: 10.1016/j.cub.2015.07.053. - DOI - PubMed
    1. Andersson JO. Lateral gene transfer in eukaryotes. Cell. Mol. Life Sci. 2005;62:1182–1197. doi: 10.1007/s00018-005-4539-z. - DOI - PMC - PubMed
    1. Keeling PJ, Palmer JD. Horizontal gene transfer in eukaryotic evolution. Nat. Rev. Genet. 2008;9:605–618. doi: 10.1038/nrg2386. - DOI - PubMed
    1. Doolittle WF. Phylogenetic classification and the universal tree. Science. 1999;284:2124–2128. doi: 10.1126/science.284.5423.2124. - DOI - PubMed