. 2022 Sep;609(7925):174-182.
doi: 10.1038/s41586-022-05126-w. Epub 2022 Aug 24.

RASA2 ablation in T cells boosts antigen sensitivity and long-term function

Affiliations

RASA2 ablation in T cells boosts antigen sensitivity and long-term function

Julia Carnevale et al. Nature. 2022 Sep.

Abstract

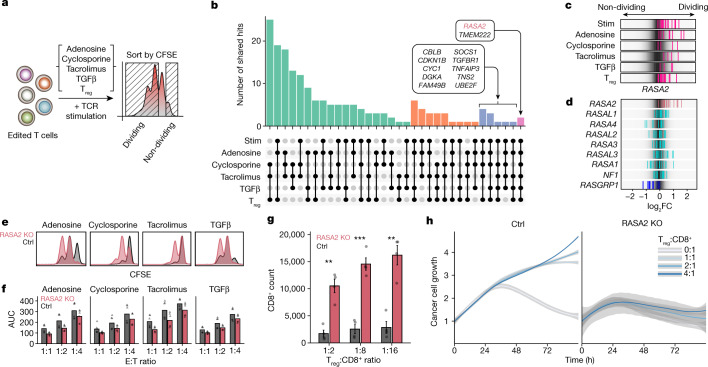
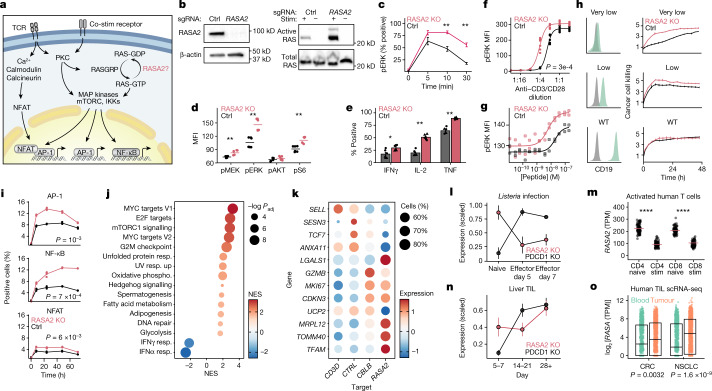
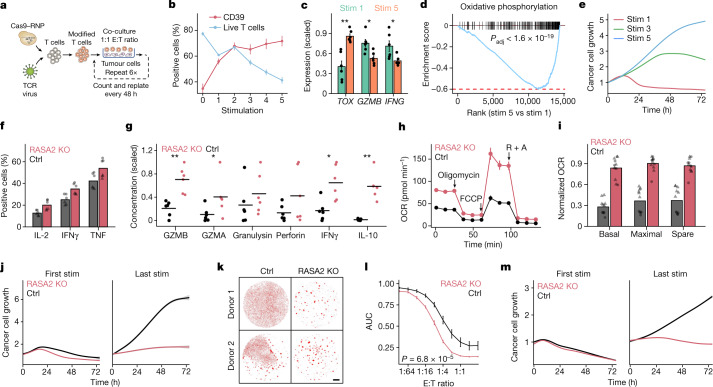
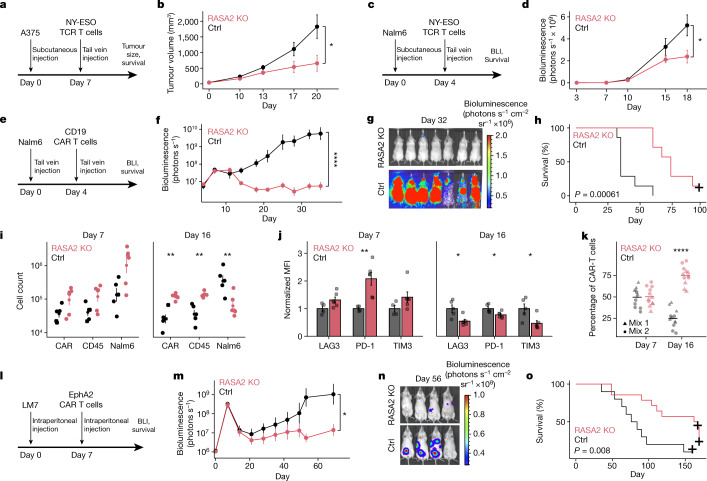
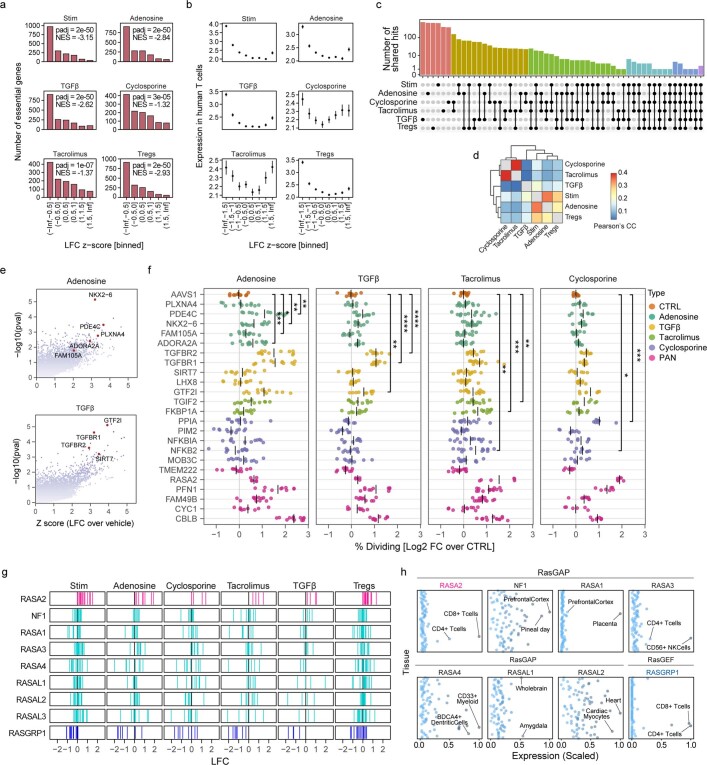
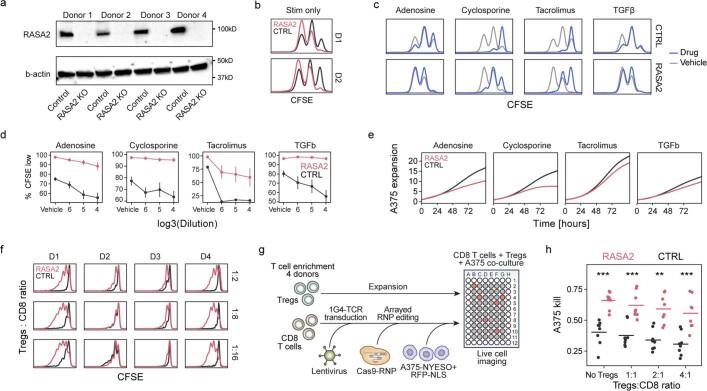
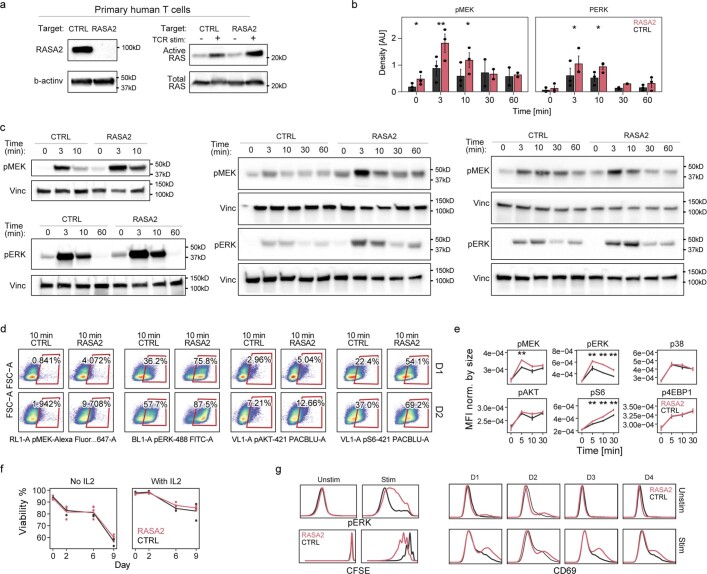
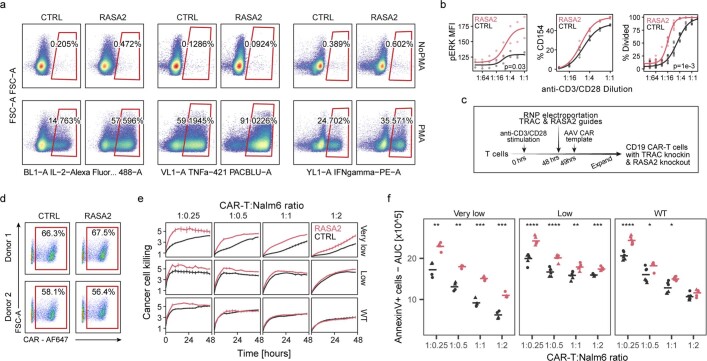
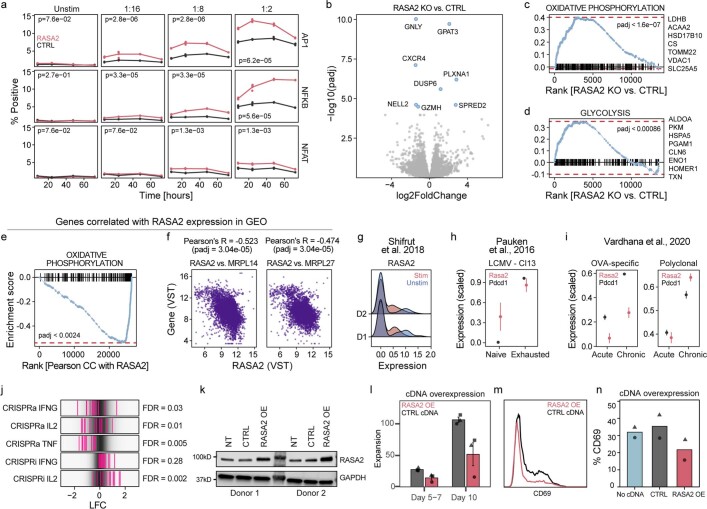
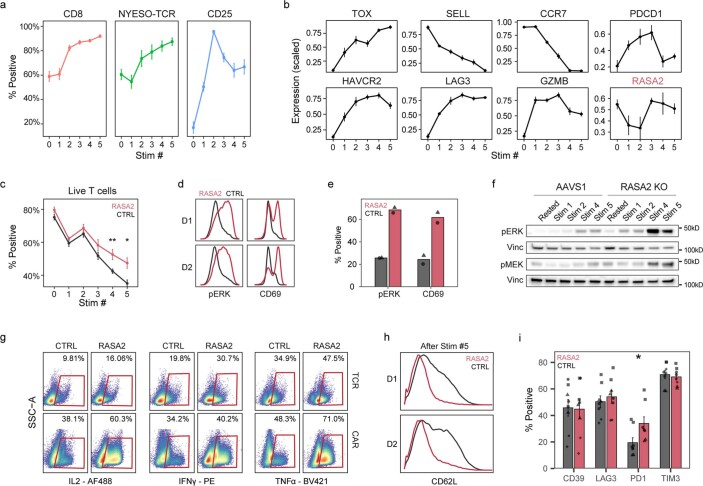
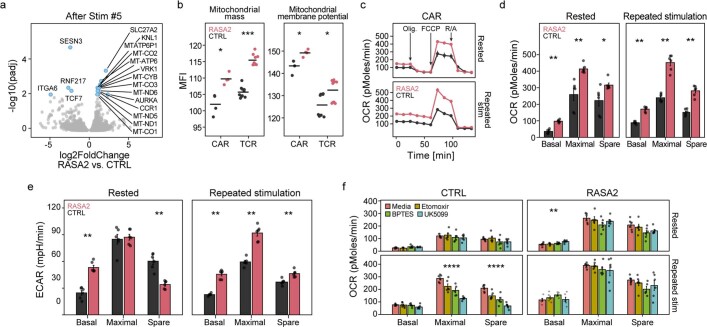
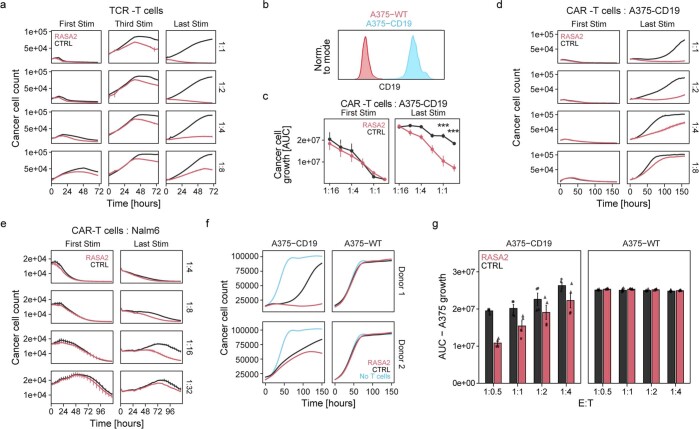
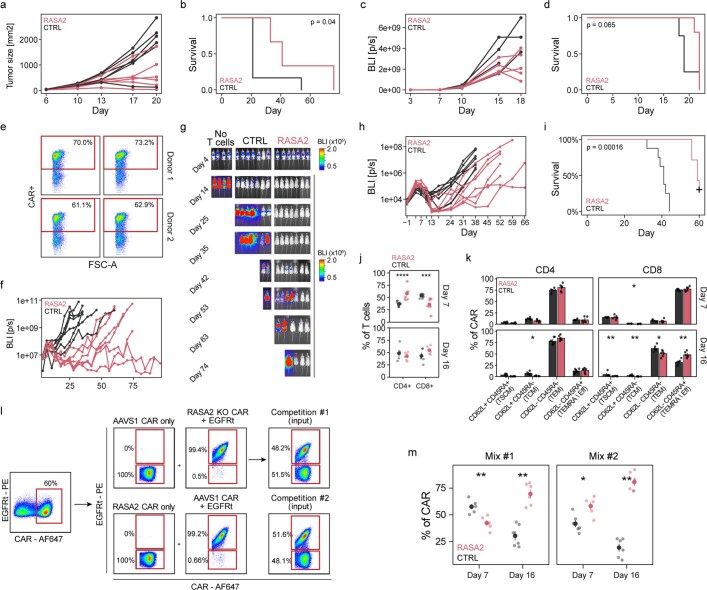
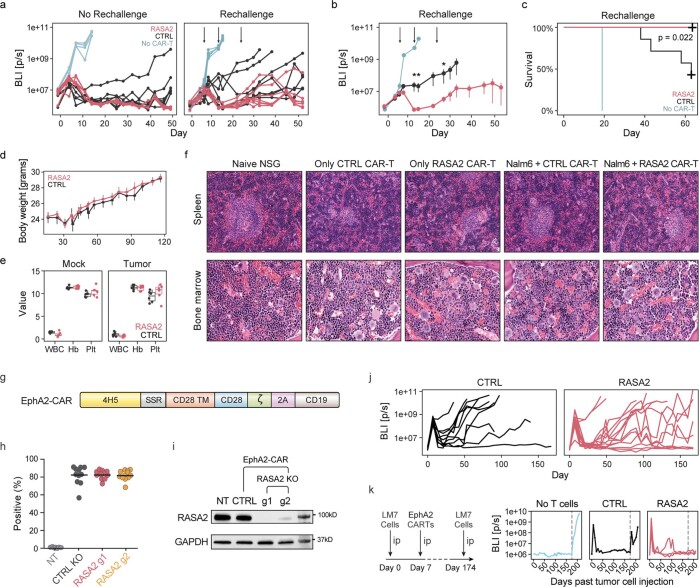
The efficacy of adoptive T cell therapies for cancer treatment can be limited by suppressive signals from both extrinsic factors and intrinsic inhibitory checkpoints1,2. Targeted gene editing has the potential to overcome these limitations and enhance T cell therapeutic function3-10. Here we performed multiple genome-wide CRISPR knock-out screens under different immunosuppressive conditions to identify genes that can be targeted to prevent T cell dysfunction. These screens converged on RASA2, a RAS GTPase-activating protein (RasGAP) that we identify as a signalling checkpoint in human T cells, which is downregulated upon acute T cell receptor stimulation and can increase gradually with chronic antigen exposure. RASA2 ablation enhanced MAPK signalling and chimeric antigen receptor (CAR) T cell cytolytic activity in response to target antigen. Repeated tumour antigen stimulations in vitro revealed that RASA2-deficient T cells show increased activation, cytokine production and metabolic activity compared with control cells, and show a marked advantage in persistent cancer cell killing. RASA2-knockout CAR T cells had a competitive fitness advantage over control cells in the bone marrow in a mouse model of leukaemia. Ablation of RASA2 in multiple preclinical models of T cell receptor and CAR T cell therapies prolonged survival in mice xenografted with either liquid or solid tumours. Together, our findings highlight RASA2 as a promising target to enhance both persistence and effector function in T cell therapies for cancer treatment.


Conflict of interest statement

J.E. is a compensated co-founder at Mnemo Therapeutics, a compensated scientific advisor to Cytovia Therapeutics, owns stocks in Mnemo Therapeutica and Cytovia Therapeutics and has received a consulting fee from Casdin Capital. The Eyquem laboratory has received research support from Cytovia Therapeutic and Takeda. J.E. is a holder of patents pertaining to but not resulting from this work. A.A. is a co-founder of Tango Therapeutics, Azkarra Therapeutics, Ovibio Corporation and Kytarro, a member of the boards of Cytomx and Cambridge Science Corporation, a member of the scientific advisory boards of Genentech, GLAdiator, Circle, Bluestar, Earli, Ambagon, Phoenix Molecular Designs and Trial Library, a consultant for SPARC, ProLynx and GSK, and a recipient of grant or research support from SPARC and AstraZeneca, and holds patents on the use of PARP inhibitors held jointly with AstraZeneca from which he has benefited financially (and may do so in the future). A.M. is a cofounder of Arsenal Biosciences, Spotlight Therapeutics and Survey Genomics, serves on the boards of directors at Spotlight Therapeutics and Survey Genomics, is board observer (and former member of the board of directors) at Arsenal Biosciences, is a member of the scientific advisory boards of Arsenal Biosciences, Spotlight Therapeutics, Survey Genomics and NewLimit, owns stock in Arsenal Biosciences, Spotlight Therapeutics, NewLimit, Survey Genomics, PACT Pharma, and Merck, and has received fees from Arsenal Biosciences, Spotlight Therapeutics, NewLimit, 23andMe, PACT Pharma, Juno Therapeutics, Trizell, Vertex, Merck, Amgen, Genentech, AlphaSights, Rupert Case Management, Bernstein and ALDA. A.M. is an investor in and informal advisor to Offline Ventures and a client of EPIQ. The Marson laboratory has received research support from Juno Therapeutics, Epinomics, Sanofi, GlaxoSmithKline, Gilead and Anthem. S.G. has a consulting agreement with Tessa Therapeutics, and is a compensated DSMB member of Immatics, and has received honoraria from Tidal, Catamaran Bio and Novartis within the last 2 years. The Gottschalk laboratory has received research support from Tessa Therapeutics. A.T.S. is a scientific founder of Immunai and founder of Cartography Biosciences and receives research funding from Arsenal Biosciences, Allogene Therapeutics and Merck Research Laboratories. H.O. has been a compensated consultant within the last 2 years for Bristol-Myers Squibb, Alexion Pharmaceuticals, Amal Therapeutics, Servier Pharmaceuticals, Neuvogen and Eureka Therapeutics. J.C., E.S., A.A. and A.M. are listed as inventors on a world patent application (WO2020014235A1) related to this work, Gene Targets for T-cell-Based Immunotherapy, which has been licensed.

Figures

Fig. 1
Fig. 1. Multiple genome-wide CRISPR screens in primary human T cells identify RASA2 as a modulator of resistance to immunosuppressive conditions.
a, Schematic of genome-wide screens for resistance gene targets in human T cells. b, Top shared gene hits (z-score >1.5) between 5 (blue) and all 6 (pink) of the screens are labelled. Bar height is the number of shared genes among the screens, connected by dots in the lower panel (n = 4 human donors for stimulated (stim) and Treg cell screens, n = 2 for adenosine, cyclosporine and tacrolimus, and n = 1 for the TGFβ screen). c,d, log2 fold change (FC) for individual guide RNAs (vertical lines); background shows the overall guide distribution in greyscale. c, Guides targeting RASA2 (pink) across all suppressive conditions. d, Guides targeting RasGAP family members other than RASA2 were not enriched consistently in either direction, whereas guides targeting the RasGEF RASGRP1 were depleted from dividing cells as expected. e, Distribution of CFSE staining in RASA2-KO versus control (Ctrl; non-targeting guide RNA) T cells across all suppressive conditions. f, Cancer cell growth during in vitro cancer cell-killing assay under suppressive conditions. AUC, area under the growth curve. n = 2 donors in triplicate, shape denotes donor. g, Suppression assay confirms that RASA2 ablation rendered T cells resistant to Treg cell suppression of proliferation in vitro. Bars show the CD8+ cell count 4 days after stimulation (n = 4 donors per group; mean ± s.e.m.; **P < 0.01 and ***P < 0.001, two-sided paired Student’s t-test). h, RASA2 ablation rendered T cells resistant to Treg cell suppression compared with control T cells in an in vitro cancer cell-killing assay for one representative donor out of four (summary statistics shown in Extended Data Fig. 2g). Line is the mean and shaded area is 95% confidence interval for 3 technical replicates. Source data
Fig. 2
Fig. 2. RASA2 ablation promotes T cell activation, antigen sensitivity and effector function.
a, RAS signaling and downstream transcriptional programmes in T cells. Drawing is adapted from ref. . IKK, inhibitor of NF-κB kinase. b, Western blot showing RASA2 protein expression in Jurkat cells and GTP-bound active RAS after TCR stimulation. c, Flow cytometry-based analysis of phospho-ERK kinetics in stimulated primary human T cells. d, Scaled phosphoprotein mean fluorescence intensity (MFI) in MAPK and AKT–mTOR pathways. e, Effector cytokine levels in stimulated T cells. f,g, pERK levels 10 min after TCR stimulation with anti-CD3/CD28 (f) or T2 cells preloaded with cognate peptide (g). h, Left, CD19 expression on engineered Nalm6 cancer target cells (green) compared with unstained cells (grey). Right, CAR T cell killing of Nalm6 cells expressing varying CD19 levels, measured by annexin staining. Data are mean ± s.d. of technical triplicates from one representative donor out of two. WT, wild type. i, Percentage of Jurkat cells positive for transcription factor-responsive mCherry reporters. j, GSEA of differentially expressed genes between RASA2-KO and control cells after TCR stimulation. Dot size represents adjusted P-value (Padj; two-sided permutation test). NES, normalized enrichment score; phospho, phosphorylation; resp., response. k, Differentially expressed genes in stimulated RASA2-KO T cells with perturbation of the indicated target genes. Colour indicates mean expression level and size shows the percentage of cells with detectable expression (n = 2 donors). lo, RASA2 expression in a mouse model of Listeria infection (l; n = 3 mice; mean ± s.e.m.), in vitro activated human T cells (m; n = 91 donors; two-sided Wilcoxon test), a mouse model of tumour-infiltrating T cells (TIL) (n, showing days after T cell transfer; n = 3 mice; mean ± s.e.m.) and human tumour-infiltrating T cells (orange) or peripheral T cells (green) (o). o, Box limits show quartiles, the horizontal line is the median (n = 12 donors for colorectal cancer (CRC) and n = 14 donors for non-small cell lung carcinoma (NSCLC); two-sided Wilcoxon test). ce, Lines show mean; n = 2 donors in triplicate; two-sided Wilcoxon test. f,g, n = 2 donors in triplicate; fitted 4-parameter dose–response curves; two-sample Kolmogorov–Smirnov test. *P < 0.05, **P < 0.01, ****P < 0.0001. Source data
Fig. 3
Fig. 3. RASA2 ablation improves functional T cell persistence through repeated cancer cell exposures.
a, Schematic of experiment for modelling T cell persistence in vitro. RNP, ribonuclear protein. b, T cell viability and CD39 levels were measured by flow cytometry after each stimulation (n = 4 donors; mean ± s.e.m.). c, Expression of key genes in T cells by RNA-seq after the first and fifth stimulations (n = 3 donors, stimulated via CAR or TCR; mean ± s.e.m.; two-sided Wilcoxon test). d, GSEA of differentially expressed genes between T cells after first and fifth stimulation. Adjusted P-value by two-sided permutation test. e, Cancer cell growth in co-culture with TCR T cells after multiple stimulations. The line is the fitted mean for triplicates. f,g, Effector cytokine production after repeated stimulations, as measured by flow cytometry (f; n = 2 donors in triplicate; shape denotes donor) or by multiplex ELISA (g; n = 3 donors; technical duplicates as dots; lines show mean; two-sided Wilcoxon test). h, Oxygen consumption rate (OCR) trace of TCR T cells after repeated tumour stimulations. Arrows mark addition of oligomycin, FCCP and rotenone + antimycin A (R + A) (one donor in 6 technical replicates; mean ± s.d.) i, Oxygen consumption rate measured in mitochondrial stress test (n = 2 donors in 6 technical replicates; shape denotes donor; values normalized to a maximum of 1 for each donor). j, Cancer cell killing after 1 and 5 stimulations. The shaded area shows the 95% confidence interval for triplicates. k, Imaging of RFP+ A375 cells co-cultured with T cells exposed to repeated stimulations. Scale bar, 1 mm. l, Summary statistics for area under the growth curve of cancer cells over a range of effector T cell:target cell ratios (n = 7 donors; mean ± s.e.m.; two-sample Kolmogorov–Smirnov test). m, RASA2-KO CD19 CAR T cells maintained efficient killing after six previous stimulations. Data are representative of one of three donors. The shaded area shows the 95% confidence interval for triplicates. Statistical tests as indicated, *P < 0.05, **P < 0.01. Source data
Fig. 4
Fig. 4. RASA2 ablation improves in vivo tumour control by engineered T cells in multiple preclinical models.
a,b, NY-ESO-1+ A375 melanoma cells were engrafted into NSG mice via flank injection and NY-ESO-1-specific TCR T cells were injected via the tail vein. a, Experimental timeline. b, Tumour growth was monitored with calliper measurements (n = 6 mice per group; mean ± s.e.m.; two-sided unpaired Student’s t-test). c,d, NY-ESO-1+ Nalm6 leukaemia cells were injected into NSG mice followed by NY-ESO-1-specific TCR T cells. c, Experimental timeline. BLI, bioluminescence live imaging. d, Tumour growth was monitored using luciferase-based bioluminescence live imaging (n = 5 mice for RASA2-KO T cells, n = 4 for control T cells; mean ± s.e.m.; two-sided unpaired Student’s t-test). e,f, Nalm6 cells were injected into NSG mice followed by CD19-specific CAR T cells. e, Experimental timeline. f, Tumour growth was monitored by bioluminescence imaging (n = 7 mice per group; mean ± s.e.m.; two-sided unpaired Student’s t-test). g, Bioluminescence imaging of the cohort in f, dorsal view. h, Survival of the cohort shown in f. i, Cell counts by flow cytometry in bone marrow of Nalm6-engrafted NSG mice (day 7: n = 5 for control, n = 6 for RASA2 KO; day 16: n = 6 per group; mean ± s.e.m.; two-sided Wilcoxon test). j, Mean fluorescence intensity (normalized to control) of inhibitory markers on cells from cohort in i (mean ± s.e.m.; two-sided Wilcoxon test). k, Percentage of mixed CAR T cell population (originally injected into mice, mixed 50:50 (control:RASA2-KO CAR T cells)), isolated from bone marrow days 7 and 16 after infusion into Nalm6-bearing mice (n = 6 mice per group; two-sided Wilcoxon test). lo, NSG mice were injected intraperitoneally with LM7-ffLuc tumour cells on day 0, then received a single intraperitoneal injection of control or RASA2-KO EphA2-CAR T-cells. l, Experimental timeline. m, Quantitative bioluminescence imaging (mean ± s.e.m.; n = 10 for control, n = 14 for RASA2 KO; two-sided paired Student’s t-test). n, Representative bioluminescence for each group. o, Survival curve for the cohort in m. Survival P-values by log-rank test. Statistical tests as indicated. *P < 0.05, **P < 0.01, ****P < 0.0001. Source data
Extended Data Fig. 1
Extended Data Fig. 1. Multiple genome-wide CRISPR screens for T cell resistance.
a, Dropout of essential genes across screen conditions. X-axis is scaled and binned log2 fold change of CFSE low over CFSE high cells in each screen, Y-axis is the number of essential genes in each bin. As expected, essential genes tend to have a negative LFC in these CRISPR KO screens of primary human T cells (n = 4 human donors for Stim and Tregs screens, n = 2 for Adenosine, Cyclosporine and Tacrolimus screens, and n = 1 for the TGFβ screen. Normalized Enrichment Score (NES) and adjusted p-value by GSEA and two-sided permutation test). b, Screen hits are expressed in human T cells. X-axis is scaled and binned log2 fold change in each screen, Y-axis shows the expression in activated human T cells. Both negative and positive hits tended to be highly expressed in human T cells, suggesting these pooled KO screens point to relevant T cell biology (n = 4 human donors for Stim and Tregs screens, n = 2 for Adenosine, Cyclosporine and Tacrolimus screens, and n = 1 for the TGFβ screen, dots are mean +/− SEM). c, Shared hits (y-axis) (z-score > 1.5, methods) across the screen conditions (x-axis) including hits unique to each individual screen. Shared hits for each subset are detailed in Supplementary Table 1. d, Heatmap of the pairwise Pearson’s correlation coefficient for gene-level z-scores for all screen conditions. e, Volcano plots showing p-value (MAGeCK RRA one-sided test and methods) on the y-axis and gene-level z-scores on the x-axis, comparing highly dividing cells in each suppressive condition to highly dividing in the vehicle condition. Highlighted are genes found to be specific to adenosine and TGFβ screens, selected for further validation. f, Gene targets from screens were selected as either general (PAN) or more specific to certain suppressive contexts and were knocked out individually in T cells. CFSE stained, Cas9 RNP-electroporated edited T cells were stimulated and cultured in the different suppressive conditions. Percent of cells proliferating for each gene KO compared to control cells are displayed for each suppressive condition (n = 2 donors, 2 sgRNAs per gene target in triplicates. We highlighted gene KOs found to confer significant resistance in predicted conditions (adenosine, TGFB, and calcium/calcineurin inhibitors – Tacrolimus, and Cyclosporine), using a cut-off of FDR adjusted p-value < 0.05. For clarity, displayed are the significant p-values for gene targets according to their suppressive screen condition of origin, but results for all genes across conditions are detailed in Supplementary Table 3). As expected, ADORA2A, TGFBR1 and TGFBR2, FKBP1A, and PPIA KOs conferred resistance in the adenosine, TGFB, Tacrolimus, and Cyclosporine conditions, respectively. PDE4C and NKX2-6 KOs were found to confer relatively selective resistance in the adenosine condition, and NFKB2 KO was found to increase resistance in the calcineurin inhibitor (tacrolimus and cyclosporine) conditions. TMEM222, while scoring very highly in the screens, did not increase proliferative advantage in this arrayed validation (dots are individuals replicates, black vertical lines are the mean, *p < 0.05, **p < 0.01, ***p < 0.001 and ***p < 0.0001 for two-sided unpaired Student’s t-test). g, Log fold change (LFC) of guides targeting RasGAP genes or the RasGEF RASGRP1, across the different suppressive screen conditions shown here. h, Expression levels (scaled to minimum of 0 and a maximum of 1) of the RasGAP family members available in the BioGPS dataset, including RASA2, across healthy human tissues revealed RASA2 as selectively expressed in CD8+/4+ human T cells. Data also shown for RASGRP1, a RasGEF with defined roles in TCR signaling and an expression pattern strikingly similar to that of RASA2. Source data
Extended Data Fig. 2
Extended Data Fig. 2. RASA2 validates as a T cell target to engineer resistance to suppressive conditions.
a, Western blots showing level of RASA2 ablation in T cells from 4 human blood donors. b, RASA2 KO T cells have a stimulation dependent proliferative advantage over control T cells, for two independent human donors (D1 and D2). c, CFSE staining traces showing how suppressive conditions inhibited T cell proliferation compared to vehicle conditions, for one representative human T cell donor. We note that although both RASA2-KO and control-edited (CTRL) T cells were inhibited by the suppressive signals to varying degrees, RASA2 KO T cells retain a consistent proliferation advantage in each condition. d, Summary of gated CFSE low (dividing) cells on y-axis across a range of suppressive conditions on x-axis (mean +/- SEM, n = 2 donors in 3 replicates). e, Cancer killing assay by NY-ESO-1-specific 1G4 TCR-T cells in the presence of suppressive molecules. Lines show the count of A375-RFP+ cancer cells as detected by live-cell microscopy, normalized by their count at t = 0. Grey area represents a 95% confidence interval of one representative donor with 3 technical replicates. f, Treg suppression assay. Stimulated CD8 T cells were stained by CFSE to track their proliferation in co-culture with suppressive Tregs. T cells from four distinct human donors are shown across the columns, with Tregs:CD8 ratio shown in the rows. g, Schematic of cancer killing assay by effector T cells in the presence of Tregs. h, Cancer cell killing (calculated by 1 - scaled AUC for the cancer cell growth curve) shown on the y-axis for a range of Tregs:CD8 ratios. Horizontal lines are the mean, dots are individual wells (CTRL = non-targeting guide, n = 4 human donors, each in 2 replicates, **p < 0.01 and ***p < 0.001 for two-sided Wilcoxon test). Source data
Extended Data Fig. 3
Extended Data Fig. 3. RASA2 is a TCR stimulation-dependent attenuator of Ras-MAPK signaling.
a, Western blot showing effect of RASA2 ablation on the level of active Ras in primary human T cells with or without TCR stimulation. b, Densitometry measurements calculated for p-MEK and p-ERK westerns and averaged for all 3 T cell donors (mean ± SEM, *p < 0.05 and **p < 0.01 for two-sided paired t-test) c, Western blots showing the effect of RASA2 ablation compared to control-edited T cells for phospho-MEK and phospho-ERK over time after TCR stimulation in primary human T cells from 3 human donors from (b). d, Flow cytometry plots showing representative gating for phospho-proteins in the Ras signaling pathway in 2 human donor T cells after TCR stimulation. e, Summary of MFI for phospho-proteins in Ras signaling pathways over time after TCR stimulation. Y-axis shows MFI for each marker divided by MFI for FSC-A to normalize for cell size (mean +/− SEM, n = 2 donors in 3 replicates, **p < 0.01 for two-sided Wilcoxon test). f, T cells from 2 donors after 13 days of expansion in culture split into cultures with or without IL2 in triplicates and viability was tracked over time. Lines are mean, individual dots are replicates. g, Flow cytometry histogram plots from stimulated and unstimulated T cells for pERK, CD69 and CFSE. Baseline levels of RASA2 KO and control-edited T cells remained similar (except for variability in CD69 levels), while after CD3/CD28 stimulation, RASA2 KO T cells showed higher levels of pERK, CD69 and proliferation over CTRL KO T cells. Results representative of 4 human donors. We noted heterogeneous expression of CD69 at baseline across donors, with some showing marginally higher levels in RASA2 KO T cells. Source data
Extended Data Fig. 4
Extended Data Fig. 4. RASA2 ablation increases the sensitivity to antigen stimulation.
a, Flow cytometry plots showing gating for cytokines in control (CTRL) and RASA2 KO T cells with (bottom row) and without (top row) PMA stimulation. b, left: Phosphorylated ERK levels (y-axis) measured by flow cytometry 10 min after TCR stimulation with titrated concentrations of anti-CD3/CD28 complexes (1:1 is 25 µl/ml Immunocult, n = 2 T cell donors in duplicates, lines show the 4-parameter logistic fit); middle: Percentage of cells positive for the T cell activation marker CD154 measured 18 h after stimulation with titrated concentrations of anti-CD3/CD28 complexes (1:1 = 25 µl/ml Immunocult, n = 2 T cell donors in duplicate); right: percentage of cells that divided based on CFSE profiles 3 days after stimulation with anti-CD3/CD28 complexes (n = 2 T cell donors in triplicates, lines show the 4-parameter logistic fit, p-value from a two-sample Kolmogorov-Smirnov test). c, Schema of CD19 CAR-T cell production, where the CAR is knocked into the TRAC locus and RASA2 versus AAS1 is targeted with Cas9 RNPs. d, Flow cytometry plots of CD19-CAR positive T cells after the CAR knockin strategy described in (c). e, TRAC CAR-T cell killing of target Nalm6 cells engineered to express varying CD19 levels (rows) measured by annexin levels in live cell microscopy across increasing CAR-T:Nalm6 ratios (columns) over 48 h (one representative donor out of two, 3 technical replicates, error bars are mean ± SD). f, Summary of cancer cell killing (scaled AUC of annexin levels) shown on the y-axis for a range of effector T cells to target cell ratios. Horizontal lines are the mean (n = 2 human donors, each in triplicates, *p < 0.05, **p < 0.01, ***p < 0.001, ****p < 0.0001, for two-sided unpaired Student’s t-test, shape denotes donor). Source data
Extended Data Fig. 5
Extended Data Fig. 5. RASA2 knockout promotes transcriptional reprogramming and RASA2 expression is differentially regulated by acute and chronic antigen stimulation.
a, Fraction of Jurkat cells positive for three different mCherry reporter cell lines responsive to the transcription factor as indicated to the right of each panel, after TCR stimulation with titrated dilutions (1:1 = 25 µl/ml) of anti-CD3/CD28 complexes (columns) over 72 h (dots show 3 technical replicates, p-value from a two-sample Kolmogorov-Smirnov test). b, Volcano plot showing differentially regulated genes between RASA2 KO and control-edited stimulated T cells as determined by RNA-Seq. Genes highlighted have BH adjusted, two-tailed Wald test p-value < 0.0001 and absolute log2 fold change > 1, as determined by DESeq2 analysis (methods). c, d Gene set enrichment analysis (GSEA) of oxidative phosphorylation (c) and glycolysis (d) ranked genes, based on DESeq2, higher rank indicates enrichment in RASA2 KO over CTRL. p-value is shown as determined by a two-sided permutation-test. Top up-regulated genes in each enrichment are listed to the right of each panel e, GSEA of oxidative phosphorylation genes correlated with RASA2 expression in immune cells in the GEO expression database, as retrieved by correlationAnalyzeR (methods). Genes are ranked by the Pearson correlation coefficients between RASA2 and the query gene, p-value by two-sided permutation test, after FDR adjustment. f, Selected examples of expression of RASA2 and two mitochondrial fitness genes, MRPL27 (left panel) and MRPL14 (right panel) across GEO datasets from immune cells. Shown at the top is the Pearson’s correlation coefficient (R) and FDR adjusted p-value (padj) for each scatter plot. Values represent expression after variance stabilizing transformation (VST). g, Expression of RASA2 in stimulated T cells compared to unstimulated T cells, as measured by published single-cell RNA-Seq dataset, for two human donors. h, i, Expression of Rasa2 compared to Pdcd1 in published RNA-Seq datasets from models of T cell exhaustion in murine T cells. Expression was scaled for a maximum of 1 and a minimum of 0 for each gene in each dataset (For LCMV samples in (h): n = 2 mice for Naive group, n = 3 mice for exhaustion group; for OVA samples, error bars are mean ± SEM (i): n = 3 mice for all groups, error bars are mean ± SEM). j, Log fold change (LFC) values for RASA2 sgRNAs in CRISPRa and CRISPRi screens for cytokine production (MAGeCK’s gene-level FDR listed for RASA2 in each screen). k, Western blot for level of RASA2 expression following RASA2 transgene or control (CTRL) transduction in two T cell donors. l, Normalized values for T cell expansion based on cell counts for T cells with RASA2 transgene versus GFP control (n = 3 human T cell donors, mean ± SEM, shape denotes donor). m, histogram for one example donor from cells described in (l), stained and FACS analyzed for CD69 activation marker. n, Summary data for CD69 levels in two T cell donors transduced with the RASA2 transgene versus control (n = 2 human T cell donors, shape denotes donor). Source data
Extended Data Fig. 6
Extended Data Fig. 6. Repetitive tumor stimulation assay shows that RASA2 ablation rescues T cells from a dysfunctional state.
a, Metrics of NY-ESO-1-specific 1G4 TCR-T cells after each repetitive co-culture with A375 tumor cells, including percent positive for CD8, NY-ESO-1 1G4 TCR, and activation marker CD25 (assessed by flow cytometry, n = 4 T cell donors, lines are mean ± SEM). b, Gene expression levels for selected genes, including RASA2, with repeated tumor stimulation measured by RNAseq (n = 3 donors TCR-T cells and n = 3 donors CAR-T cells, mean ± SEM). c, T cell viability, measured by flow cytometry with Live/Dead stain, compared between RASA2 KO and control (CTRL) T cells (n = 4 donors, mean ± SEM, *p < 0.05 and **p < 0.01 for two-sided Wilcoxon test). d, RASA2 KO T cells following multiple stimulations show higher levels of phosphorylated ERK and CD69 compared to control cells (n = 2 donors). e, Fraction of T cells positive by flow cytometry for p-ERK and CD69 after 6 repeated co-cultures with A375 tumor cells (n = 2 donors, mean ± SEM, *p < 0.05 for two-sided Wilcoxon test). f, Western blot analysis for p-ERK and p-MEK levels in T cells after each repeated CD3/CD28 stimulation. g, Flow cytometry data for multiple effector cytokines (labeled on bottom) in NY-ESO-1-specific TCR-T cells (top row) and CD19-specific CAR-T cells (bottom row) after 6 repeated co-cultures with target tumor cells. h, Histograms showing CD62L levels in NY-ESO-1-specific T cells in 2 donors after 6 repeated co-cultures with A375 tumor cells. i, Percent of cells expression exhaustion-associated markers as measured by flow cytometry of T cells after multiple stimulations show similar levels between RASA2 KO and control-edited (CTRL) T cells (n = 4 donors, mean ± SEM, *p < 0.05 and ns is p > 0.05 for two-sided Wilcoxon test, shape denotes donor). Source data
Extended Data Fig. 7
Extended Data Fig. 7. Metabolic fitness of RASA2 KO T cells.
a, Volcano plot (log2 fold change on the x-axis, -log10 of unadjusted p-value from a two-tailed Wald test on the y-axis) of RNA-Seq analysis following five stimulations compared between RASA2 KO or control-edited T cells (n = 3 independent donors). We note TCF7 is lower in RASA2 KO compared to control-edited T cells and that multiple mitochondrial fitness genes are up-regulated following RASA2 deletion. b, MFI as measured by flow cytometry for mitochondrial mass (Mitotracker green) and for mitochondrial membrane potential (MitoTracker Red CMXRos) in NY-ESO-1 TCR-T and CD19 CAR-T cells after repetitive cancer target stimulations. (n = 2 human donors, each in 2 technical replicates for CAR-T cells and in 5 technical replicates for TCR-T cells, *p < 0.05 and ***p < 0.001 for two-sided Wilcoxon test). c, Oxygen consumption rate (OCR) traces as measured by seahorse mitochondrial stress test for CD19 TRAC-CAR T cells that were not exposed to cancer cells (rested) or were exposed to six repeated tumor stimulations. Arrows mark addition of each inhibitor: oligomycin 1.5 μM (Olig.), FCCP 1μM, rotenone/antimycin A 0.5 μM (R/A) (n = 6 technical replicates for one representative T cell donor of two, lines are mean ± SD). d, Average basal OCR, maximal OCR, and spare respiratory capacity (SRC) levels in seahorse mito stress test (n = 6 technical replicates for one representative T cell donor of two, lines are mean ± SD, *p < 0.05 and **p < 0.01 for two-sided Wilcoxon test). e, Same experiment as (d) but here showing extracellular acidification rates (ECAR). SGC = spare glycolytic capacity (n = 6 technical replicates for one representative T cell donor of two, lines are mean ± SD, **p < 0.01 for two-sided Wilcoxon test. f, OCR measurements from Seahorse substrate oxidation stress tests performed in CD19 CAR-T cells before co-culture with cancer cells or after six repeated stimulations by cancer cell targets (n = 1 human donor, with 6 technical replicates per condition, **p < 0.01, ****p < 0.0001 for one-way ANOVA test). Substrate inhibitors included 4 μM Etomoxir (XF Long Chain Fatty Acids), 2 μM BPTES (Glutamine), and 3 μM UK5099 (Glucose/Pyruvate). Source data
Extended Data Fig. 8
Extended Data Fig. 8. Ablation of RASA2 preserves cancer cell killing capacity in T cells after repeated target cancer cell exposures.
a, Cancer cell killing assay showed control-edited NY-ESO-1-specific TCR-T cells failed to control cancer cell expansion after multiple stimulations, whereas RASA2 ablation led to persistent killing capability. Cancer cell kill after 1, 3, and 6 repeated co-cultures (columns) and for a range of effector T cells to target cancer cell ratios (rows) are displayed over time (each time point in triplicates, lines are mean ± SD, lines show a fitted curve by a generalized additive model, see methods). b, Representative flow cytometry histograms showing CD19 staining in A375 cells engineered to express CD19 (A375-CD19 in cyan) compared to unperturbed A375 cells (A375-WT in red). c, Summary statistics for area under the growth curve over target A375-CD19 cells a range of effector T cells to target cell ratios after 1 and 6 repeated cancer cell exposures (n = 3 donors in duplicates, mean ± SEM, ***p < 0.001 for two-sided Wilcoxon test). d, Representative data for cancer killing assays in (c) by CD19-specific CAR-T cells after 1 and 6 repeated co-cultures for a range of effector T cells to target cancer cell ratios (rows) with target A375-CD19 melanoma cells expressing CD19. e, Representative data from one CAR-T cell donor for cancer killing assays with target Nalm6 leukemia cells (each time point in triplicates, lines are mean ± SD). f, Traces of cancer cell count over time as detected by live-cell microscopy. CD19 CAR-T cells from two donors after repetitive stimulation were co-cultured with either unperturbed target cells (A375-WT) or an isogenic cell line engineered to express CD19 (A375-CD19). No cancer cell killing is observed with either RASA2 KO or CTRL T cells in the antigen-negative condition. Lines are mean of 3 technical replicates. g, Quantification of data in (f), for the area under the growth curve (y-axis), across multiple effector T cell to target cancer cell ratios (x-axis) (n = 2 donors in triplicates, mean ± SEM, shape denotes donor). Source data
Extended Data Fig. 9
Extended Data Fig. 9. RASA2 ablation in TCR-T and CAR-T cells improves tumor control in vivo.
a, Individual subcutaneous tumor growth by caliper measurements over time in NSG mice engrafted with 1x10⁶ A375 melanoma cells and intravenously injected with 1x10⁶ NY-ESO-1-specific 1G4 TCR-T cells (n = 6 mice per group). b, Survival of mice shown in (a), exact p-value by log-rank test. c, Individual tumor growth by bioluminescence (BLI as total flux) measurements over time in NSG mice engrafted with 0.3x10⁶ Nalm6 leukemia cells (engineered to express NY-ESO-1), and injected with 0.5x10⁶ NY-ESO-1-specific TCR-T cells (n = 5 mice for RASA2 group, n = 4 for CTRL group). d, Survival of mice from two cohorts shown in (c), exact p-value by log-rank test. e, Flow cytometry data showing levels of CD19-CAR positivity in T cells immediately prior to injection into Nalm6 bearing mice. Percentages were used to adjust with the goal of equal numbers of CAR+ T cells per mouse. f, Individual tumor growth over time in NSG mice engrafted with 0.5x10⁶ Nalm6 leukemia cells and injected with 0.2x10⁶ CD19-specific CAR-T cells (n = 7 mice per group). g, Tumor progression in (f) was monitored using bioluminescent imaging (BLI). h, Individual tumor growth over time in a cohort of NSG mice bearing Nalm6 leukemia cells injected with CD19-specific CAR-T from an independent human blood donor (n = 8 mice per group for control-edited CAR-T cells and n = 7 mice per group for RASA2 edited CAR-T cells). i, Survival of mice shown in (h), exact p-value by log-rank test. j, CD4+ and CD8+ percentage composition of CAR-T cells isolated from the bone marrow of Nalm6-bearing mice day 7 and 16 after CAR-T cell infusion (Day 7: n = 5 for CTRL, n = 6 for RASA2, Day 16: n = 6 for CTRL, n = 6 for RASA2, error bars mean ± SEM, *p < 0.05, **p < 0.01, ***p < 0.001 and ****p < 0.0001 for two-sided Wilcoxon test). k, Differentiation status based on CD45RA and CD62L staining for CAR-T cells from cohort in (j) (n = 6 per group, mean ± SEM, *p < 0.05, **p < 0.01 for two-sided Wilcoxon test, TSCM = CD62L+CD45RA+, TCM = CD62L+CD45RA-, TEM = CD62L-CD45RA-, TEMRA/EFF = CD62L-CD45RA+). l, Gating for input mixed cell populations for in vivo competition assay. T cells are first gated on CAR+ cells, then EGFR+/- populations. Input mix 1 and mix 2 each had ~50/50% AAVS1 and RASA2 KO CAR-T cells, with the EGFRt on opposite populations in each mix for identification. m, Percentage of the two different mixed CAR-T cell populations after isolation from bone marrow at days 7 and 16 post infusion into Nalm6-bearing mice and stained for CAR and EGFRt markers to determine CTRL/RASA2 KO CAR-T cells percentages in vivo (Day 7: n = 6 for CTRL, n = 6 for RASA2, Day 16: n = 6 for CTRL, n = 6 for RASA2, error bars are mean ± SEM, *p < 0.05 and **p < 0.01 for two-sided Wilcoxon test). Source data
Extended Data Fig. 10
Extended Data Fig. 10. RASA2 ablation boosts CAR-T cell resistance to tumor rechallenge and has a similar safety profile to control CAR-T cells.
a, BLI values for Nalm6-bearing mice which received 0.2x10⁶ TRAC CAR-T cells after first Nalm6 injection without any rechallenge injections, and for Nalm6-bearing mice which received 0.2x10⁶ CAR-T cells and then 3 further Nalm6 rechallenge injections (1x10⁶ Nalm6/injection). Mice were monitored for tumor burden (BLI levels) and survival. n = 7 mice per arm in each cohort. Arrows depict Nalm6 leukemia rechallenges. b, mean ± SEM for BLI values shown in (a) until first mouse death in the control cohort, *p < 0.05 and **p < 0.01 for two-sided unpaired Student’s t-test. c, Survival analysis for the leukemia rechallenge model of the cohort shown in (a,b). Exact p-value by log-rank test. d, Body weights over time for mice receiving CAR-T cells with no tumor cells engrafted (mean ± SEM, n = 2 human donors and 3 mice per group). e, White blood cell (WBC; K/μL), hemoglobin (Hb; g/dL), and platelet (Plt; x104 K/μL) counts for mice receiving only CAR-T cells (n = 2 human donors, n = 3 mice per group), as well as mice receiving tumor-clearing CAR-T cell infusions (n = 1 human donor, n = 6 mice per group, box shows the upper and lower quartiles, horizontal line is median). f, Representative H&Es from bone marrow and spleens of mice from (e). Sternal bone marrows (40X magnification) showed tri-lineage hematopoiesis, which was similar in all animals. As expected, tumor naive NSG mice had few cells of lymphoid appearance in their white pulp (seen here as few mononuclear cells surrounding a blood vessel) (spleens at 20X magnification). The red pulp of NSG mice contains abundant erythroid precursors (seen here as numerous cells with dense dark nuclei) as well as megakaryocytes. In comparison to the cancer naive NSG mice, the red pulp and white pulp of recipient animals were largely similar; in some mice, independent of group, some expansion of splenic white pulp was seen, consistent with engrafted lymphoid cells. Of importance, recipients of RASA2 KO TRAC CAR-T cells did not show evidence of increased lymphoid infiltrates in comparison to matched recipients of TRAC CAR-T control cells. g, Scheme of EphA2-specific CAR retroviral vectors. 4H5: scFV recognizing EphA2. SSR: short spacer region. h. Summary data for CAR expression in gene targeted T-cells as measured by flow cytometry (n = 10 for CTRL, n = 14 for RASA2). i, Western Blot analysis of RASA2 expression RASA2 KO EphA2-CAR T cells compared to T cells treated with non-targeting guide (CTRL). Two guide RNAs targeting RASA2 were tested. j, Individual BLI traces from main Fig. 4m, using both RASA2 sgRNAs for one donor, and sgRNA1 for the second donor. k, Mice without detectable BLI from experiment in (j) were re-challenged with a second intraperitoneal (i.p.) tumor injection with 1x10⁶ LM7-ffLuc tumor cells on Day 174. Graphs show quantitative bioluminescence imaging (total flux). Dotted vertical line indicates the second tumor injection. Source data

Comment in

Similar articles

Cited by

  • Leveraging CRISPR gene editing technology to optimize the efficacy, safety and accessibility of CAR T-cell therapy.
    Lei T, Wang Y, Zhang Y, Yang Y, Cao J, Huang J, Chen J, Chen H, Zhang J, Wang L, Xu X, Gale RP, Wang L. Lei T, et al. Leukemia. 2024 Dec;38(12):2517-2543. doi: 10.1038/s41375-024-02444-y. Epub 2024 Oct 25. Leukemia. 2024. PMID: 39455854 Free PMC article. Review.
  • Multiplexed engineering and precision gene editing in cellular immunotherapy.
    Biederstädt A, Manzar GS, Daher M. Biederstädt A, et al. Front Immunol. 2022 Nov 22;13:1063303. doi: 10.3389/fimmu.2022.1063303. eCollection 2022. Front Immunol. 2022. PMID: 36483551 Free PMC article. Review.
  • Targeting overexpressed antigens in glioblastoma via CAR T cells with computationally designed high-affinity protein binders.
    Xia Z, Jin Q, Long Z, He Y, Liu F, Sun C, Liao J, Wang C, Wang C, Zheng J, Zhao W, Zhang T, Rich JN, Zhang Y, Cao L, Xie Q. Xia Z, et al. Nat Biomed Eng. 2024 Dec;8(12):1634-1650. doi: 10.1038/s41551-024-01258-8. Epub 2024 Oct 17. Nat Biomed Eng. 2024. PMID: 39420062
  • Germline mutations in a G protein identify signaling cross-talk in T cells.
    Ham H, Jing H, Lamborn IT, Kober MM, Koval A, Berchiche YA, Anderson DE, Druey KM, Mandl JN, Isidor B, Ferreira CR, Freeman AF, Ganesan S, Karsak M, Mustillo PJ, Teo J, Zolkipli-Cunningham Z, Chatron N, Lecoquierre F, Oler AJ, Schmid JP, Kuhns DB, Xu X, Hauck F, Al-Herz W, Wagner M, Terhal PA, Muurinen M, Barlogis V, Cruz P, Danielson J, Stewart H, Loid P, Rading S, Keren B, Pfundt R, Zarember KA, Vill K, Potocki L, Olivier KN, Lesca G, Faivre L, Wong M, Puel A, Chou J, Tusseau M, Moutsopoulos NM, Matthews HF, Simons C, Taft RJ, Soldatos A, Masle-Farquhar E, Pittaluga S, Brink R, Fink DL, Kong HH, Kabat J, Kim WS, Bierhals T, Meguro K, Hsu AP, Gu J, Stoddard J, Banos-Pinero B, Slack M, Trivellin G, Mazel B, Soomann M, Li S, Watts VJ, Stratakis CA, Rodriguez-Quevedo MF, Bruel AL, Lipsanen-Nyman M, Saultier P, Jain R, Lehalle D, Torres D, Sullivan KE, Barbarot S, Neu A, Duffourd Y, Similuk M, McWalter K, Blanc P, Bézieau S, Jin T, Geha RS, Casanova JL, Makitie OM, Kubisch C, Edery P, Christodoulou J, Germain RN, Goodnow CC, Sakmar TP, Billadeau DD, Küry S, Katanaev VL, Zhang Y, Lenardo MJ, Su HC. Ham H, et al. Science. 2024 Sep 20;385(6715):eadd8947. doi: 10.1126/science.add8947. Epub 2024 Sep 20. Science. 2024. PMID: 39298586 Free PMC article.
  • UniCAR T-Cell Potency-A Matter of Affinity between Adaptor Molecules and Adaptor CAR T-Cells?
    Boutier H, Loureiro LR, Hoffmann L, Arndt C, Bartsch T, Feldmann A, Bachmann MP. Boutier H, et al. Int J Mol Sci. 2024 Jun 30;25(13):7242. doi: 10.3390/ijms25137242. Int J Mol Sci. 2024. PMID: 39000348 Free PMC article.

References

    1. Fesnak AD, June CH, Levine BL. Engineered T cells: the promise and challenges of cancer immunotherapy. Nat. Rev. Cancer. 2016;16:566–581. - PMC - PubMed
    1. Anderson KG, Stromnes IM, Greenberg PD. Obstacles posed by the tumor microenvironment to T cell activity: a case for synergistic therapies. Cancer Cell. 2017;31:311–325. - PMC - PubMed
    1. Wei J, et al. Targeting REGNASE-1 programs long-lived effector T cells for cancer therapy. Nature. 2019;576:471–476. - PMC - PubMed
    1. Su S, et al. CRISPR–Cas9 mediated efficient PD-1 disruption on human primary T cells from cancer patients. Sci Rep. 2016;6:20070. - PMC - PubMed
    1. Stadtmauer EA, et al. CRISPR-engineered T cells in patients with refractory cancer. Science. 2020;367:eaba7365. - PMC - PubMed

MeSH terms