. 2022 Sep;609(7927):590-596.
doi: 10.1038/s41586-022-05125-x. Epub 2022 Aug 24.

Phosphorylation of muramyl peptides by NAGK is required for NOD2 activation

Affiliations

Phosphorylation of muramyl peptides by NAGK is required for NOD2 activation

Che A Stafford et al. Nature. 2022 Sep.

Abstract

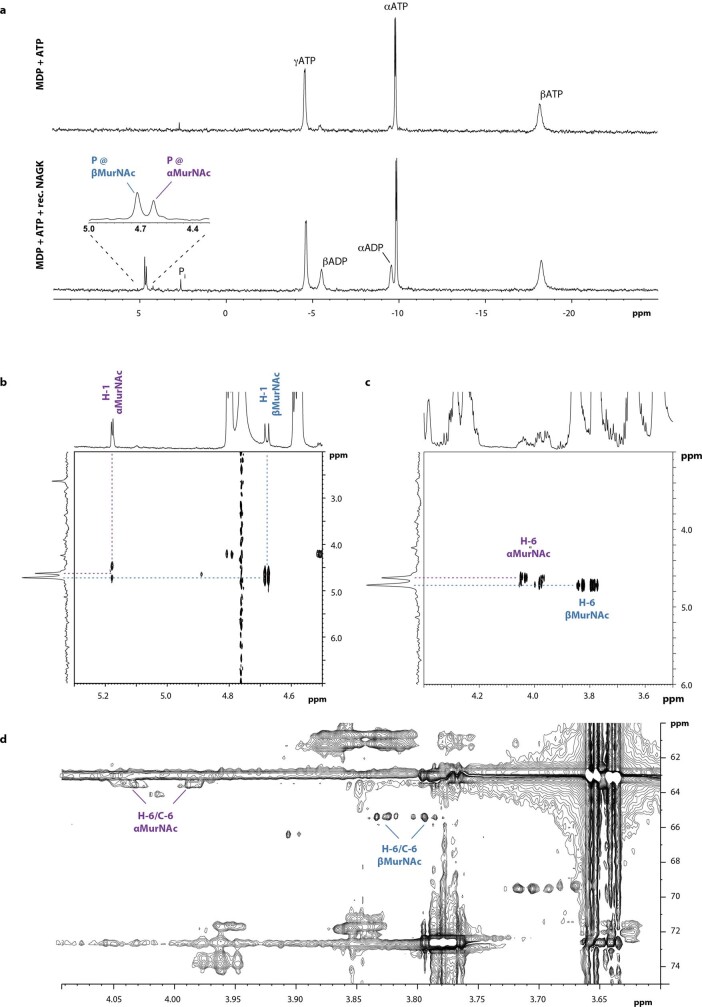
Bacterial cell wall components provide various unique molecular structures that are detected by pattern recognition receptors (PRRs) of the innate immune system as non-self. Most bacterial species form a cell wall that consists of peptidoglycan (PGN), a polymeric structure comprising alternating amino sugars that form strands cross-linked by short peptides. Muramyl dipeptide (MDP) has been well documented as a minimal immunogenic component of peptidoglycan1-3. MDP is sensed by the cytosolic nucleotide-binding oligomerization domain-containing protein 24 (NOD2). Upon engagement, it triggers pro-inflammatory gene expression, and this functionality is of critical importance in maintaining a healthy intestinal barrier function5. Here, using a forward genetic screen to identify factors required for MDP detection, we identified N-acetylglucosamine kinase (NAGK) as being essential for the immunostimulatory activity of MDP. NAGK is broadly expressed in immune cells and has previously been described to contribute to the hexosamine biosynthetic salvage pathway6. Mechanistically, NAGK functions upstream of NOD2 by directly phosphorylating the N-acetylmuramic acid moiety of MDP at the hydroxyl group of its C6 position, yielding 6-O-phospho-MDP. NAGK-phosphorylated MDP-but not unmodified MDP-constitutes an agonist for NOD2. Macrophages from mice deficient in NAGK are completely deficient in MDP sensing. These results reveal a link between amino sugar metabolism and innate immunity to bacterial cell walls.


Conflict of interest statement

The authors declare no competing interests.

Figures

Fig. 1
Fig. 1. A haploid genetic screen reveals regulators of NOD2.
a, CRISPR engineering of the IL1B locus, resulting in an endogenous in-frame fusion of IL-1B and mScarlet separated by a self-cleaving peptide (T2A). b, Flow cytometry analysis of IL-1B–mScarlet induction following L18-MDP stimulation of wild-type (WT) and NOD2-knockout (KO) clonal KBM-7-IL-1BmScarlet cells for 16 h. Data shown for one representative of three independent experiments, indicating gating strategy. AU, arbitrary units. c, Flow cytometry analysis of IL-1B–mScarlet induction in wild-type and NOD2-knockout clonal KBM-7-IL-1BmScarlet cells stimulated as indicated for 16 h. Data are mean ± s.e.m of n = 3 independent biological samples. Two-way ANOVA with Šídák’s multiple-comparisons test. Ctrl, control. d, Genetic screen showing positive and negative regulators of IL-1B–mScarlet in cells treated with L18-MDP for 16 h. For each gene (dots), the ratio of the mutation frequency in cells with high IL-1B–mScarlet expression versus those with low IL-1B–mScarlet expression is plotted against the combined number of unique mutations identified in both populations of cells. Genes enriched for mutations are shown in black (two-sided Fisher’s exact test, false discovery rate (FDR)-corrected P value (Padj) < 0.05). Genes encoding known components of the NOD2 pathway (orange dots) and the novel regulator NAGK (blue dot) are indicated. e, Model of the NOD2 signalling pathway. Products of genes identified in the screen are highlighted in orange; REL and SPI1 are not depicted. ****P < 0.0001. Source data
Fig. 2
Fig. 2. NAGK is required for MDP recognition.
a, NAGK expression in wild-type and NAGK-knockout KBM-7-IL-1BmScarlet cells by immunoblot (representative of three independent experiments). b, Wild-type and NAGK-knockout KBM-7-IL-1BmScarlet cells were treated with the indicated doses of L18-MDP (left), MDP (middle) or C12-ie-DAP (right) for 16 h. Data are mean ± s.e.m of n = 3 independent biological samples. Two-way ANOVA with Šídák’s multiple-comparisons test. c, NAGK expression in wild-type and NAGK-knockout NOD2-expressing HEK cells (representative of two independent experiments). d,e, Wild-type and NAGK-knockout NOD2-expressing HEK cells were stimulated as indicated and IL-8 production was determined by enzyme-linked immunosorbent assay (ELISA) after 16 h. Data are mean ± s.e.m of n = 3 independent biological samples. Two-way ANOVA with Šídák’s multiple-comparisons test. f, RIPK2 ubiquitination and NF-κB and MAPK activation markers following L18-MDP stimulation in wild-type or NAGK-knockout THP-1 cells. Ubiquitinated proteins were enriched by pulldown of endogenous ubiquitinated protein bound to an immobilized ubiquitin-associated domain (UbA). Blot represents one of three biological replicates. g, Heat map of significantly varying phosphosites in wild-type or NAGK-knockout THP-1 cells treated with L18-MDP for 1 h (Student’s t-test FDR < 0.05, z-scores). Fisher’s exact t-test of significantly upregulated phosphosites upon L18-MDP treatment (P < 0.02; enrichment terms include Gene Ontology Biological Process, KEGG and Gene Ontology Molecular Function). h, Schematic representation of the NOD2–NanoBiT luminescence assay. i, Immunoblot of NAGK expression in wild-type and NAGK-knockout HEK 239T cells (representative of two independent experiments). Cells were transfected with the constructs shown in h and treated with L18-MDP for 24 h. NOD2 dimerization was measured as the luminescence induced by NOD2–NOD2 interaction, normalized with the positive and negative controls. Data are mean ± s.e.m of n = 3 independent biological samples. Two-way ANOVA with Šídák’s multiple-comparisons test. Source data
Fig. 3
Fig. 3. NAGK phosphorylates MDP to render it NOD2-agonistic.
a, Left, GlcNAc conversion to GlcNAc-6-phosphate in a NAGK-dependent manner. Right, MDP. Sugar moieties are indicated in blue. The arrow indicates the phosphorylatable OH group in the C6 position of MDP. b, In vitro kinase reactions with indicated ligands were analysed by TLC. The dashed line indicates where the image has been cropped to remove superfluous lanes. The image represents three biological replicates. c, Wild-type KBM-7-IL-1BmScarlet cells were treated with indicated doses MDP (l-d isomer), MDP (l-l isomer) or 6-amino MDP for 16 h. Data are mean ± s.e.m of n = 4 independent biological samples. Two-way ANOVA with Dunnett’s multiple-comparisons test. Comparisons were made with untreated controls, which are depicted three times for comparability. d, Extracted ion chromatogram of the MDP in vitro kinase reaction without (left) or with (middle) recombinant NAGK (rNAGK). Chromatographic peaks indicate either MDP (black) or 6-phospho-MDP (purple). Right, corresponding mass spectra from these peaks, with theoretical and detected mass. e, Schematic of the cellular L18-MDP, MDP and 6-phospho-MDP content analysis by LC–MS. f, L18-MDP, MDP and 6-phospho-MDP analysis in wild-type and NAGK-knockout KBM-7 cells treated with L18-MDP. Tukey-style box plots of n = 6 independent biological samples. Two-way ANOVA with Šídák’s multiple-comparisons test. Stim, stimulated. g, IL-1B–mScarlet expression in wild-type, NAGK-knockout or NOD2-knockout KBM-7-IL-1BmScarlet cells that were untreated or stimulated with MDP, pMDP or TNF in digitonin buffer for 16 h. Data are mean ± s.e.m of n = 3 independent biological samples. Two-way ANOVA (MDP and pMDP) or one-way ANOVA (TNF) with Dunnett’s multiple-comparisons test. Comparisons to untreated controls (MDP or pMDP) or wild-type cells (TNF). h,i, NF-kB reporter activity in wild-type or NAGK-deficient NOD2-expressing HEK cells stimulated with MDP or pMDP in digitonin buffer as indicated for 16 h. Data are mean ± s.e.m of n = 3 independent biological samples. A four-parameter dose-response curve was fitted to calculate half-maximal effective concentration (EC50). Source data
Fig. 4
Fig. 4. NAGK is essential for NOD2 signalling in mouse BMDMs.
a, ELISA for TNF and IL-6 production in wild-type and Nagk−/− mouse BMDMs treated stimulated as indicated for 24 h. Data are mean ± s.e.m of n = 3 independent biological samples. b, Quantitative PCR analysis of the indicated transcripts in wild-type and Nagk−/− BMDMs treated with either MDP, C12-iE-DAP or Pam3CSK4 for 5 h. Gene expression levels were normalized to Gapdh. Data are mean ± s.e.m of n = 3 independent biological samples. Two-way ANOVA on log-transformed data with Šídák’s multiple-comparisons test. c, RIPK2 ubiquitination and NF-κB and MAPK activation markers following MDP stimulation of wild-type and Nagk−/− BMDMs. Ubiquitinated proteins were enriched by pulldown of endogenous ubiquitinated protein bound to immobilized UbA. Blot represents one of three biological replicates for the wild type and presents all three Nagk−/− mice. d, Heat map of significantly varying phosphosites in wild-type BMDMs treated with MDP for 1 h (Student’s t-test FDR < 0.01, z-scores). Z-scores for these phosphosites in Nagk−/− BMDMs treated with either MDP in both genotypes treated with Pam3CSK4 for 1 h were included. All BMDM experiments were conducted under IFN𝛾-primed conditions from three mice per condition. Source data
Extended Data Fig. 1
Extended Data Fig. 1. UDP-GlcNAc biosynthesis and salvage pathway.
a, Schematic representation of the UDP-GlcNAc biosynthesis and salvage pathway (adapted from). b, Data from Fig. 1d with genes indicated in a (highlighted in orange).
Extended Data Fig. 2
Extended Data Fig. 2. NAGK is expressed in immune cells.
a, The microarray dataset Human U133A/GNF1H Gene Atlas containing 44,775 probes was used to build a gene (Pearson) correlation matrix of 7,064 most variable transcripts (σ2 > 1). All transcripts were ordered by their correlation to NAGK, and the cut-off was made at r ≥ 0.7. The remaining 113 transcripts were used to conduct the Gene Ontology analysis. b, Gene Ontology analysis. Most highly correlating genes to NAGK were used to identify over-represented biological processes. Results were plotted in order of significance as measured by the false discovery rate (FDR). Colour code from red (high significance) to violet (lower significance). The circle size indicates how many genes were found to be part of any given GO term. Fold enrichment is shown on the x-axis. c, Pairwise comparisons of NAGK and the four highest correlating genes from GO term “Granulocyte activation” with the regression line (blue) and the 95% confidence interval (light blue). Data are depicted as log2 expression values. A two tailed t-test was run on the null hypothesis that the two variables are not linearly related. No correction for multiple testing was conducted. R = Pearson correlation coefficient, p = P-value. d, Heatmap showing the expression pattern of NAGK together with genes from most enriched GO term “Granulocyte activation”. Genes in columns are clustered by Pearson correlation. Colour from blue to red shows log2 of mean intensity values.
Extended Data Fig. 3
Extended Data Fig. 3. NAGK does not impact on other NF-kB activating immune pathways.
Flow cytometry analysis of KBM-7-IL1BmScarlet WT (grey) and NAGKKO pool (dark blue) cells treated with the indicated increasing doses of Pam3CSK4, PMA, recombinant IL-1β, and TNF for 16 h. Mean ± s.e.m of n = 3 independent biological samples; two-way ANOVA with Šídák’s multiple comparisons test. **** p < 0.0001 or as indicated. Source data
Extended Data Fig. 4
Extended Data Fig. 4. NAGK is required for the NOD2 transcriptional immune response.
a, IL-8 and IP-10 production of KBM-7-IL1BmScarlet WT (grey), NAGKKO pool (dark blue) and clonal (light blue) cells that were stimulated as indicated. Mean ± s.e.m of n = 4 independent biological samples; two-way ANOVA with Dunnet’s multiple comparisons test. b, qPCR analysis of the indicated transcripts in KBM-7-IL1BmScarlet WT (grey) and NAGKKO pool (dark blue) cells treated with either MDP or iE-DAP for 4 h. Gene expression levels were normalised to the GAPDH. Mean ± s.e.m of n = 4 (n = 3 for IFIT1, CXCL10, and NAGK) independent biological samples; two-way ANOVA conducted on log-transformed data with Šídák’s multiple comparisons test. **** p < 0.0001 or as indicated. Source data
Extended Data Fig. 5
Extended Data Fig. 5. MDP detection in NOD2-expressing HEK cells, THP-1 cells and KBM-7 cells requires NAGK.
a and b, WT (grey) and NAGKKO pool (dark blue) NOD2-HEK cells were stimulated as indicated and NF-kB activity was determined after 16 h. Mean ± s.e.m of n = 3 independent biological samples; two-way ANOVA with Šídák’s multiple comparisons test. c, Immunoblotting was used to monitor NAGK levels in THP-1 WT and NAGKKO clonal cells. (representative of three independent experiments). d, IL-8 production of THP-1 WT (grey), NAGKKO clone #1 (dark blue), or clone #3 (light blue) cells was monitored following the treatment with the indicated stimuli. Mean ± s.e.m of n = 3 independent biological samples; two-way ANOVA with Dunnett’s multiple comparisons test. **** p < 0.0001 or as indicated. e, Immunoblotting was used to monitor RIPK2 ubiquitination and NF-kB and MAPK activation markers following L18-MDP stimulation in KBM-7-IL1BmScarlet WT and NAGKKO pool or clonal cells. Ubiquitinated proteins were enriched via pulldown of endogenous ubiquitinated protein bound to an immobilised ubiquitin-associated domain (UBA). Blot represents one of three biological replicates. Source data
Extended Data Fig. 6
Extended Data Fig. 6. NAGK does not impact on MTP uptake.
a and b, Top left schematic representation of the Fluorescein labelled molecules. Bar charts and histograms represent flow cytometry analysis of KBM-7-IL1BmScarlet WT (grey) and NAGKKO pool (dark blue) cells treated with either MTP-Fluorescein (a) or lac-TP-Fluorescein (b) for indicated time periods, MFI represents median fluorescence intensity. Bar chart represents the mean ± s.e.m of n = 3 independent biological samples; two-way ANOVA with Šídák’s multiple comparisons test. Histograms represent one experiment shown of three independent experiments. The same untreated samples were used for the MTP-Fluorescein and lac-TP-Fluorescein uptake experiments as controls. **** p < 0.0001 or as indicated. Source data
Extended Data Fig. 7
Extended Data Fig. 7. The kinase activity of NAGK is required upstream of NOD2.
a, Immunoblot indicating NAGK levels in KBM-7-IL1BmScarlet WT or NAGKKO pool cells reconstituted with WT or D107V NAGK. b, Flow cytometry analysis of these cells either untreated (light grey) or treated with doxycycline (dark grey) followed by MDP (dark blue) or C12-iE-DAP (green) stimulation for 16 h. Mean ± s.e.m of n = 3 independent biological samples; two-way ANOVA with Dunnett’s multiple comparisons test. **** p < 0.0001 or as indicated. Source data
Extended Data Fig. 8
Extended Data Fig. 8. NAGK phosphorylates MDP at position O-6.
2 mM MDP and 5 mM ATP were incubated for 2 h at 37 °C in 50 mM HEPES pH 8.0, 10 mM MgCl2, and 50 mM NaCl, with or without the addition of 3.6 µM recombinant NAGK (rec. NAGK). a, 1D 31P NMR analysis showed the appearance of new signals (δP = 4.72, 4.62 ppm) deriving from monophosphates in presence of rec. NAGK, with a simultaneous, partial conversion of ATP to ADP (Fig. 3a). b, By 2D 1H,31P-HMQC-TOCSY, the signal at δP 4.72 ppm could be assigned as the phosphate of the β-anomer, the signal at δP 4.62 ppm as the one of the α-anomer of phospho-MDP, respectively. The depicted region displays the cross correlations of the respective 31P signal to the corresponding anomeric proton (H-1) of the MurNAc residue (α: δH 5.18, d, 3JH1,H2 = 3.6 Hz; β: δH 4.68, d, 3JH1,H2 = 8.5 Hz). The attachment position of phosphates was determined by 2D 1H,31P-HMQC (c) and 2D 1H,13C-HSQCdept (d). For the α-anomer, the phosphate shows cross correlations to protons at δH 4.06-4.03 and 4.00-3.97 ppm, respectively, which are bound to a carbon at δC 63.5 ppm. For the β-anomer, the phosphate shows cross correlations to protons at δH 3.84-3.81 and 3.81-3.78 ppm, respectively, which are bound to a carbon at δC 65.4 ppm. This clearly indicates the phosphorylation at position O-6 of MDP.
Extended Data Fig. 9
Extended Data Fig. 9. 6-phospho-MDP stimulates NAGK-deficient cells.
a and b, NOD2-HEK cells either WT or NAGK-deficient were treated with either MDP or pMDP in digitonin buffer at the indicated concentrations and IL-8 production was measured after 16 h by ELISA. Mean ± s.e.m of n = 3 independent biological samples. Source data
Extended Data Fig. 10
Extended Data Fig. 10. NAGK is conserved from prokaryotes to eukaryotes and Drosophila NAGK can operate upstream of NOD2.
a, Cladogram of NAGK proteins across the indicated species in a clockwise fashion (bacteria, archaea, rotifera, nematoda, platyhelminthes, arthropoda, echinodermata, mollusca, porifera, radiata, amphibia, fish, reptilia, aves, and mammalia). Species harbouring NOD2 protein sequences are marked in dark pink. Blue dots represent locations of specific species of interest. b, KBM-7-IL1BmScarlet WT, NAGKKO pool cells or NAGKKO pool cells reconstituted with doxycycline-inducible drosophila NAGK (CG6218) were stimulated as indicated. After 16 h they were analysed by flow cytometry or their supernatant was assessed for IP-10 production. Mean ± s.e.m of n = 4 independent biological samples; two-way ANOVA with Dunnett’s multiple comparisons test. **** p < 0.0001 or as indicated. Source data

Similar articles

Cited by

References

    1. Ellouz F, Adam A, Ciorbaru R, Lederer E. Minimal structural requirements for adjuvant activity of bacterial peptidoglycan derivatives. Biochem. Biophys. Res. Commun. 1974;59:1317–1325. doi: 10.1016/0006-291X(74)90458-6. - DOI - PubMed
    1. Merser C, Sinay P, Adam A. Total synthesis and adjuvant activity of bacterial peptidoglycan derivatives. Biochem. Biophys. Res. Commun. 1975;66:1316–1322. doi: 10.1016/0006-291X(75)90503-3. - DOI - PubMed
    1. Kotani S, Watanabe Y, Kinoshita F, Shimono T, Morisaki I. Immunoadjuvant activities of synthetic N-acetyl-muramyl-peptides or -amino acids. Biken J. 1975;18:105–111. - PubMed
    1. Girardin SE, et al. Nod2 is a general sensor of peptidoglycan through muramyl dipeptide (MDP) detection. J. Biol. Chem. 2003;278:8869–8872. doi: 10.1074/jbc.C200651200. - DOI - PubMed
    1. Caruso R, Lo BC, Nunez G. Host–microbiota interactions in inflammatory bowel disease. Nat. Rev. Immunol. 2020;20:411–426. doi: 10.1038/s41577-019-0268-7. - DOI - PubMed

MeSH terms

Substances