

Deep belief rule based photovoltaic power forecasting method with interpretability
- PMID: 36002587
- PMCID: PMC9402627
- DOI: 10.1038/s41598-022-18820-6
Deep belief rule based photovoltaic power forecasting method with interpretability
Abstract
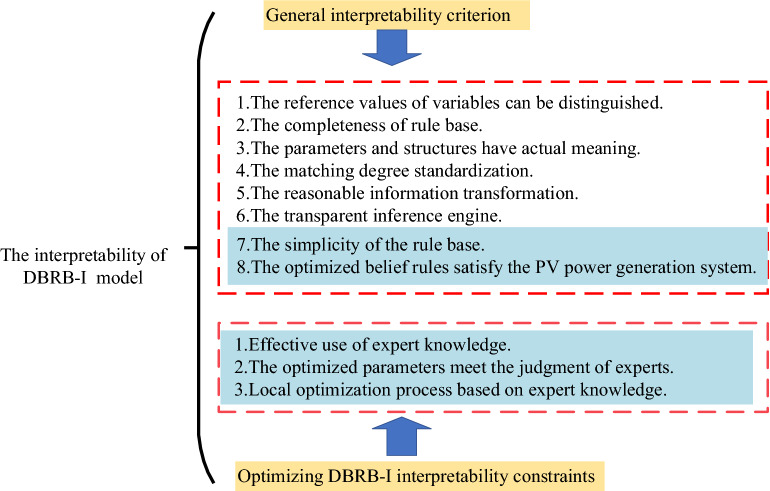
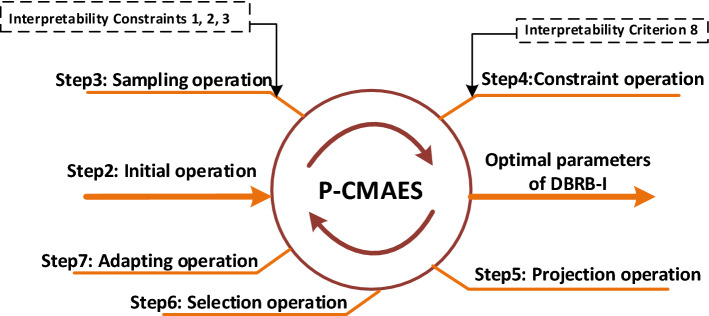
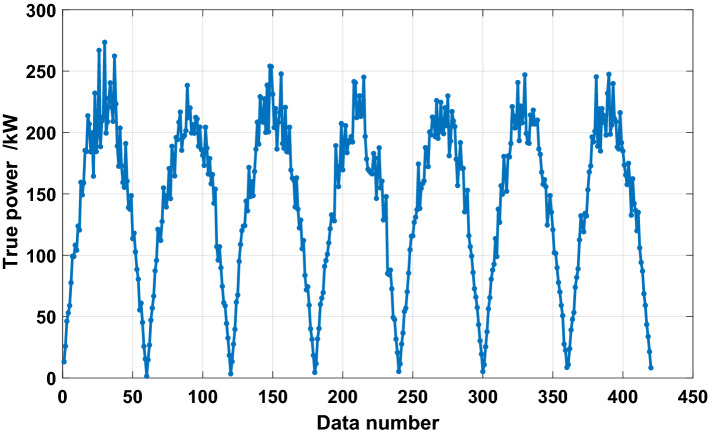
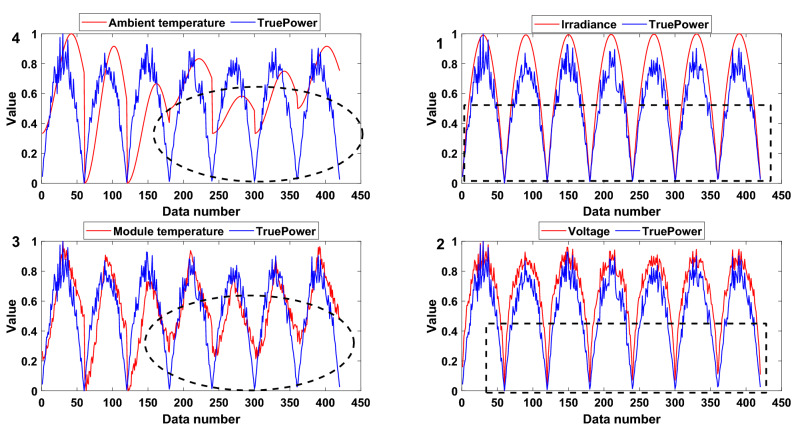
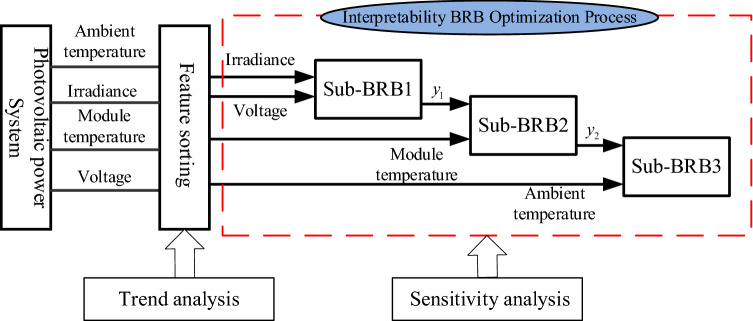
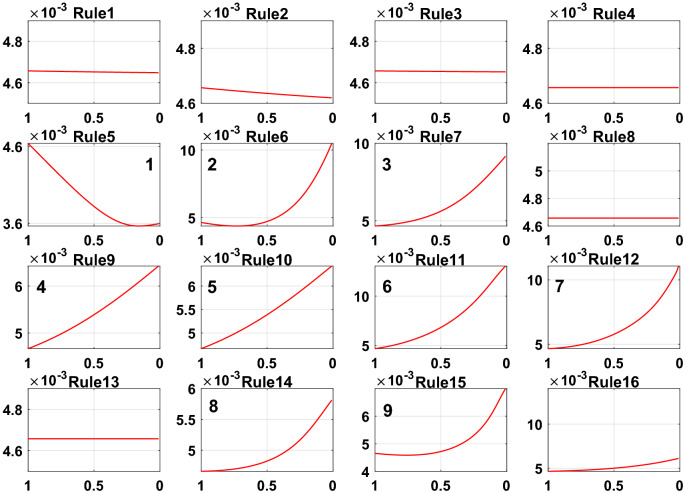
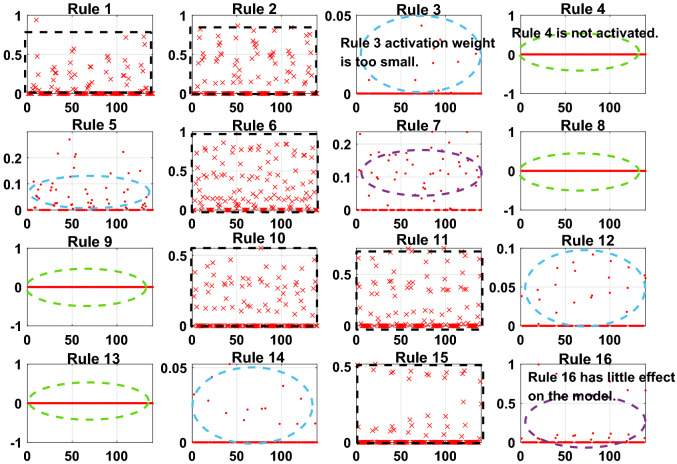
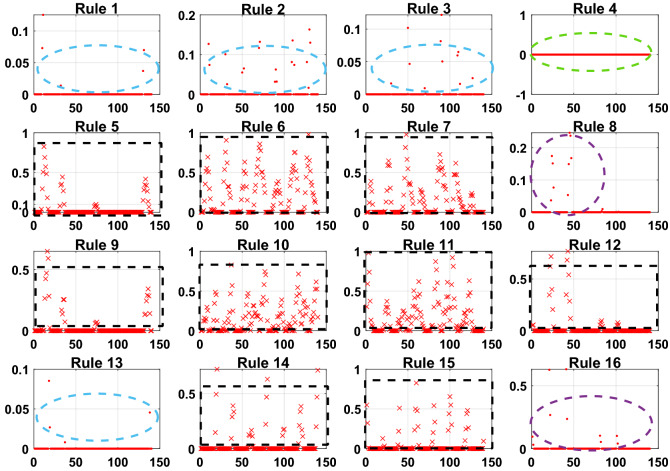
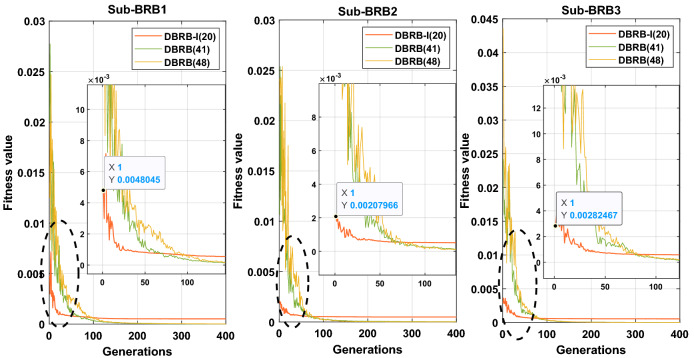
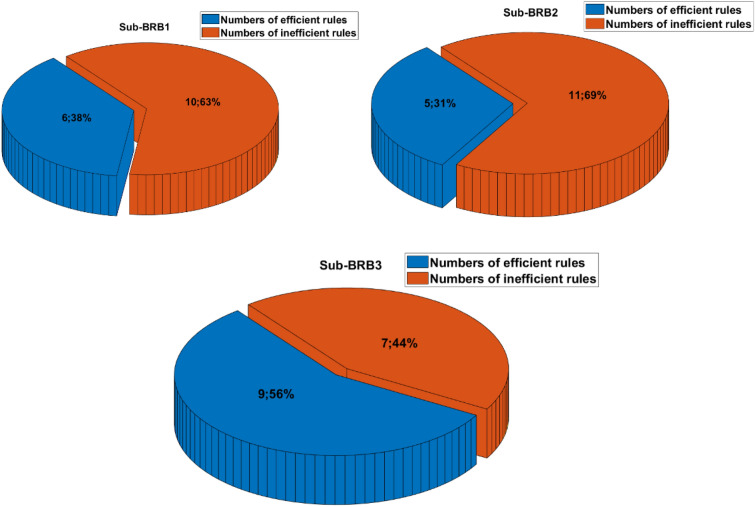
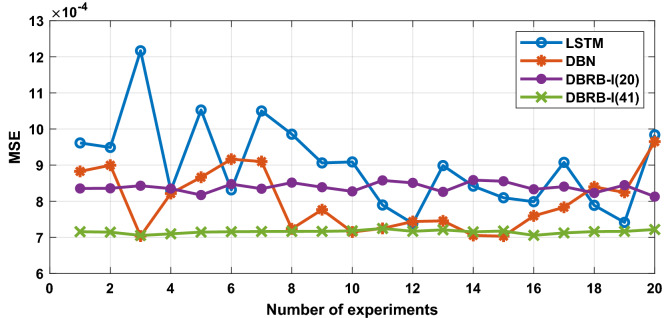
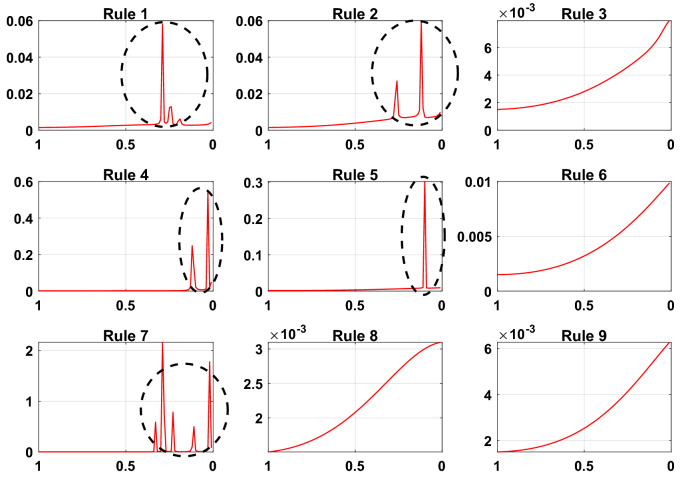
Accurate prediction of photovoltaic (PV) output power is of great significance for reasonable scheduling and development management of power grids. In PV power generation prediction system, there are two problems: the uncertainty of PV power generation and the inexplicability of the prediction result. The belief rule base (BRB) is a rule-based modeling method and can deal with uncertain information. Moreover, the modeling process of BRB has a certain degree of interpretability. However, rule explosion and the inexplicability of the optimized model limit the modeling ability of BRB in complex systems. Thus, a PV output power prediction model is proposed based on a deep belief rule base with interpretability (DBRB-I). In the DBRB-I model, the deep BRB structure is constructed to solve the rule explosion problem, and inefficient rules are simplified by a sensitivity analysis of the rules, which reduces the complexity of the model. Moreover, to ensure that the interpretability of the model is not destroyed, a new optimization method based on the projection covariance matrix adaptation evolution strategy (P-CMA-ES) algorithm is designed. Finally, a case study of the prediction of PV output power is conducted to illustrate the effectiveness of the proposed method.
© 2022. The Author(s).
Conflict of interest statement
The authors declare no competing interests.
Figures


Similar articles
-
An interpretable model for stock price movement prediction based on the hierarchical belief rule base.Heliyon. 2023 May 26;9(6):e16589. doi: 10.1016/j.heliyon.2023.e16589. eCollection 2023 Jun. Heliyon. 2023. PMID: 37260876 Free PMC article.
-
A complex system health state assessment method with reference value optimization for interpretable BRB.Sci Rep. 2024 Jan 28;14(1):2334. doi: 10.1038/s41598-024-52829-3. Sci Rep. 2024. PMID: 38282169 Free PMC article.
-
A novel optimization method for belief rule base expert system with activation rate.Sci Rep. 2023 Jan 11;13(1):584. doi: 10.1038/s41598-023-27498-3. Sci Rep. 2023. PMID: 36631493 Free PMC article.
-
A deep belief rule base-based fault diagnosis method for complex systems.ISA Trans. 2024 Jul;150:77-91. doi: 10.1016/j.isatra.2024.05.019. Epub 2024 May 16. ISA Trans. 2024. PMID: 38777695
-
A novel belief rule base expert system with interval-valued references.Sci Rep. 2022 Apr 26;12(1):6786. doi: 10.1038/s41598-022-10636-8. Sci Rep. 2022. PMID: 35474315 Free PMC article.
Cited by
-
A new interpretable belief rule base model with step-length convergence strategy for aerospace relay health state assessment.Sci Rep. 2023 Aug 28;13(1):14066. doi: 10.1038/s41598-023-41305-z. Sci Rep. 2023. PMID: 37640774 Free PMC article.
-
An interpretable model for stock price movement prediction based on the hierarchical belief rule base.Heliyon. 2023 May 26;9(6):e16589. doi: 10.1016/j.heliyon.2023.e16589. eCollection 2023 Jun. Heliyon. 2023. PMID: 37260876 Free PMC article.
References
-
- Wang KJ, Qi XX, Liu HD. Photovoltaic power forecasting based LSTM- convolutional network. Energy. 2020;189:116225.
-
- Antonanzas J, et al. Review of photovoltaic power forecasting. Sol. Energy. 2016;136:78–111.
-
- Eseye AT, Zhang JH, Zheng DH. Short-term photovoltaic solar power forecasting using a hybrid Wavelet-PSO-SVM model based on SCADA and Meteorological information. Renewable Energy. 2017;118:357–367.
-
- Halabi LM, Mekhilef S, Hossain M. Performance evaluation of hybrid adaptive neuro-fuzzy inference system models for predicting monthly global solar radiation. Appl. Energy. 2018;213:47–261.
-
- Chen XY, Du Y, Lim EG, Wen HQ, Jiang L. Sensor network based PV power nowcasting with spatio-temporal preselection for grid-friendly control. Appl. Energy. 2019;255:113760.
Grants and funding
- 202010231009/the innovation practice project of college students in Heilongjiang Province
- 202110231024/the innovation practice project of college students in Heilongjiang Province
- 202110231155/the innovation practice project of college students in Heilongjiang Province
- 2020M683736/the Postdoctoral Science Foundation of China
- LH2021F038/the Natural Science Foundation of Heilongjiang Province of China
LinkOut - more resources
Full Text Sources
