

Differential proteomic analysis of plasma-derived exosomes as diagnostic biomarkers for chronic HBV-related liver disease
- PMID: 36002595
- PMCID: PMC9402575
- DOI: 10.1038/s41598-022-13272-4
Differential proteomic analysis of plasma-derived exosomes as diagnostic biomarkers for chronic HBV-related liver disease
Abstract
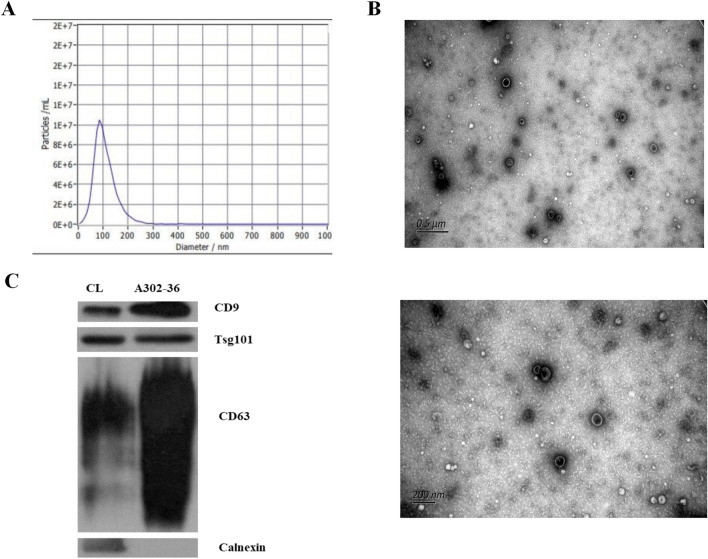
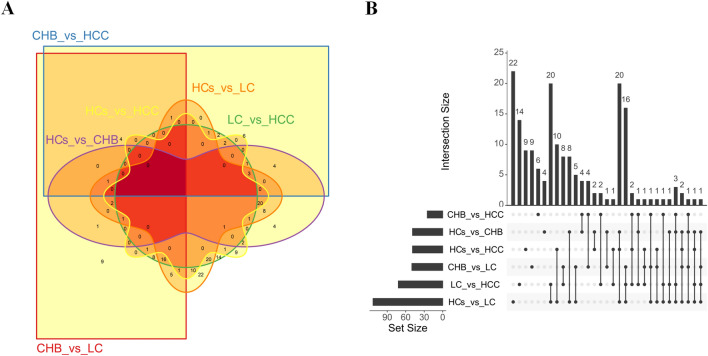
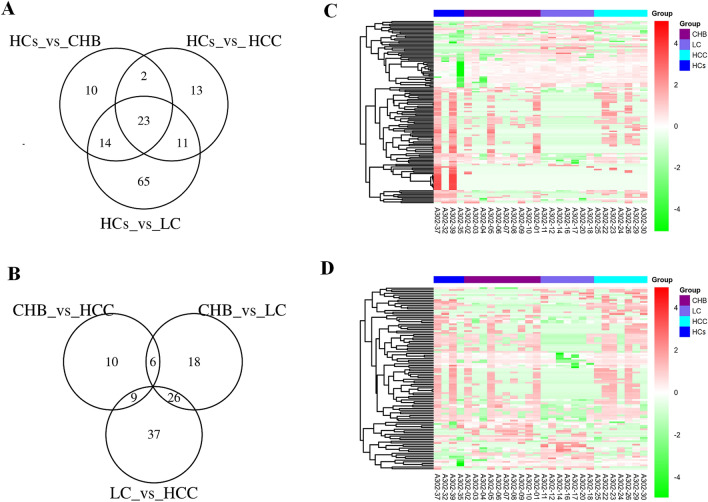
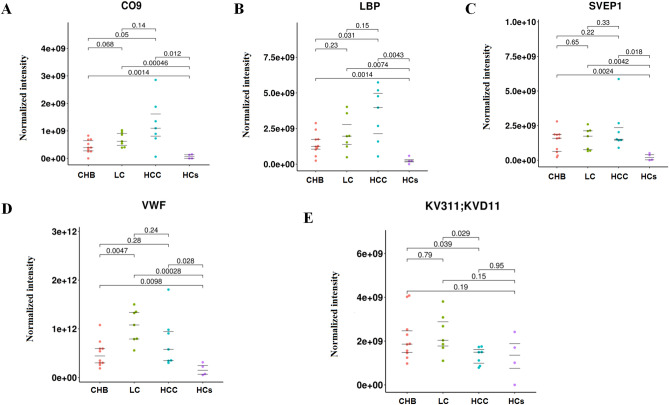
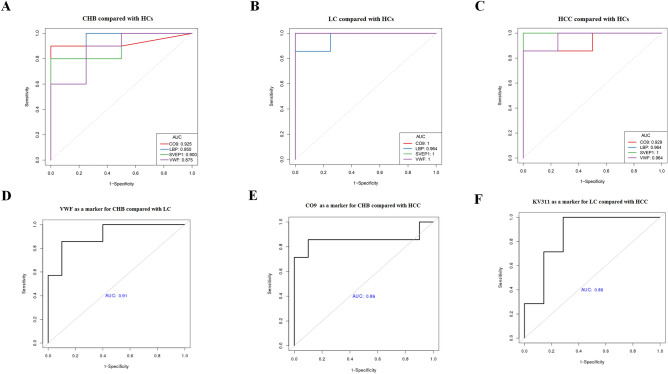
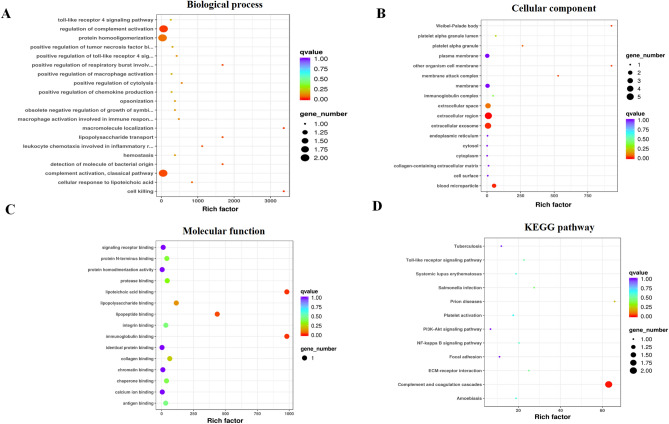
Hepatitis B virus (HBV) infection is still a major public health problem worldwide. We aimed to identify new, non-invasive biomarkers for the early diagnosis of chronic HBV-related diseases, reveal alterations in the progression of chronic hepatitis B (CHB), liver cirrhosis (LC), and hepatocellular carcinoma (HCC). Here, exosomes were isolated and characterized through size exclusion chromatography and nanoparticle tracking analysis. Profiles of differentially expressed proteins (DEPs) were analyzed through liquid chromatography-tandem mass spectrometry (LC-MS/MS), Gene Ontology, and Kyoto Encyclopedia of Genes and Genomes analyses. Results showed that the DEPs, including CO9, LBP, SVEP1, and VWF levels in extracellular vesicles (EVs) were significantly higher in CHB than in healthy controls (HCs). VWF expression levels in EVs were significantly lower in CHB than in those with LC. KV311 expression levels in EVs were significantly higher, whereas LBP levels were significantly lower in patients with CHB than in those with HCC. All biomarkers seemed to exhibit a high diagnostic capacity for HBV-related liver disease. Patients with HBV-induced chronic liver disease exhibit characteristic protein profiles in their EVs. Thus, serum exosomes may be used as novel, liquid biopsy biomarkers to provide useful clinical information for the diagnosis of HBV-related liver diseases at different stages.
© 2022. The Author(s).
Conflict of interest statement
The authors declare no competing interests.
Figures
Similar articles
-
The role of von Willebrand factor as a biomarker of tumor development in hepatitis B virus-associated human hepatocellular carcinoma: a quantitative proteomic based study.J Proteomics. 2014 Jun 25;106:99-112. doi: 10.1016/j.jprot.2014.04.021. Epub 2014 Apr 24. J Proteomics. 2014. PMID: 24769235
-
Serum protein biomarkers for HCC risk prediction in HIV/HBV co-infected people: a clinical proteomic study using mass spectrometry.Front Immunol. 2023 Nov 10;14:1282469. doi: 10.3389/fimmu.2023.1282469. eCollection 2023. Front Immunol. 2023. PMID: 38022651 Free PMC article.
-
Promoting effect of hepatitis B virus on the expressoin of phospholipase A2 group IIA.Lipids Health Dis. 2017 Jan 11;16(1):5. doi: 10.1186/s12944-016-0400-7. Lipids Health Dis. 2017. PMID: 28077172 Free PMC article.
-
What can we learn from hepatitis B virus clinical cohorts?Liver Int. 2015 Jan;35 Suppl 1:91-9. doi: 10.1111/liv.12716. Liver Int. 2015. PMID: 25529093 Review.
-
Natural history of chronic hepatitis B: what exactly has REVEAL revealed?Liver Int. 2012 Oct;32(9):1333-41. doi: 10.1111/j.1478-3231.2012.02805.x. Epub 2012 Apr 17. Liver Int. 2012. PMID: 22510145 Review.
Cited by
-
Battle of the biopsies: Role of tissue and liquid biopsy in hepatocellular carcinoma.J Hepatol. 2024 Mar;80(3):515-530. doi: 10.1016/j.jhep.2023.11.030. Epub 2023 Dec 15. J Hepatol. 2024. PMID: 38104635 Free PMC article. Review.
-
Role of Extracellular Vesicles in Liver Diseases.Life (Basel). 2023 Apr 30;13(5):1117. doi: 10.3390/life13051117. Life (Basel). 2023. PMID: 37240762 Free PMC article. Review.
-
Extracellular Vesicles in Viral Liver Diseases.Viruses. 2024 Nov 17;16(11):1785. doi: 10.3390/v16111785. Viruses. 2024. PMID: 39599900 Free PMC article. Review.
-
Extracellular Vesicles as Biomarkers in Chronic Hepatobiliary Diseases: An Overview of Their Interplay.Int J Mol Sci. 2025 Jun 30;26(13):6333. doi: 10.3390/ijms26136333. Int J Mol Sci. 2025. PMID: 40650114 Free PMC article. Review.
-
The emerging Janus face of SVEP1 in development and disease.Trends Mol Med. 2023 Nov;29(11):939-950. doi: 10.1016/j.molmed.2023.08.002. Epub 2023 Sep 4. Trends Mol Med. 2023. PMID: 37673700 Free PMC article. Review.
References
-
- World Health Organization. [Fact sheet]. Hepatitis B. https://www.who.int/news-room/fact-sheets/detail/hepatitis-b/, (2020).
Publication types
MeSH terms
Substances
LinkOut - more resources
Full Text Sources
Medical
Research Materials
Miscellaneous
