Fluid dynamic assessment of positive end-expiratory pressure in a tracheostomy tube connector during respiration
- PMID: 36002620
- PMCID: PMC9402408
- DOI: 10.1007/s11517-022-02649-2
Fluid dynamic assessment of positive end-expiratory pressure in a tracheostomy tube connector during respiration
Abstract
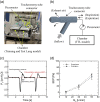
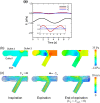
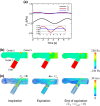
High-flow oxygen therapy using a tracheostomy tube is a promising clinical approach to reduce the work of breathing in tracheostomized patients. Positive end-expiratory pressure (PEEP) is usually applied during oxygen inflow to improve oxygenation by preventing end-expiratory lung collapse. However, much is still unknown about the geometrical effects of PEEP, especially regarding tracheostomy tube connectors (or adapters). Quantifying the degree of end-expiratory pressure (EEP) that takes patient-specific spirometry into account would be useful in this regard, but no such framework has been established yet. Thus, a platform to assess PEEP under respiration was developed, wherein three-dimensional simulation of airflow in a tracheostomy tube connector is coupled with a lumped lung model. The numerical model successfully reflected the magnitude of EEP measured experimentally using a lung phantom. Numerical simulations were further performed to quantify the effects of geometrical parameters on PEEP, such as inlet angles and rate of stenosis in the connector. Although sharp inlet angles increased the magnitude of EEP, they cannot be expected to achieve clinically reasonable PEEP. On the other hand, geometrical constriction in the connector can potentially result in PEEP as obtained with conventional nasal cannulae.
Keywords: Computational biomechanics; Computational fluid dynamics; Lumped lung model; Positive end-expiratory pressure (PEEP); Tracheostomy tube connector.
© 2022. International Federation for Medical and Biological Engineering.
Conflict of interest statement
The authors declare no competing interests.
Figures


Similar articles
-
The effects of applied vs auto-PEEP on local lung unit pressure and volume in a four-unit lung model.Chest. 1995 Oct;108(4):1073-9. doi: 10.1378/chest.108.4.1073. Chest. 1995. PMID: 7555122
-
Relation of the static compliance curve and positive end-expiratory pressure to oxygenation during one-lung ventilation.Anesthesiology. 2001 Nov;95(5):1096-102. doi: 10.1097/00000542-200111000-00012. Anesthesiology. 2001. PMID: 11684977 Clinical Trial.
-
Safety of percutaneous dilational tracheostomy in patients ventilated with high positive end-expiratory pressure (PEEP).Intensive Care Med. 2003 Jun;29(6):944-948. doi: 10.1007/s00134-003-1656-8. Epub 2003 Feb 13. Intensive Care Med. 2003. PMID: 12589531
-
Positive end-expiratory pressure for preterm infants requiring conventional mechanical ventilation for respiratory distress syndrome or bronchopulmonary dysplasia.Cochrane Database Syst Rev. 2019 Feb 26;2(2):CD004500. doi: 10.1002/14651858.CD004500.pub3. Cochrane Database Syst Rev. 2019. PMID: 30820939 Free PMC article.
-
Use of recruitment maneuvers and high-positive end-expiratory pressure in a patient with acute respiratory distress syndrome.Crit Care Med. 2000 Apr;28(4):1210-6. doi: 10.1097/00003246-200004000-00051. Crit Care Med. 2000. PMID: 10809308 Review.
Cited by
-
Effect of modified high-flow oxygen therapy on positive end-expiratory pressure and end-expiratory lung volume based on simulated lung platform.Heliyon. 2023 Aug 12;9(8):e19119. doi: 10.1016/j.heliyon.2023.e19119. eCollection 2023 Aug. Heliyon. 2023. PMID: 37636410 Free PMC article.
References
-
- Acute Respiratory Distress Syndrome Network. Brower RG, Matthay MA, Morris A, Schoenfeld D, Thompson BT, Wheeler A. Ventilation with lower tidal volumes as compared with traditional tidal volumes for acute lung injury and the acute respiratory distress syndrome. N Engl J Med. 2000;4:1301–1308. doi: 10.1056/NEJM200005043421801. - DOI - PubMed
MeSH terms
Substances
Grants and funding
- JP19H01175/Japan Society for the Promotion of Science
- JP20H04504/Japan Society for the Promotion of Science
- hp200136/Program for Promoting Researches on the Supercomputer Fugaku (Development of personalized medical support technology based on simulation data science of whole brain blood circulation)
LinkOut - more resources
Full Text Sources

