. 2022 Sep;23(9):1379-1392.
doi: 10.1038/s41590-022-01290-3. Epub 2022 Aug 24.

Type I IFNs promote cancer cell stemness by triggering the epigenetic regulator KDM1B

Affiliations

Type I IFNs promote cancer cell stemness by triggering the epigenetic regulator KDM1B

Martina Musella et al. Nat Immunol. 2022 Sep.

Erratum in

  • Author Correction: Type I IFNs promote cancer cell stemness by triggering the epigenetic regulator KDM1B.
    Musella M, Guarracino A, Manduca N, Galassi C, Ruggiero E, Potenza A, Maccafeo E, Manic G, Mattiello L, Soliman Abdel Rehim S, Signore M, Pietrosanto M, Helmer-Citterich M, Pallocca M, Fanciulli M, Bruno T, De Nicola F, Corleone G, Di Benedetto A, Ercolani C, Pescarmona E, Pizzuti L, Guidi F, Sperati F, Vitale S, Macchia D, Spada M, Schiavoni G, Mattei F, De Ninno A, Businaro L, Lucarini V, Bracci L, Aricò E, Ziccheddu G, Facchiano F, Rossi S, Sanchez M, Boe A, Biffoni M, De Maria R, Vitale I, Sistigu A. Musella M, et al. Nat Immunol. 2024 Nov;25(11):2166. doi: 10.1038/s41590-024-01984-w. Nat Immunol. 2024. PMID: 39289560 Free PMC article. No abstract available.

Abstract

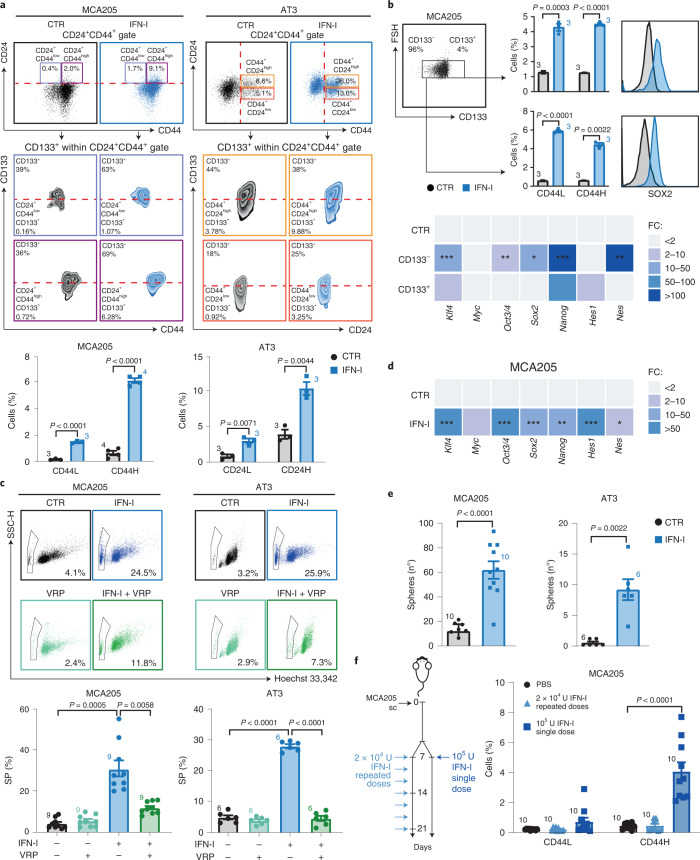
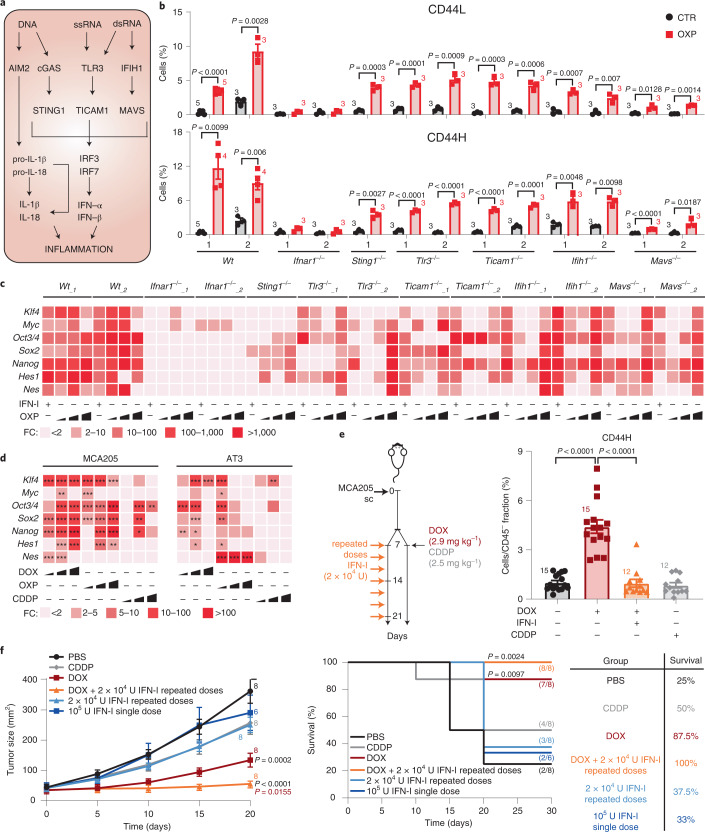
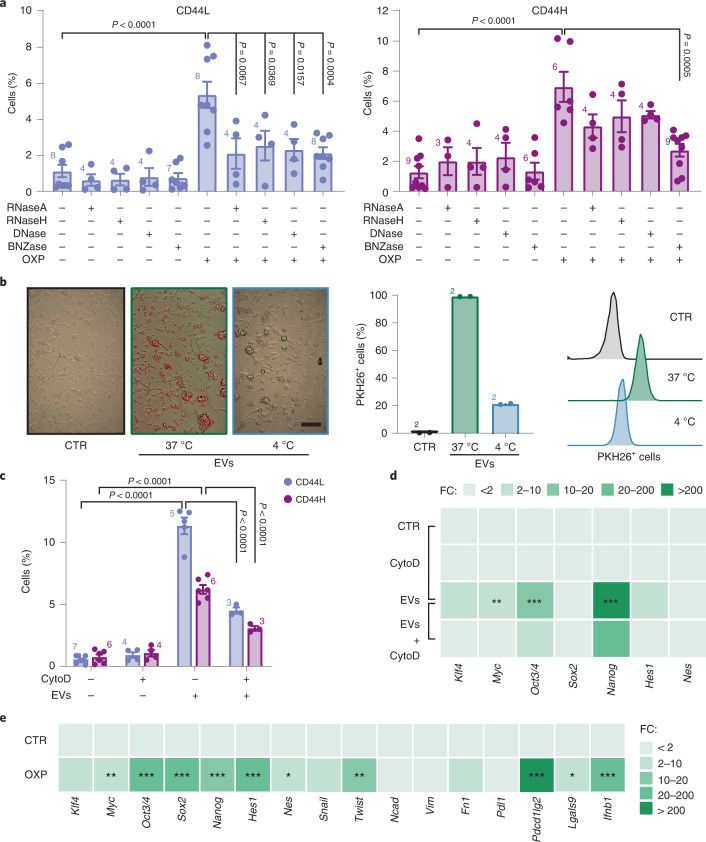
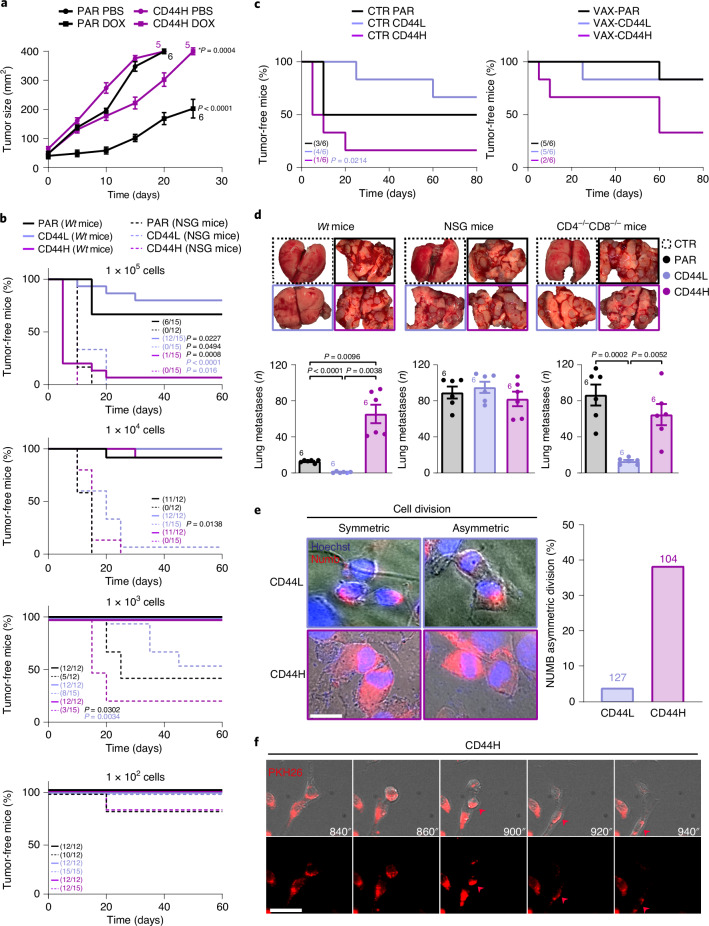
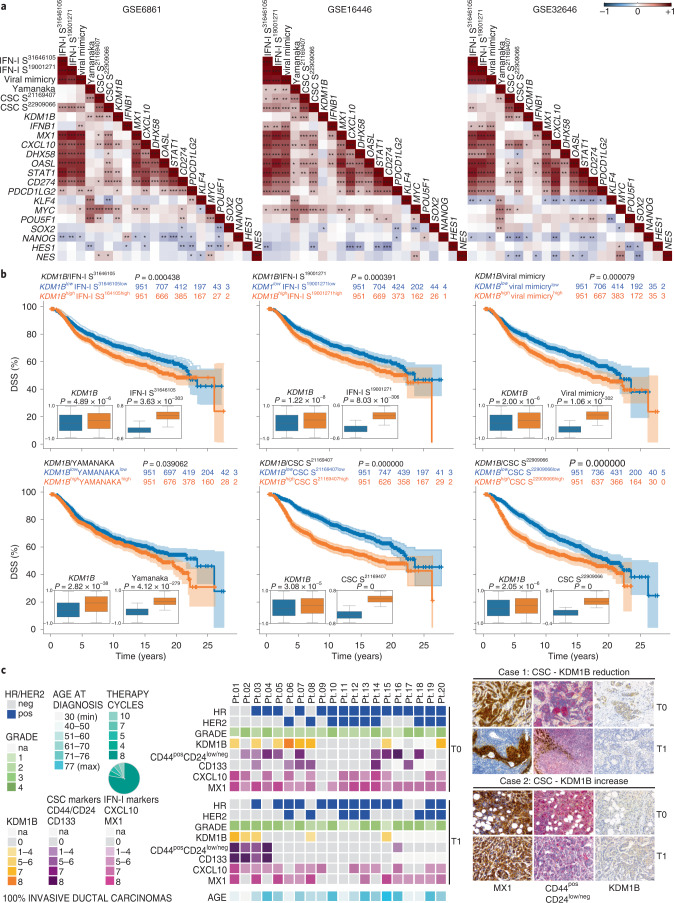
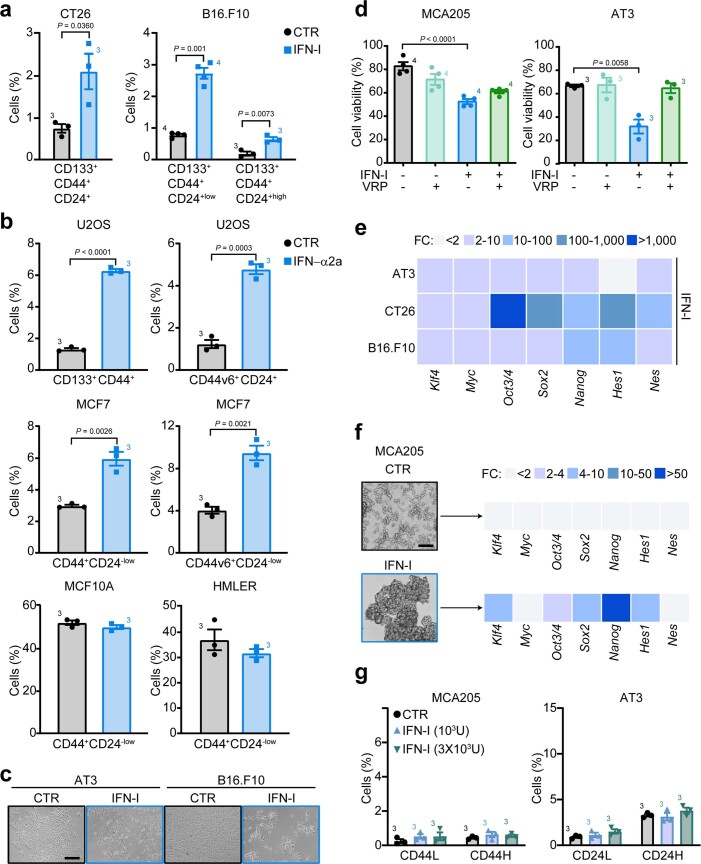
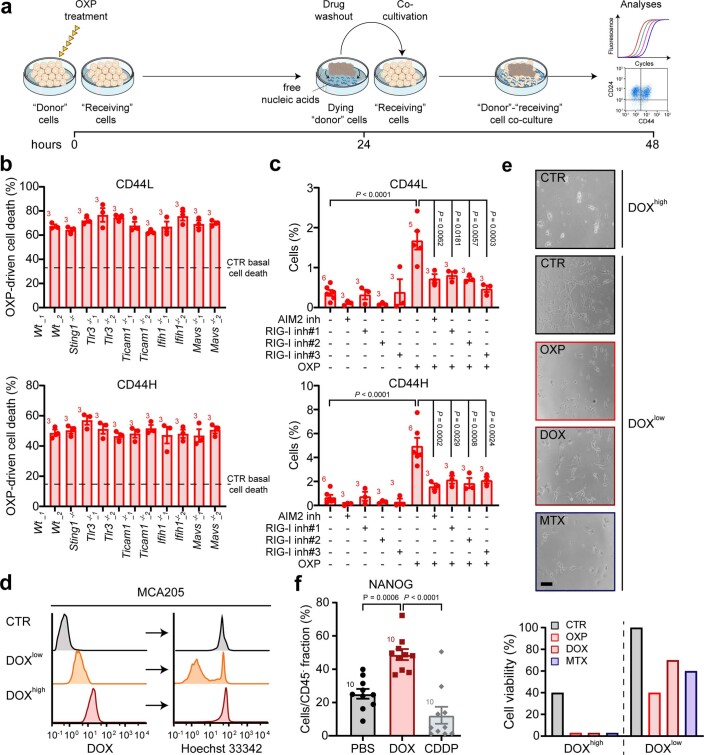
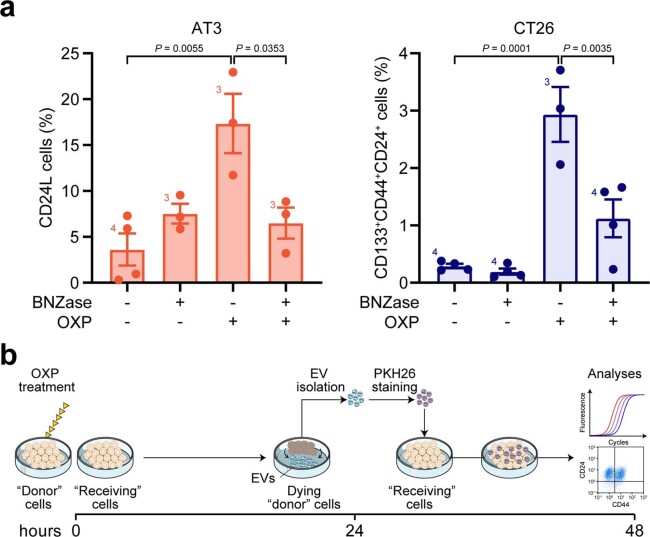
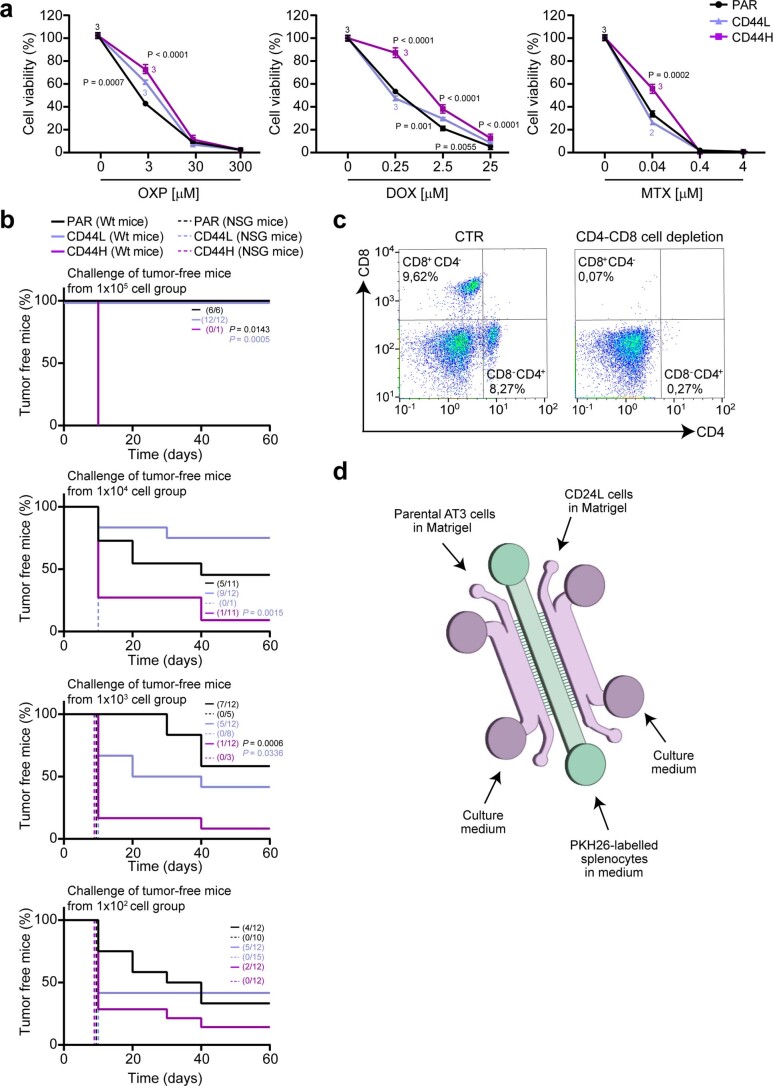
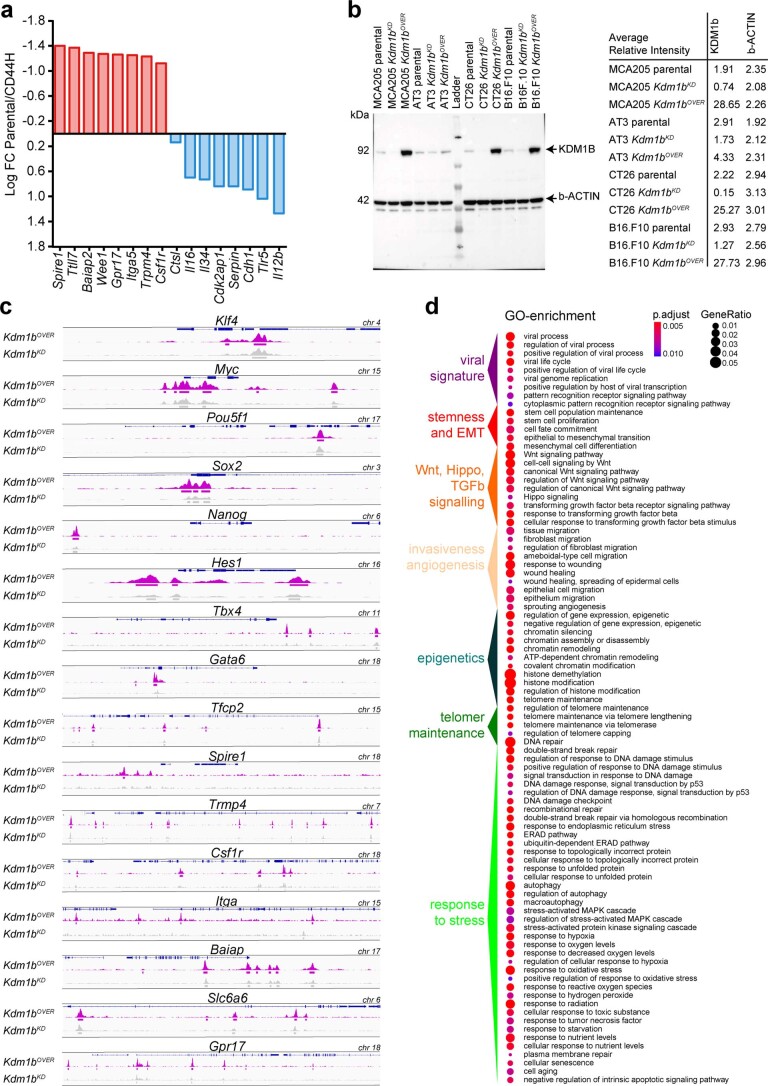
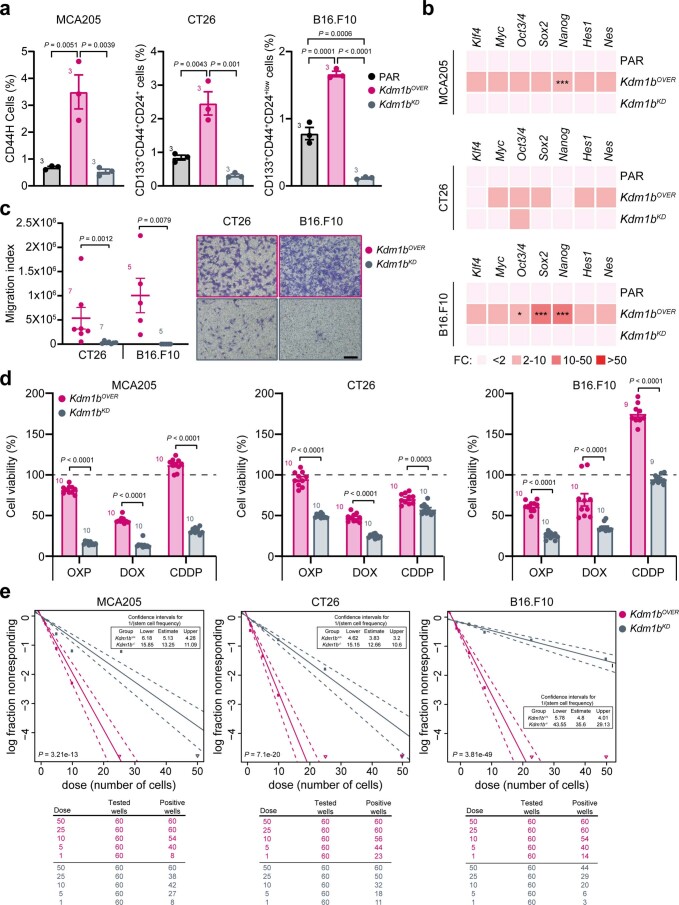
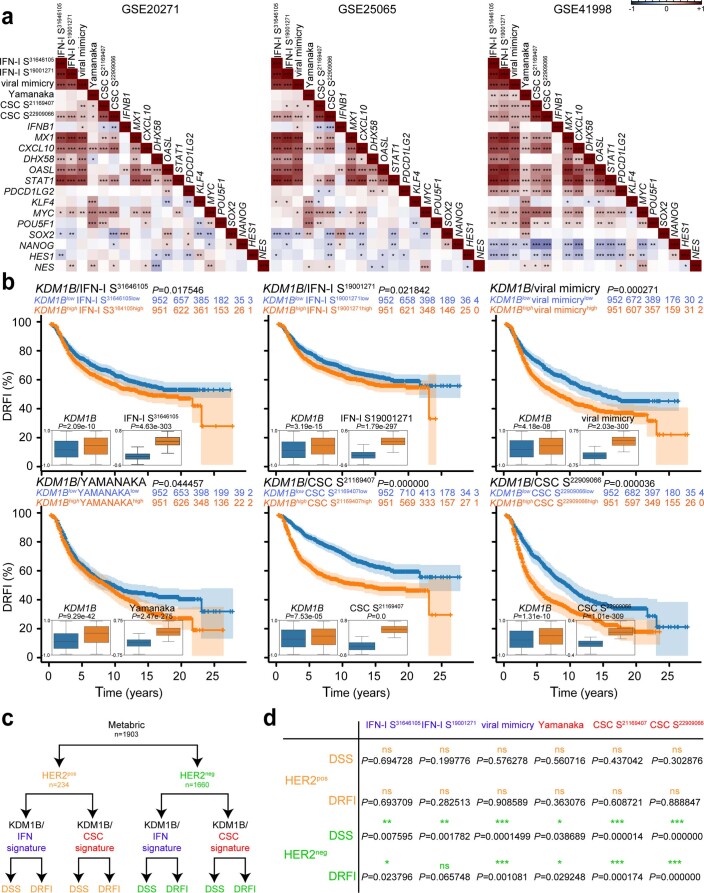
Cancer stem cells (CSCs) are a subpopulation of cancer cells endowed with high tumorigenic, chemoresistant and metastatic potential. Nongenetic mechanisms of acquired resistance are increasingly being discovered, but molecular insights into the evolutionary process of CSCs are limited. Here, we show that type I interferons (IFNs-I) function as molecular hubs of resistance during immunogenic chemotherapy, triggering the epigenetic regulator demethylase 1B (KDM1B) to promote an adaptive, yet reversible, transcriptional rewiring of cancer cells towards stemness and immune escape. Accordingly, KDM1B inhibition prevents the appearance of IFN-I-induced CSCs, both in vitro and in vivo. Notably, IFN-I-induced CSCs are heterogeneous in terms of multidrug resistance, plasticity, invasiveness and immunogenicity. Moreover, in breast cancer (BC) patients receiving anthracycline-based chemotherapy, KDM1B positively correlated with CSC signatures. Our study identifies an IFN-I → KDM1B axis as a potent engine of cancer cell reprogramming, supporting KDM1B targeting as an attractive adjunctive to immunogenic drugs to prevent CSC expansion and increase the long-term benefit of therapy.


Conflict of interest statement

The authors declare no competing interests.

Figures

Fig. 1
Fig. 1. Emergence of CSCs following IFN-I treatment.
a, Multiparametric flow cytometry analysis of the illustrated CSC surface markers in MCA205 and AT3 cells treated with mock (CTR) or IFN-I (6 × 103 U ml–1, 72 h). Representative biparametric plots and histograms showing CD133+CD24+CD44+ percentages (mean ± s.e.m. with individual data point, n = 3 and n = 4 independent experiments) are shown. For more details on gating strategies, see Supplementary Fig. 1. b, Flow cytometry analyses of CD44L and CD44H percentages (top) and qRT–PCR analyses of the reported TF (bottom) in FACS-isolated CD133 and CD133+ MCA205 cells treated as in a. Mean ± s.e.m. with individual data point, n = 3 independent experiments. qRT–PCR data are reported as mean fold change (FC) ± s.e.m. over CTR after Ppia intrasample normalization, n = 3 and n = 2 independent experiments. *P < 0.05, **P < 0.01, ***P < 0.001; for exact P values, see Supplementary Table 1. c, SP (Hoechst 33342 within propidium iodide, PI) in MCA205 and AT3 cells left untreated (black), treated with VRP (100 μM, light green), IFN-I (blue) or VRP + IFN-I (dark green). Mean ± s.e.m. with individual data point, n = 9 and n = 6 independent experiments. d, TF expression levels in IFN-I-treated MCA205 cells. Data are reported as in b, n = 3 and n = 4 independent experiments. *P < 0.05, **P < 0.01, ***P < 0.001, see Supplementary Table 1 for exact P values. e, Clonogenicity of MCA205 and AT3 cells plated in soft-agar upon treatment as in a. The number (mean ± s.e.m. and individual data point) of biologically independent samples collected over three independent experiments is shown. f, Ex vivo flow cytometry of CD44L and CD44H cells within the CD45 negative (CD45) fraction of MCA205 tumors from C57Bl/6J mice either treated with one single dose (1 × 105 U) or repeated doses (2 × 104 U) of IFN-I. Mean ± s.e.m. and individual data points for 10 mice per group from two experimental replicates. a,b,d Unpaired two-sided Student’s t-test and unpaired two-sided Student’s t-test with Welch’s correction compared with CTR. c,f, Brown–Forsythe test with Dunnet’s correction and ordinary one-way ANOVA test followed by Bonferroni’s correction. e, Unpaired two-sided Student’s t-test with Welch’s correction and two-tailed Mann–Whitney test compared with CTR. Source data
Fig. 2
Fig. 2. CSC promotion during immunogenic chemotherapy.
a, Major intracellular pathways upstream of IFN-I and inflammation. b, Multiparametric flow cytometry analysis of CSC surface markers in MCA205 derived clones with the indicated genotypes left untreated (CTR) or treated with OXP (300 μM, 24 h). The histograms represent the percentage (mean ± s.e.m. and individual data points, n = 3 independent experiments) of CD44H and CD44L cells. c,d, Quantification by qRT–PCR of the expression levels of the illustrated reprogramming factors in MCA205 clones left untreated or exposed to OXP (3, 30, 300 μM, 24 h) or IFN-I (6 × 103 U ml–1) (c) and in MCA205 and AT3 cells left untreated or administered with DOX (0.25, 2.5, 25 μM), OXP (3, 30, 300 μM) or CDDP (1.5, 15, 150 μM) (d). Data are reported as mean FC over untreated condition after intrasample normalization to the expression levels of Ppia, n = 2, for c, and n = 3, for d. *P < 0.05, **P < 0.01, ***P < 0.001, see Supplementary Table 1 for exact P values. e,f, MCA205 tumors grown in C57Bl/6J mice treated intratumorally as illustrated. Ex vivo flow cytometric analysis of the percentage of CD44L and CD44H cells in the CD45 negative (CD45) fraction are reported in e, while tumor growth curves (mean tumor surface ± s.e.m.) and the percentage of tumor-free mice are shown in f. In e, data are presented as mean ± s.e.m. along with individual data points for 15 and 12 mice from two experimental replicates; the results for CSC enrichment upon one single dose of 1 × 105 U of IFN-I or repeated doses of 2 × 104 U of IFN-I of this experiment are reported in Fig. 1f. In f, data are presented as mean ± s.e.m. along with individual data points for 6 and 8 mice from two experimental replicates. b, Unpaired two-sided Student’s t-test with Welch’s correction compared with CTR cells with each clone. d,e, Ordinary one-way ANOVA test followed by Bonferroni’s correction compared with CTR cells (d) and PBS-treated and DOX-treated mice (e). f, Ordinary two-way ANOVA test and log-rank (Mantel–Cox) test. Source data
Fig. 3
Fig. 3. Cell-to-cell horizontal transfer of nucleic acids and dedifferentiating factors during immunogenic chemotherapy.
a, Multiparametric flow cytometry analysis of CSC surface markers in receiving viable MCA205 cells upon coculturing with donor MCA205 cells left untreated or previously treated with OXP (300 µM, 24 h) alone or in combination with the indicated nucleases. Columns represent the percentage of CD44H and CD44L cells, expressed as mean ± s.e.m. and individual data points. Number of biologically independent experiments are reported. b, Fluorescence microscopy (left) or flow cytometry (right) analysis of the internalization (at 37 °C and 4 °C) of donor cell-derived, PKH26-stained EVs by receiving MCA205 cells. Scale bar, 100 μm. One representative experiment out of two is shown. c, Multiparametric flow cytometry analysis of CSC surface markers in receiving MCA205 cells cocultured with donor MCA205 cell-derived EVs in the presence of cyto D (0.5 μM). Data are expressed as mean ± s.e.m. and individual data points; number of biologically independent experiments is reported. d,e, Assessment of the expression levels of the indicated reprogramming factors by qRT–PCR in receiving MCA205 cells stimulated with donor MCA205 cell-derived EVs alone or in the presence of cyto D, as before (d) and inside EVs (e). Data are reported as mean FC ± s.e.m. over control conditions, n = 2 and n = 3, for d, n = 2, n = 3, n = 4, n = 6, n = 7, n = 9 and n = 10 for e, independent experiments, after intrasample normalization to Ppia expression levels. *P < 0.05, **P < 0.01, ***P < 0.001, see Supplementary Table 1 for exact P values. See also Extended Data Fig. 3. a,c,d, Ordinary one-way ANOVA test followed by Bonferroni’s correction. e, Unpaired two-sided Student’s t-test. Source data
Fig. 4
Fig. 4. Functional characterization of CSCs induced during immunogenic chemotherapy.
a, Tumor growth of PAR and CD44H MCA205 cells in C57Bl/6J mice either PBS- or DOX (2.9 mg kg–1)-treated. Growth curves show the mean tumor surface ± s.e.m. in one representative experiment out of two. Number of biologically independent mice and P values for DOX-treated CD44H versus DOX-treated PAR cells (purple) and DOX versus PBS treatments in PAR cells (black) are shown. See Supplementary Table 1 for exact P values, and Extended Data Fig. 4a. b, In vivo evaluation of the tumorigenicity of PAR, CD44H and CD44L MCA205 cells in C57Bl/6J (Wt) or NSG mice at the indicated dose. The percentage of tumor-free mice out of 12 and 15 mice per group from two experimental replicates is shown. Tumor-free mice from this experiment were rechallenged as reported in Extended Data Fig. 4b. c, In vivo evaluation of the vaccination potential of MCA205 cells. CTR or PAR MCA205 cells treated with 25 µM DOX (vaccination/VAX condition) were inoculated in the flank of C57Bl/6J mice. Seven days later animals were challenged with 1 × 105 PAR, CD44H or CD44L MCA205 in the other flank. The percentage of tumor-free mice out of six biologically independent mice per group in CTR and VAX conditions is shown. d, In vivo evaluation of the metastatic potential of parental or ICD–CSC MCA205 injected in the tail vein of C57Bl/6J mice, NSG mice or C57Bl/6J depleted of CD4 and CD8 cells. Representative macroscopic observation and quantification (mean ± s.e.m. and individual data points, n = 6 biologically independent mice per group) of the number of lung metastases 15 days post injection are reported. See also Extended Data Fig. 4c. e,f, Immunofluorescence analysis of cell divisions in FACS-isolated CD44H and CD44L MCA205 cells upon NUMB staining (e) and videomicroscopy analysis of cell divisions in FACS-isolated CD44H upon PKH26 staining (f, scale bar, 20 µm). In e, the percentage of asymmetric divisions upon image analysis quantification of the fluorescent signal in the two daughter cells is reported (n = 100, pool of three independent experiments, scale bar, 5 µm). a, Ordinary two-way repeated measures (RM) ANOVA test followed by Bonferroni’s correction. b,c, log-rank (Mantel–Cox) test. d, Ordinary one-way ANOVA test followed by Bonferroni’s correction. Source data
Fig. 5
Fig. 5. Phenotypic and functional profiling of IFN–CSC immunogenicity.
a, Flow cytometry analysis of proliferation rate of CFSE-stained CD8+ OT-1 T cells stimulated with PAR or CD44H OVA-expressing cells. The histograms represent the FC (mean ± s.e.m. and individual data points, n = 3 independent experiments) of nonproliferating CFSE+highCD8+ cells. b, Flow cytometry analysis of CD45 OVA-expressing PAR and CD44H cell resistance to CD8+ OT-1-mediated killing. The histograms represent the FC (mean ± s.e.m. and individual data points, n = 3 independent experiments) of dying PI+CD45 cells. c, Multiparametric flow cytometry analysis of the indicated IC molecules in MCA205 or AT3 cells. Data are presented as mean ± s.e.m. and individual data points, with number of biologically independent samples collected over three independent experiments reported. d, Flow cytometry analysis of TIM3 in CD8+ tumor-infiltrating lymphocytes from MCA205-derived tumor grafts 15 days post in vivo treatment with PBS, DOX (2.9 mg kg–1), or CDDP (2.5 mg kg–1). Data are presented as mean ± s.e.m. and independent data points for 15 mice per group from three experimental replicates. e, Quantification of released chemokines in supernatants from MCA205 and AT3 cells by Luminex Multiplex Assay. One representative experiment out of two is shown. fi, Time-lapse analysis of H-2Kb splenocyte migration towards PAR and CD24L AT3 cells in microfluidic devices. Plots in (f) represent individual splenocyte trajectories towards target cancer cells (black spots) upon time-lapse recording. Quantification of interaction times between individual splenocytes and PAR or CD24L ICD–CSCs are shown in g, see also Supplementary Videos 1–4. Pictures of splenocytes in competition microfluidic devices (scale bar, 100 μm) and quantification of splenocytes migrated towards PAR or CD24L ICD–CSCs are shown in h and i. Data are expressed as mean ± s.e.m. and individual data points; number of biologically independent samples collected over three (f,g) and two (h,i) independent experiments is reported. See also Extended Data Fig. 4. ac, Unpaired two-sided Student’s t-test and unpaired two-sided Student’s t-test followed by Welch’s correction. d,f,g, Two-tailed Mann–Whitney test compared with PBS (d) and CTR (f,g). i, Ordinary two-way RM ANOVA test followed by Bonferroni’s correction. Source data
Fig. 6
Fig. 6. IFN-I-driven chromatin remodeling.
ad, ATAC–seq (ac) and RNA-seq (d) analysis in PAR or CD44H MCA205 cells. Heatmap illustrating global open (O) or closed (C) genes and representative gene subgroups in PAR/P and CD44H/H are shown in a, representative Kdm1b loci within CPOH group in b, TF binding motifs enriched more than twofold in PAR (black) or CD44H (purple) cells (x-axis, TF motif enrichment log FC in target/nontarget cells; y-axis, significance enrichment level) in c, and GO network analysis of upregulated (red) and downregulated (blue) genes in CD44H cells (nodes, enriched GO terms, node size, false discovery rate-adjusted enrichment P value (q value)) in d. e, Multiparametric flow cytometry analysis showing CD44H cell percentages upon OXP or OXP + TCP. Mean ± s.e.m. and individual data points. Number of biologically independent samples collected over two independent experiments is reported. f, Schematic experimental protocol of in vivo KDM1B inhibition and multiparametric flow cytometry analysis of CD44H and CD8+TIM3+ percentages in tumors from mice upon DOX or DOX + TCP treatment. Mean ± s.e.m. and individual data points for 12 and 15 mice per group from three experimental replicates. g, In vivo MCA205 tumor growth control in mice treated as illustrated. Tumor growth curves (mean tumor surface ± s.e.m. for 15 and 16 mice per group from three experimental replicates) and tumor-free mice percentages are reported. h, Ex vivo multiparametric flow cytometry analysis of CD44H percentages in PAR and Kdm1b-overexpressing (Kdm1bOVER) MCA205-derived tumors. Mean ± s.e.m. and individual data points for 12 mice per group from two experimental replicates. ik, In vivo evaluation of Kdm1bOVER and Kdm1b-depleted (Kdm1bKD) MCA205 metastatic potential (i), DOX-based therapeutic response (j) and tumorigenicity (k) in C57Bl/6J (ik) and NSG (k) mice. Mean ± s.e.m. and individual data points for 6 mice per group from two experimental replicates (i, j), and for 12 and 6 mice per group from two experimental replicates (k). See also Extended Data Figs. 5 and 6. c, One-sided binomial test. e, Ordinary one-way ANOVA test with Bonferroni’s correction. f, Kruskal–Wallis test with Dunn’s multiple comparisons. g,k,j, Ordinary two-way RM ANOVA test with Bonferroni’s correction (g) and log-rank (Mantel–Cox) test (g,k). h, Two-tailed Mann–Whitney test compared with PAR. i, Unpaired two-sided Student’s t-test with Welch’s correction. Source data
Fig. 7
Fig. 7. Correlation between KDM1B, stemness signature and IFN-I signatures in BC patients.
a, Spearman correlations between expression score of KDM1B and the reported IFN-I related metagenes, stem-related reprogramming factors, IFN-I signatures and stemness signatures from microarray data of three publicly available cohorts of BC patients treated with neoadjuvant anthracycline-based chemotherapy. *P < 0.05, **P < 0.01, ***P < 0.001; see Supplementary Table 2 for exact correlation and P values and Extended Data Fig. 7a for other datasets. b, Kaplan–Meier plots depicting the disease-specific survival (DSS) in BC patients from the METABRIC cohort stratified according to risk behavior and boxplots reporting the expression levels of KDM1B and the illustrated stemness or IFN-I signatures across the two groups. P value was calculated using P Cox, log-rank (Mantel–Cox). P values <0.05 were considered statistically significant. The relative expression of the indicated genes and signatures is reported as mean ± s.e.m. from 1,903 patients. For statistics of boxplots see Supplementary Table 3. The correspondent distant relapse-free incidence is reported in Extended Data Fig. 7b. c, IHC analysis of 20 paraffin-embedded paired BC biopsies at T0 (diagnosis) and T1 (surgery) using antibodies to KDM1B, MX1, CXCL10, CD44 + CD24 and CD133. Representative IHC images from sections of two representative patients with reduced (one patient out of four) and increased (one patient out of three) KDM1B/CSC marker score are reported on the right (scale bar, 30 μm). A heatmap reporting relevant information regarding tumor grade, the mutational status of the illustrated genes and the Allred score for all analyzed markers is reported on the left. See also Extended Data Fig. 7 and Supplementary Table 4. na, not available. a, Two-sided Spearman’s rho. Source data
Extended Data Fig. 1
Extended Data Fig. 1. Type I interferon (IFN-I)-mediated enrichment of putative cancer stem cells (CSCs).
(a,b) Multiparametric flow cytometry analysis of the indicated CSC surface markers in CT26 colon carcinoma and B16.F10 melanoma murine cell lines (a), and in U2OS osteosarcoma, MCF7 and HMLER breast carcinoma human cell lines and MCF10A epithelial breast cell line (b). Cells were treated with mock (control, CTR) or purified IFN-I (murine cells) or recombinant IFN-α2a (human cells) (6 × 103 U ml−1, 72 h). The percentage (mean ± s.e.m. and individual data points, n = 3 and n = 4 independent experiments) of CD133+CD44+CD24+ CT26 cells, CD133+CD44+CD24+low/CD133+CD44+CD24+high B16.F10 cells, CD133+CD44+/CD44v6+CD24+ U2OS cells, CD44+CD24−low/CD44v6+CD24−low MCF7, MCF10A and HMLER cells is shown. (c) Representative pictures of AT3 and B16.F10 epithelial cell morphology under mock or purified IFN-I treatment (n = 3 independent experiments). Scale bar, 100 μm. (d) Flow cytometry analysis showing the proportion of viable (propidium iodide/PI) MCA205 and AT3 cells left untreated (black) or treated with verapamil (VRP, 100 μM, light green), or purified IFN-I (blue) or VRP + IFN-I (dark green). Data are presented as mean ± s.e.m. and individual data points, n = 3 and n = 4 independent experiments. (e) Expression levels of reprogramming factors in AT3, CT26 and B16.F10 cells treated with purified IFN-I. Data are reported as mean fold change (FC) ± s.e.m. (n = 2 biologically independent samples) over untreated cells after intrasample normalization to the levels of Ppia. (f) Representative images showing the capability of soft-agar-recovered IFN-I-treated MCA205 cells to grow as 3D spheres in standard CSC culture conditions and to maintain a CSC-like transcriptomic profile (n = 2 biologically independent samples). Scale bar, 100 μm. (g) Multiparametric flow cytometry analysis of CD133+CD24+CD44+low (CD44L) and CD133+CD24+CD44+high (CD44H) in MCA205 cells and of CD133+CD44+CD24+low (CD24L) and CD133+CD44+CD24+high (CD24H) in AT3 cells treated for 10 consecutive days with mock or IFN-I (1 × 103 and 3 × 103 U ml−1). Representative biparametric plots and a histogram showing the percentage (mean ± s.e.m. with individual data point, n = 3 independent experiments) of CSCs are reported. (a,b) Unpaired two-sided Student’s t-test and unpaired two-sided Student’s t-test with Welch’s correction as compared to CTR cells. (d) Brown–Forsythe and Welch one-way ANOVA followed by Dunnett T3 post-hoc tests. (g) Ordinary one-way ANOVA test followed by Bonferroni’s correction. Source data
Extended Data Fig. 2
Extended Data Fig. 2. Immunogenic chemotherapy triggers putative cancer stem cell (CSC) appearance.
(a) Schematic representation of the ‘donor’-‘receiving’ cell coculture experimental protocol. (b) Flow cytometry analysis showing the induction of cell death upon oxaliplatin treatment (OXP, 300 µM, 24 h) in MCA205 cells with the illustrated genetic background. Data are presented as mean ± s.e.m. and individual data points, n = 3 independent experiments. (c) Multiparametric flow cytometry analysis of CSC surface markers in MCA205 cells treated with OXP alone or combined with the AIM2 inhibitor thalidomide (AIM2 inh, 10 µg ml-1) or inhibitors of the RIG-I pathway amlexanox (RIG-I inh#1, 5 µM), BX795 (RIG-I inh#2, 100 nM) and MRT67307 (RIG-I inh#3, 500 nM). The histograms represent the percentage (mean ± s.e.m. and individual data points; the number of independent experiments) of CD133+CD24+CD44+high (CD44H) and CD133+CD24+CD44+low (CD44L) cells. (d) Flow cytometry analysis of doxorubicin (DOX) efflux ability in MCA205 cells left untreated (gray) or exposed to DOX (2.5 μM, 48 h). The two DOXlow (orange) and DOXhigh (red) cell subsets display high and low capability to efflux DOX and Hoechst 33342 (one representative experiment out of three independent experiments). (e) Representative pictures of FACS-isolated DOX+low and DOX+high cells in standard culture conditions and under treatment with different chemotherapeutics (DOX+low cells). MCA205 cells were firstly treated with 2.5 μM DOX for 48 h, and then FACS-isolated based on their low or high positivity for red fluorescence. DOX+low and DOX+high sorted cells were then left untreated (control, CTR) or treated with OXP (30 μM), DOX (2.5 μM) or mitoxantrone (MTX, 0.04 μM) for 48 h. Representative pictures from one representative experiment out of two yielding similar results of CTR, DOX+high and treated DOX+low cells are shown. The percentage of counted cells is indicated for each condition, as determined by cell counts on pictures using ImageJ software. Scale bar, 100 μm. (f) Ex vivo flow cytometric analysis of the percentage of NANOG+ MCA205 cells grown in C57Bl/6 J mice treated intratumorally with vehicle (PBS) or 2.9 mg/kg DOX or 2.5 mg/kg cisplatin (CDDP). Data are presented as mean FC ± s.e.m. and individual data points over PBS treatment for 10 mice/group from 2 experimental replicates. (b,c,f) Ordinary one-way ANOVA test followed by Bonferroni’s correction. Source data
Extended Data Fig. 3
Extended Data Fig. 3. Cancer stem cell (CSC) enrichment through nucleic acid transfer.
(a) Flow cytometry analysis of CSC surface markers in ‘receiving’ viable AT3 breast carcinoma and CT26 colon murine carcinoma cells upon coculturing with ‘donor’ cells of the same type previously treated with oxaliplatin (OXP; 300 µM, 48 h) alone or in combination with benzonase (BNZase; 200 IU ml−1, 48 h). Data are presented as mean ± s.e.m. and individual data points. Number of biologically independent experiments are reported. (b) Schematic representation of the extracellular vesicle (EV)-‘receiving’ cell coculture experimental protocol. (a) Ordinary one-way ANOVA test followed by Bonferroni’s correction. Source data
Extended Data Fig. 4
Extended Data Fig. 4. Characterization of cancer stem cells (CSCs) enriched by type I interferons (IFN-I).
(a) Evaluation of cell proliferation/viability by CellTiter-Glo® assay in parental (PAR) and FACS-isolated CD133+CD24+CD44+low (CD44L) and CD133+CD24+CD44+high (CD44H) MCA205 cells (upon enrichment via IFN-I administration) treated for 72 h with oxaliplatin (OXP), doxorubicin (DOX) and mitoxantrone (MTX) as indicated. Results are reported as mean ± s.e.m., n = 3 biologically independent experiments. (b) In vivo evaluation of the prophylactic potential of PAR MCA205 and immunogenic cell death (ICD)-induced CSCs by using immunocompetent C57Bl/6J (Wild-type/Wt) mice or immunodeficient NSG mice that rejected the injections with PAR, CD44H and CD44L cells at the indicated dose in the experiment reported in Fig. 4b and rechallenging the animals with 1 × 105 PAR MCA205 in the other flank. The percentage of tumor-free mice is shown. (c) Ex vivo flow cytometric analysis of CD4 and CD8 expression in splenocytes from C57Bl/6J mice treated intraperitoneally with vehicle (CTR) or 200 µg/mouse of anti-CD4 and anti-CD8 (200 µg/mouse at day -1 and then every 4 days for 2 weeks). One representative experiment out of two is shown. (d) Schematic representation of ‘competition’ microfluidic devices. CD24L, CD133+CD44+CD24+low. (a) Ordinary one-way ANOVA test followed by Bonferroni’s correction. (b) Log-rank (Mantel-Cox) test. Source data
Extended Data Fig. 5
Extended Data Fig. 5. Chromatin remodeling following type I interferon (IFN-I) exposure.
(a) Patterns of gene expression as determined by RNA-seq for representative ATAC–seq-identified genes. Genes upregulated and downregulated in CD133+CD24+CD44+high (CD44H) cells induced by IFN-I are in red and blue, respectively. (b) Western-blot (WB) analysis of the levels of KDM1B in the indicated parental (PAR) cell lines and the same cell lines engineered to overexpress or down-express KDM1B (Kdm1bOVER and Kdm1bKD). Actin beta (b-ACTIN) is used as loading control. The table reports data quantification from one experiment. (c) Evaluation of the impact on KDM1B on chromatin remodeling by ATAC–seq. Representative loci for the illustrated genes in Kdm1bOVER and Kdm1bKD MCA205 cells are reported. (d) Evaluation of gene regulatory mechanisms downstream of KDM1B by ChIP–seq on immunogenic cell death (ICD)-induced CD44H cells isolated from MCA205 cells and Gene Ontology (GO) terms enrichment analysis. Genes are categorized as illustrated. (d) One-sided hypergeometric test followed by Benjamini–Hochberg correction for multiple comparisons.
Extended Data Fig. 6
Extended Data Fig. 6. Impact of KDM1B on cancer stemness, tumorigenicity, and invasiveness.
(a,b) Multiparametric flow cytometry analysis of cancer stem cell (CSC) surface markers (a) and qRT–PCR analyses of the reported reprogramming factors (b) in the indicated parental (PAR) cells and the same cell lines engineered to overexpress or down-express KDM1B (Kdm1bOVER and Kdm1bKD). The histograms in (a) represent the percentage (mean ± s.e.m. and individual data points, n = 3 biologically independent experiments) of the indicated CSC subpopulation including CD133+CD24+CD44+high (CD44H) MCA205 cells. qRT–PCR data are reported as mean fold change (FC) over untreated condition after intrasample normalization to Ppia expression levels. *P < 0.05, **P < 0.01, ***P < 0.001; the exact P values are in Supplementary Table 2. (c-e) Evaluation of the assessment of migration ability by transwell assay (c), therapeutic response to the reported immunogenic cell death (ICD) inducers and non inducers (d) and in vitro tumorigenicity and self-renewal potential by ELDA assay (e) in the indicated Kdm1bOVER and Kdm1bKD cells. Number of biologically independent samples (mean ± s.e.m. and individual data points for c and d) collected over three independent experiments is reported. (a,b) Ordinary one-way ANOVA test followed by Bonferroni’s correction as compared to control condition. (c-e) Unpaired two-sided Student’s t-test followed by Welch’s correction and two-tailed Mann–Whitney test. Exact calculations for ELDA assay are in Supplementary Table 2. Source data
Extended Data Fig. 7
Extended Data Fig. 7. Clinical correlation between KDM1B, type I interferon (IFN-I) signature, and stemness signature in breast cancer (BC) patients.
(a) Spearman correlations between expression scores of KDM1B and the reported IFN-I-related metagenes, stem-related reprogramming factors, IFN-I signatures and stemness signatures from microarray data of three publicly available cohorts of BC patients treated with neoadjuvant anthracycline-based chemotherapy. *P < 0.05, **P < 0.01, ***P < 0.001. (b) Kaplan–Meier plots depicting the distant relapse-free incidence (DRFI) in BC patients from the METABRIC cohort stratified according to risk behavior and boxplots reporting the expression levels of KDM1B and the illustrated stemness or IFN-I signatures. P value was calculated using the P Cox, Log-Rank (Mantel-Cox) test. P values <0.05 were considered statistically significant. The relative expression of the indicated genes and signatures is reported as mean ± s.e.m. from 1,903 patients. For statistics of boxplots see Supplementary Table 3. The correspondent disease-specific survival (DSS) is reported in Fig. 7b. (c,d) Analysis of the combined impact of KDM1B and the illustrated stemness and IFN-I signatures on DRFI and DSS on BC patients form the METABRIC database upon their stratification according positivity or negativity to the Erb-B2 Receptor Tyrosine Kinase 2 (ERBB2, best known as HER2). P values are calculated as in (b). Ns, not-significant. (a) Two-sided Spearman’s rho.

Comment in

Similar articles

Cited by

References

    1. Dean, M., Fojo, T. & Bates, S. Tumour stem cells and drug resistance. Nat. Rev. Cancer5, 275–284 (2005). - PubMed
    1. Batlle, E. & Clevers, H. Cancer stem cells revisited. Nat. Med.23, 1124–1134 (2017). - PubMed
    1. Vitale, I., Shema, E., Loi, S. & Galluzzi, L. Intratumoral heterogeneity in cancer progression and response to immunotherapy. Nat. Med.27, 212–224 (2021). - PubMed
    1. Cao, J. & Yan, Q. Cancer epigenetics, tumor immunity, and immunotherapy. Trends Cancer6, 580–592 (2020). - PMC - PubMed
    1. Wainwright, E. N. & Scaffidi, P. Epigenetics and cancer stem cells: unleashing, hijacking, and restricting cellular plasticity. Trends Cancer3, 372–386 (2017). - PMC - PubMed

MeSH terms