

Single cell RNA-seq analysis reveals temporally-regulated and quiescence-regulated gene expression in Drosophila larval neuroblasts
- PMID: 36002894
- PMCID: PMC9404614
- DOI: 10.1186/s13064-022-00163-7
Single cell RNA-seq analysis reveals temporally-regulated and quiescence-regulated gene expression in Drosophila larval neuroblasts
Abstract
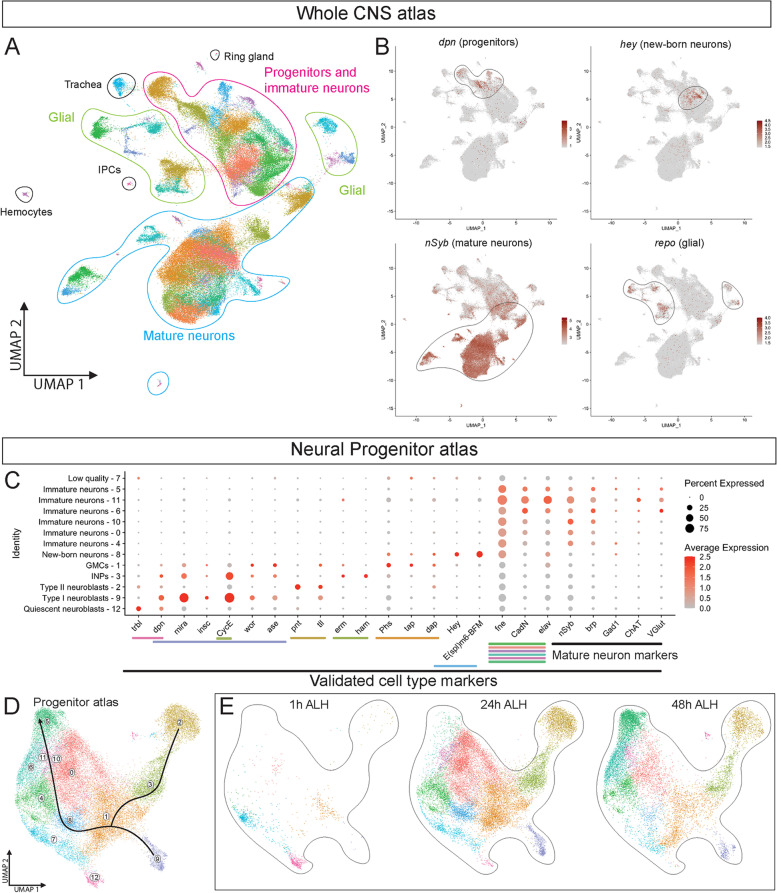
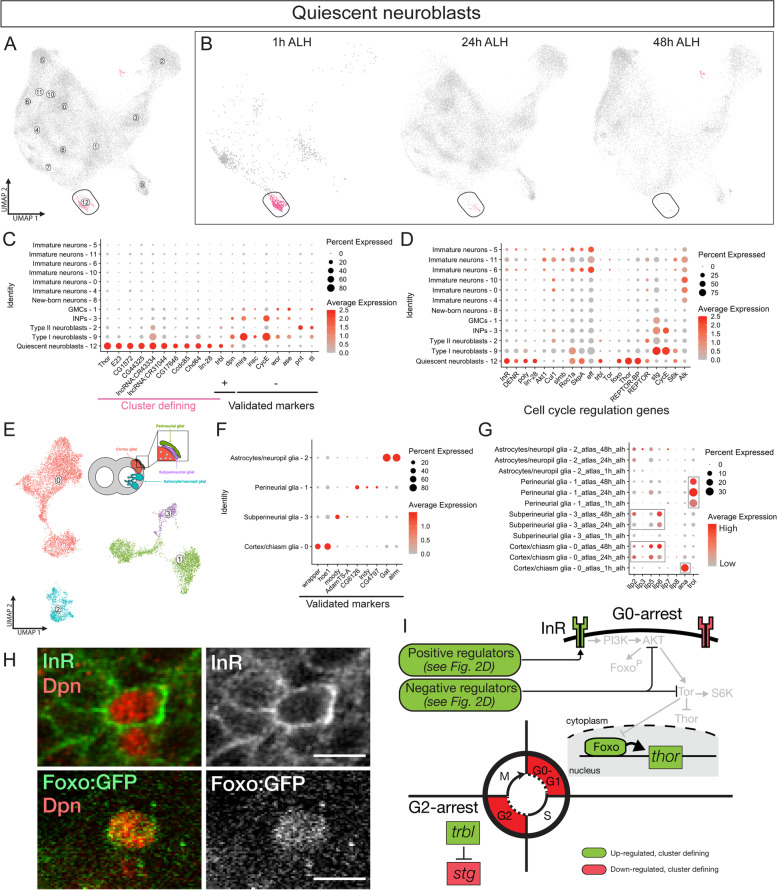
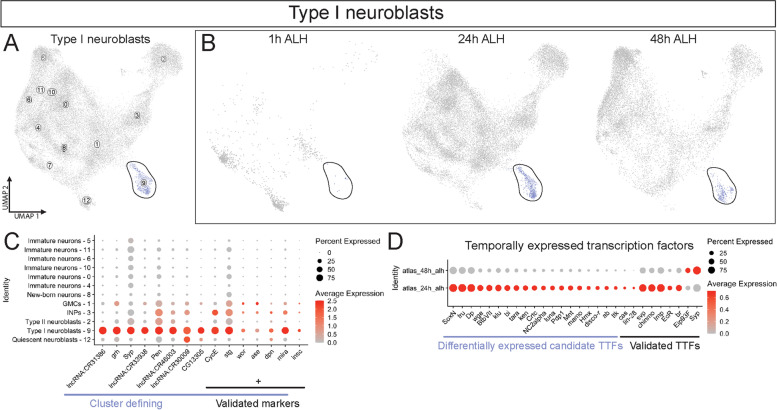
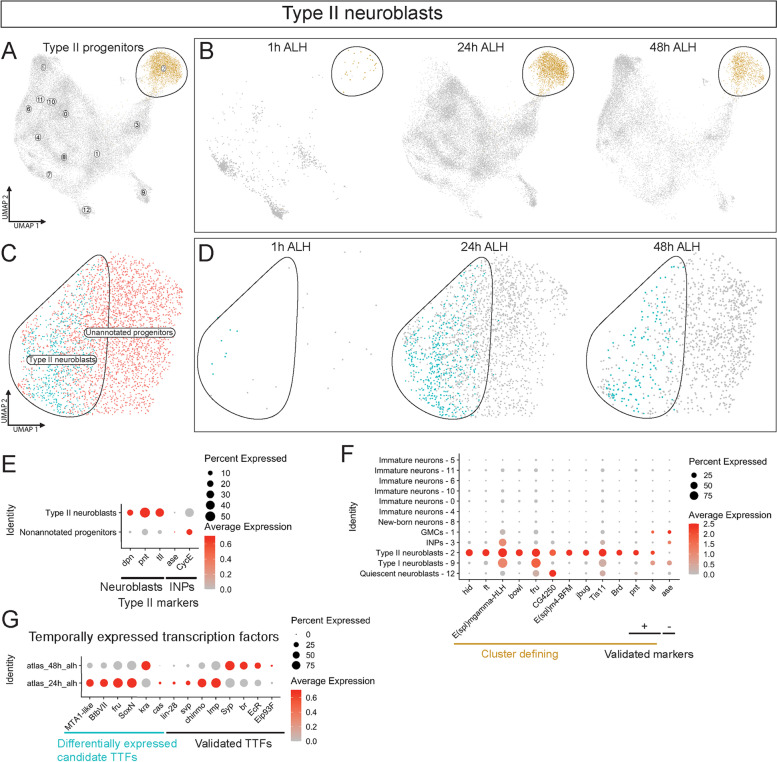
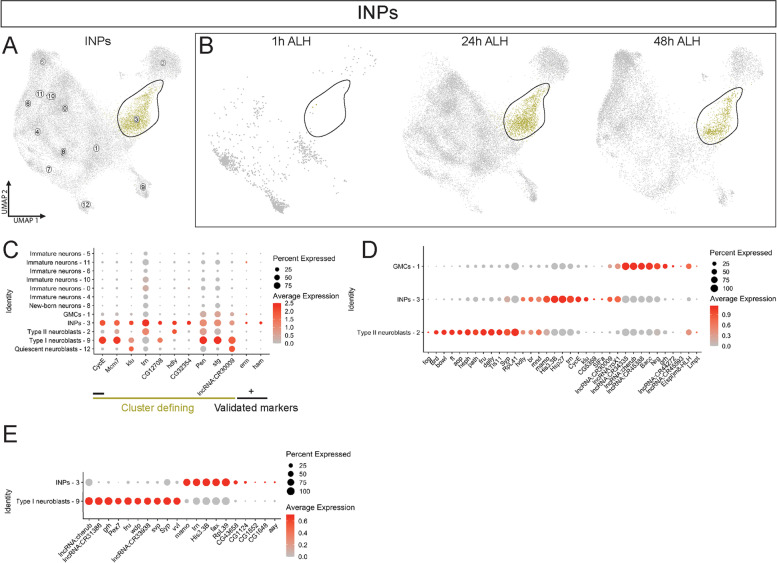
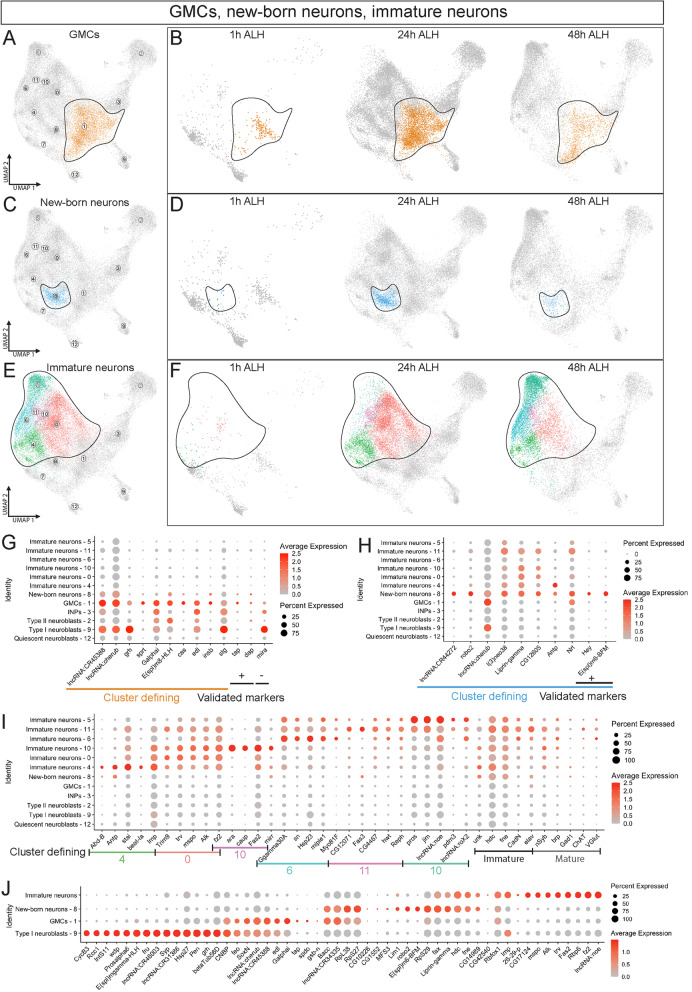
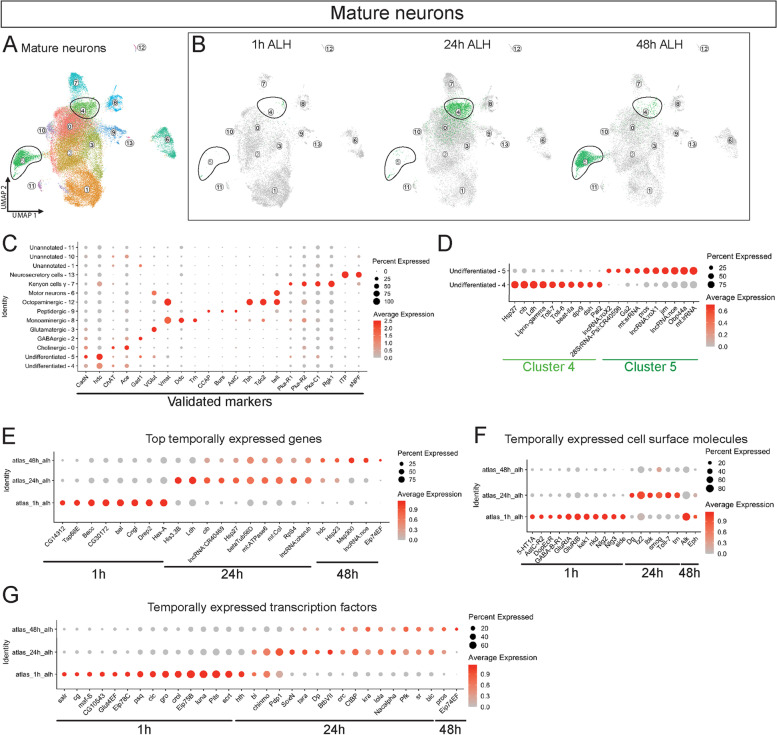
The mechanisms that generate neural diversity during development remains largely unknown. Here, we use scRNA-seq methodology to discover new features of the Drosophila larval CNS across several key developmental timepoints. We identify multiple progenitor subtypes - both stem cell-like neuroblasts and intermediate progenitors - that change gene expression across larval development, and report on new candidate markers for each class of progenitors. We identify a pool of quiescent neuroblasts in newly hatched larvae and show that they are transcriptionally primed to respond to the insulin signaling pathway to exit from quiescence, including relevant pathway components in the adjacent glial signaling cell type. We identify candidate "temporal transcription factors" (TTFs) that are expressed at different times in progenitor lineages. Our work identifies many cell type specific genes that are candidates for functional roles, and generates new insight into the differentiation trajectory of larval neurons.
Keywords: Insulin signaling; Intermediate neural progenitor; Neuroblast; Quiescence; Single cell RNA-sequencing; Temporal transcription factor.
© 2022. The Author(s).
Conflict of interest statement
None.
Figures
Similar articles
-
A comprehensive temporal patterning gene network in Drosophila medulla neuroblasts revealed by single-cell RNA sequencing.Nat Commun. 2022 Mar 10;13(1):1247. doi: 10.1038/s41467-022-28915-3. Nat Commun. 2022. PMID: 35273186 Free PMC article.
-
Imp is required for timely exit from quiescence in Drosophila type II neuroblasts.PLoS One. 2022 Dec 15;17(12):e0272177. doi: 10.1371/journal.pone.0272177. eCollection 2022. PLoS One. 2022. PMID: 36520944 Free PMC article.
-
Temporal Patterning in the Drosophila CNS.Annu Rev Cell Dev Biol. 2017 Oct 6;33:219-240. doi: 10.1146/annurev-cellbio-111315-125210. Annu Rev Cell Dev Biol. 2017. PMID: 28992439 Review.
-
Drosophila type II neuroblast lineages keep Prospero levels low to generate large clones that contribute to the adult brain central complex.Neural Dev. 2010 Oct 1;5:26. doi: 10.1186/1749-8104-5-26. Neural Dev. 2010. PMID: 20920301 Free PMC article.
-
From temporal patterning to neuronal connectivity in Drosophila type I neuroblast lineages.Semin Cell Dev Biol. 2023 Jun;142:4-12. doi: 10.1016/j.semcdb.2022.05.022. Epub 2022 May 31. Semin Cell Dev Biol. 2023. PMID: 35659165 Free PMC article. Review.
Cited by
-
A chromatin remodelling SWI/SNF subunit, Snr1, regulates neural stem cell determination and differentiation.Development. 2023 Jul 1;150(13):dev201484. doi: 10.1242/dev.201484. Epub 2023 Jun 30. Development. 2023. PMID: 37294080 Free PMC article.
-
Drosophila TET acts with PRC1 to activate gene expression independently of its catalytic activity.Sci Adv. 2024 May 3;10(18):eadn5861. doi: 10.1126/sciadv.adn5861. Epub 2024 May 3. Sci Adv. 2024. PMID: 38701218 Free PMC article.
-
Imp/IGF2BP and Syp/SYNCRIP temporal RNA interactomes uncover combinatorial networks of regulators of Drosophila brain development.Sci Adv. 2025 Feb 7;11(6):eadr6682. doi: 10.1126/sciadv.adr6682. Epub 2025 Feb 7. Sci Adv. 2025. PMID: 39919181 Free PMC article.
-
Insect Insights at the Single-Cell Level: Technologies and Applications.Cells. 2023 Dec 31;13(1):91. doi: 10.3390/cells13010091. Cells. 2023. PMID: 38201295 Free PMC article. Review.
-
Dynamically regulated transcription factors are encoded by highly unstable mRNAs in the Drosophila larval brain.RNA. 2023 Jul;29(7):1020-1032. doi: 10.1261/rna.079552.122. Epub 2023 Apr 11. RNA. 2023. PMID: 37041032 Free PMC article.
References
-
- Luo L. Principles of Neurobiology. 2. Boca Raton: Garland Science; 2020.
-
- Clark BS, Stein-O’Brien GL, Shiau F, Cannon GH, Davis-Marcisak E, Sherman T, et al. Single-Cell RNA-Seq Analysis of Retinal Development Identifies NFI Factors as Regulating Mitotic Exit and Late-Born Cell Specification. Neuron. 2019;102:1111–1126.e5. doi: 10.1016/j.neuron.2019.04.010. - DOI - PMC - PubMed
Publication types
MeSH terms
Substances
Grants and funding
LinkOut - more resources
Full Text Sources
Molecular Biology Databases
