. 2022 Jul 27;1(3):pgac124.
doi: 10.1093/pnasnexus/pgac124. eCollection 2022 Jul.

Charge-based interactions through peptide position 4 drive diversity of antigen presentation by human leukocyte antigen class I molecules

Affiliations

Charge-based interactions through peptide position 4 drive diversity of antigen presentation by human leukocyte antigen class I molecules

Kyle R Jackson et al. PNAS Nexus. .

Abstract

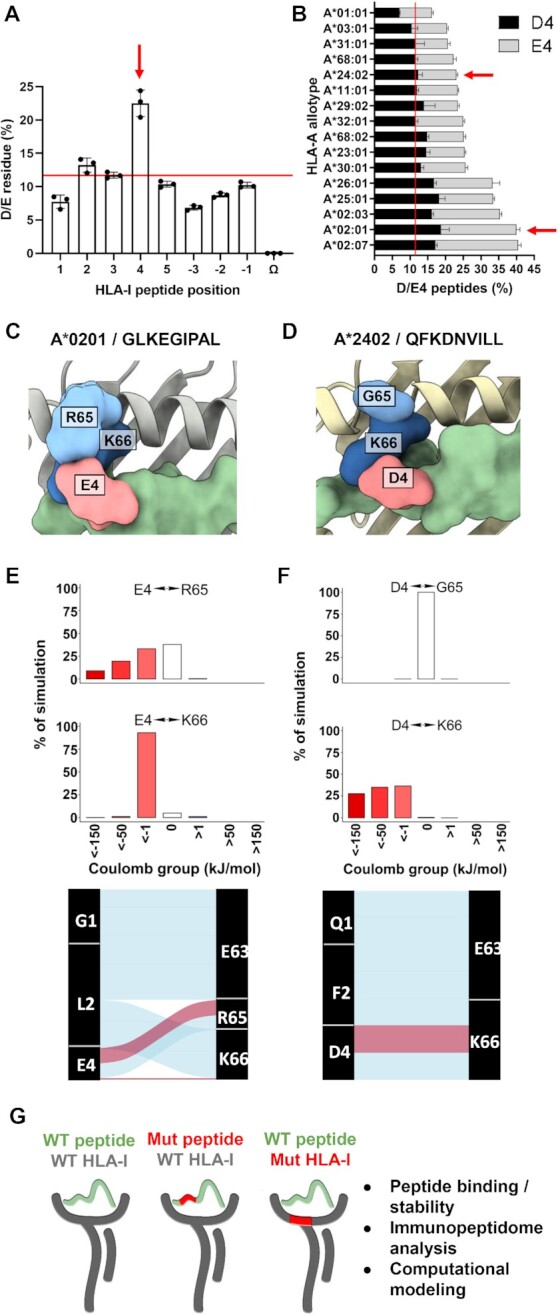
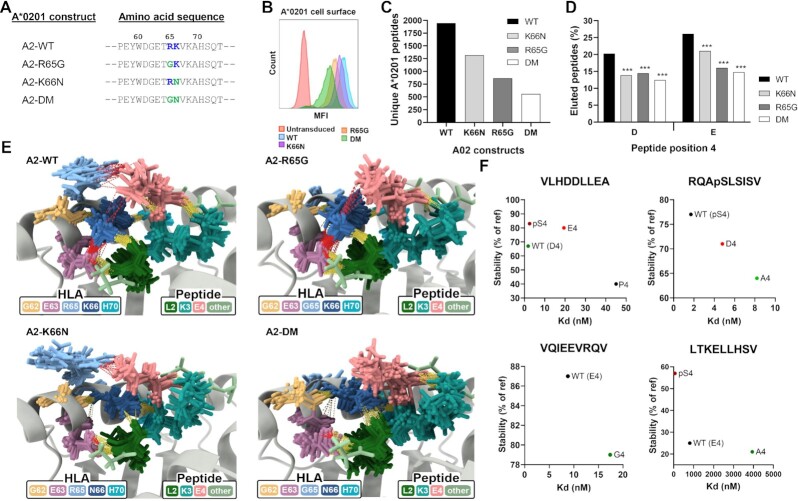
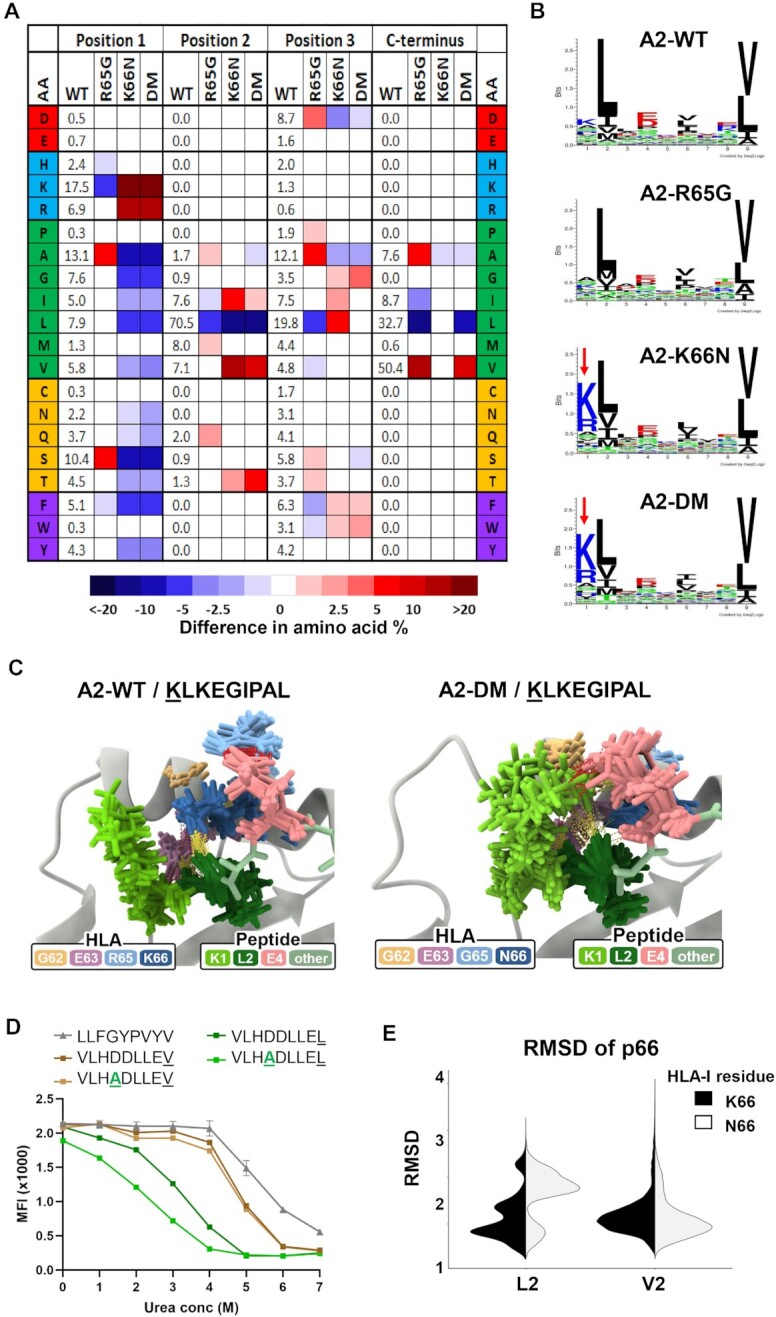
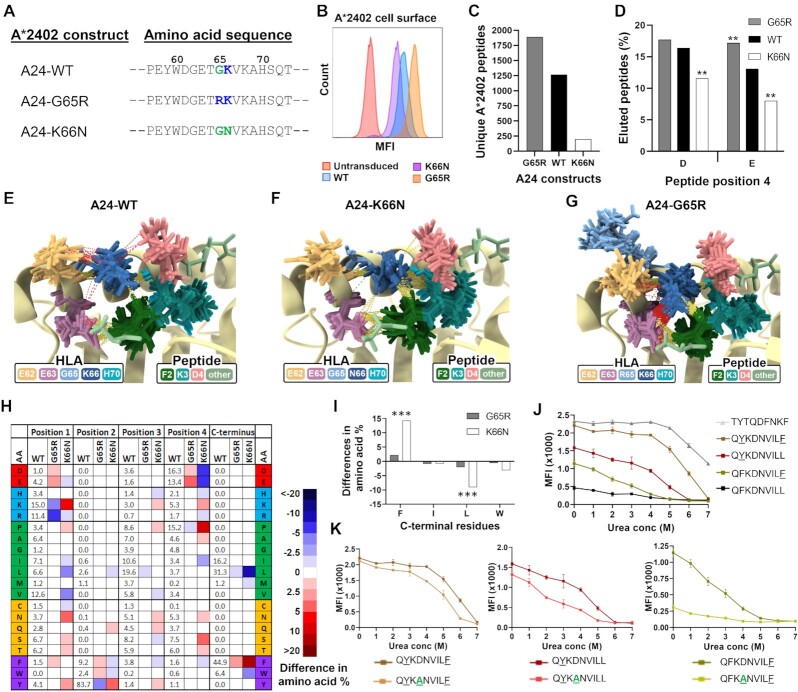
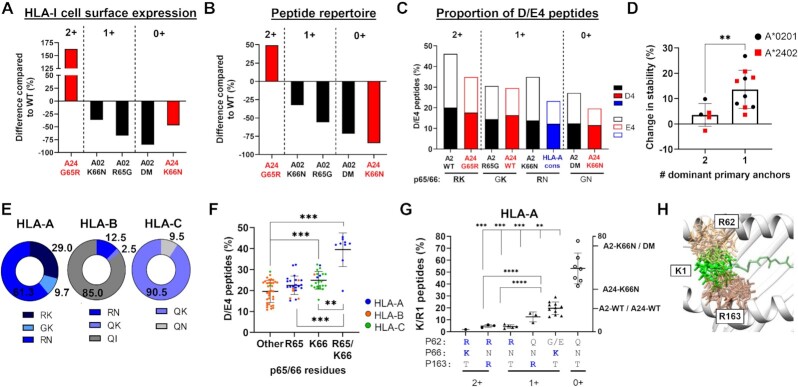
Human leukocyte antigen class I (HLA-I) molecules bind and present peptides at the cell surface to facilitate the induction of appropriate CD8+ T cell-mediated immune responses to pathogen- and self-derived proteins. The HLA-I peptide-binding cleft contains dominant anchor sites in the B and F pockets that interact primarily with amino acids at peptide position 2 and the C-terminus, respectively. Nonpocket peptide-HLA interactions also contribute to peptide binding and stability, but these secondary interactions are thought to be unique to individual HLA allotypes or to specific peptide antigens. Here, we show that two positively charged residues located near the top of peptide-binding cleft facilitate interactions with negatively charged residues at position 4 of presented peptides, which occur at elevated frequencies across most HLA-I allotypes. Loss of these interactions was shown to impair HLA-I/peptide binding and complex stability, as demonstrated by both in vitro and in silico experiments. Furthermore, mutation of these Arginine-65 (R65) and/or Lysine-66 (K66) residues in HLA-A*02:01 and A*24:02 significantly reduced HLA-I cell surface expression while also reducing the diversity of the presented peptide repertoire by up to 5-fold. The impact of the R65 mutation demonstrates that nonpocket HLA-I/peptide interactions can constitute anchor motifs that exert an unexpectedly broad influence on HLA-I-mediated antigen presentation. These findings provide fundamental insights into peptide antigen binding that could broadly inform epitope discovery in the context of viral vaccine development and cancer immunotherapy.

Keywords: computational modeling; human leukocyte antigen (HLA); mass spectrometry; molecular dynamics; peptide antigen presentation.


Figures

Fig. 1.
Fig. 1.
HLA class I prefers acidic residues at peptide position 4 found in close proximity to basic residues in positions 65/66. (A) Frequency of aspartic acid (D) and glutamic acid (E) residues at all HLA-I peptide positions (N-terminus p1 to p5 and C-terminus pΩ to p−3) from 108 HLA-I allotypes, where each dot represents one of three public peptide databases and the red line indicates the background frequency of D/E residues found in vertebrate proteins (∼12%). (B) Frequency of D/E4 peptides eluted from 16 prevalent HLA-A allotypes from three different peptide databases. Red arrows highlight HLA-A allotypes A*02:01 and A*24:02 that were the main focus of this study. (C)/(D) Top view from crystal structures of HLA-I/peptide complexes A*02:01/GLKEGIPAL (C) and A*24:02/QFKDNVILL (D), where the peptide is green. (E)/(F) Top panels: coulombic interactions between peptide p4 and HLA-I p65 or p66 from MD simulations of A*02:01/GLKEGIPAL (E) and A*24:02/QFKDNVILL (F) complexes, where negative values are red and positive values are blue. Bottom panels: alluvial plots showing selected interactions formed during simulations of A*02:01/GLKEGIPAL (E) and A*24:02/QFKDNVILL (F). Blue lines indicate hydrogen bonds, red lines indicate salt bridges, and width indicates proportional prevalence. (G) Schematic showing the overall strategy and the experimental approaches utilized in this study.
Fig. 2.
Fig. 2.
Basic p65/66 residue substitutions to HLA-A*02:01 reduce surface expression, peptide repertoire diversity, and presentation of D/E4 ligands. (A) Amino acid positions 57 to 73 of WT HLA-A*02:01 and the three p65/66-mutated A*02:01 molecules, where positively charged residues are in blue and substituted residues are green at p65 and p66. (B) Cell surface expression of A*02:01 WT or mutant molecules in transduced H1975 lung cancer cells, as determined by flow cytometry. (C) Total number of unique peptides identified by mass spectrometry of A*02:01 molecules eluted from WT or mutant transduced H1975 cells. (D) Proportion of peptides containing D or E in peptide position 4 in A*02:01 WT or mutant molecules. (E) Ensemble of representative conformations extracted from multiple MD simulations of GLKEGIPAL bound to A2-WT, A2-R65G, A2-K66N, and A2-DM, where yellow dashed lines indicate hydrogen bonds and red dashed lines indicate salt bridges. (F) Peptide binding and stability assays performed on four peptides with various p4 substitutions in WT A*02:01 molecules. Stability values were calculated compared to the reference peptide LLFGYPVYV. *** indicates P ≤ 0.001 using a two proportion Z-test comparing amino acid frequencies of peptides eluted from mutant molecules to frequencies of peptides eluted from WT HLA-A*02:01.
Fig. 3.
Fig. 3.
Changes to basic p65/66 residues of A*02:01 impacts peptide position 1 and primary anchor residues of eluted peptide ligands. (A) Heat map depicting the changes in frequencies for all 20 amino acids at positions 1 to 3 and the C-terminus (pΩ) in A2 mutants compared to WT A*02:01. (B) Peptide-binding motifs derived from peptides eluted from A2-WT, A2-R65G, A2-K66N, or A2-DM molecules generated by Seq2Logo. Red arrows indicate the increased frequency of positively charged amino acids in position 1. (C) Ensemble of representative conformations extracted from multiple MD simulations of the p1-substituted KLKEGIPAL peptide bound to A2-WT or A2-DM, where yellow dashed lines indicate hydrogen bonds and red dashed lines indicate salt bridges. (D) Peptide stability assays comparing p4 and/or pΩ residue-substituted peptides VLHDDLLEV, VLHADLLEV, VLHDDLLEL, and VLHADLLEL bound to WT HLA-A*02:01. (E) Root Mean Square Deviation (RMSD) of the HLA-I residue K66 or N66 of all conformations extracted from MD simulations of GLKEGIPAL and GVKEGIPAL bound to A2-WT and A2-K66N and crystallographic conformations of p66 in A*02:01/GLKEGIPAL (PDB code 5ENW).
Fig. 4.
Fig. 4.
Basic residues in p65/66 of HLA-A*24:02 determine cell surface expression levels, peptide repertoire diversity, and binding stability. (A) Amino acid positions 57 to 73 of WT HLA-A*24:02 and both of the mutated A*24:02 molecules, where positively charged residues are in blue and substituted residues are in green at p65 and p66. (B) Cell surface expression of WT A*24:02 or mutant molecules in transduced H1975 lung cancer cells, as determined by flow cytometry. (C) Total number of unique peptide sequences identified by MS analysis of peptide ligands eluted from WT A*24:02 or mutant molecules immunoprecipitated from transduced H1975 cells. (D) Proportion of peptides containing D or E in peptide position 4 in A*24:02 WT or mutant molecules. (E)–(G) Ensemble of representative conformations extracted from multiple MD simulations of QFKDNVILL bound to A24-WT, A24-K66N, and A2-DM, where yellow dashed lines indicate hydrogen bonds and red dashed lines indicate salt bridges. (H) Heat map depicting the changes in amino acid frequencies at peptide positions 1 to 4 and pΩ in A24 mutants compared to WT A*24:02. (I) Differences in the amino acid frequencies of C-terminal (pΩ) anchor residues in peptides eluted from A24-G65R or A24-K66N mutants compared to A24-WT. (J) Results of peptide stability assays comparing the parent QFKDNVILL peptide with the p2 and/or pΩ residue-substituted peptides QYKDNVILL, QFKDNVILF, and QYKDNVILF. For these assays, TYTQDFNKF was used as a positive control and reference peptide. (K) Peptide stability assays of the QYKDNVILF, QYKDNVILL, and QFKDNVILF peptides compared with their D4A-substituted counterparts, where TYTQDFNKF was used as a reference peptide. ** indicates P ≤ 0.01 and *** indicates P ≤ 0.001 using a two proportion Z-test comparing amino acid frequencies of peptides eluted from mutant molecules to frequencies eluted from WT A*24:02.
Fig. 5.
Fig. 5.
HLA class I/peptide interactions observed in A*02:01 and A*24:02 may be conserved throughout the HLA class I system. (A) Change in cell surface expression between mutated HLA-A*02:01 or A*24:02 molecules compared to their WT counterparts. A*02:01 mutants are shown in black and A*24:02 mutants are depicted in red. (B) Change in the total number of unique peptides identified through MS analysis of mutant A*02:01 and A*24:02 molecules compared to WT A*02:01 or A*24:02 molecules. Numbers at the top of the graph refer to the number of positively charged residues in HLA-I p65 and p66. (C) Comparison of the proportion of D/E4 peptides eluted from A*02:01 or A*24:02 WT and mutated molecules, and other HLA-A allotypes. Black: A*02:01; red: A*24:02; and blue: HLA-A molecules containing the R65/N66 HLA-A consensus sequence. Numbers at the top of the graph refer to the number of positively charged residues in HLA-I p65 and p66. (D) Graph showing the change in peptide stability of A*02:01- and A*24:02-restricted peptides containing D/E4 compared to their non-D/E4 counterparts, with peptides grouped according to the number of dominant anchors (L2-VΩ for A*02:01 and Y2-FΩ for A*24:02).** indicates P ≤ 0.01 using an unpaired t test with Welch’s correction. (E) The relative proportions of HLA-A, B, and C allotypes containing R65 and/or K66, where blue color indicates R65 and/or K66 and gray color indicates neither R65 nor K66. (F) The proportion of D/E4 peptide ligands eluted from individual HLA-A, -B, and C allotypes, grouped according to positively charged amino acids in p65 and p66. (G) The proportion of K/R1 peptide ligands eluted from individual HLA-A allotypes, grouped by their configuration of amino acids in HLA-I positions p62, p66, and p163. (H) Computational modeling showing overlap of conformational possibilities between peptide K1 residues (green) and HLA-I residues R62 (light tan) and R163 (dark tan). For (F) and (G), Brown–Forsythe ANOVA tests showed significant difference between means (P < 0.0001), and multiple comparisons using Dunnett’s T3 test were also performed to assess the significance of differences between specific groups. ** indicates P ≤ 0.01, *** indicates P ≤ 0.001, and **** indicates P ≤ 0.0001.

Similar articles

Cited by

References

    1. Yewdell JW, Reits E, Neefjes J. 2003. Making sense of mass destruction: quantitating MHC class I antigen presentation. Nat Rev Immunol. 3:952–961. - PubMed
    1. Zinkernagel RM, Doherty PC. 1974. Restriction of in vitro T cell-mediated cytotoxicity in lymphocytic choriomeningitis within a syngeneic or semiallogeneic system. Nature. 248:701–702. - PubMed
    1. Goulmy E, Termijtelen A, Bradley BA, van Rood JJ. 1977. Y-antigen killing by t cells of women is restricted by HLA. Nature. 266:544–545. - PubMed
    1. Robinson J et al. 2015. The IPD and IMGT/HLA database: allele variant databases. Nucleic Acids Res. 43:D423–D431. - PMC - PubMed
    1. Kubo RT et al. 1994. Definition of specific peptide motifs for four major HLA-A alleles. J Immunol. 152:3913–3924. - PubMed