. 2022 Aug 8:10:827774.
doi: 10.3389/fcell.2022.827774. eCollection 2022.

In Vivo Clonal Analysis Reveals Random Monoallelic Expression in Lymphocytes That Traces Back to Hematopoietic Stem Cells

Affiliations

In Vivo Clonal Analysis Reveals Random Monoallelic Expression in Lymphocytes That Traces Back to Hematopoietic Stem Cells

Nadiya Kubasova et al. Front Cell Dev Biol. .

Abstract

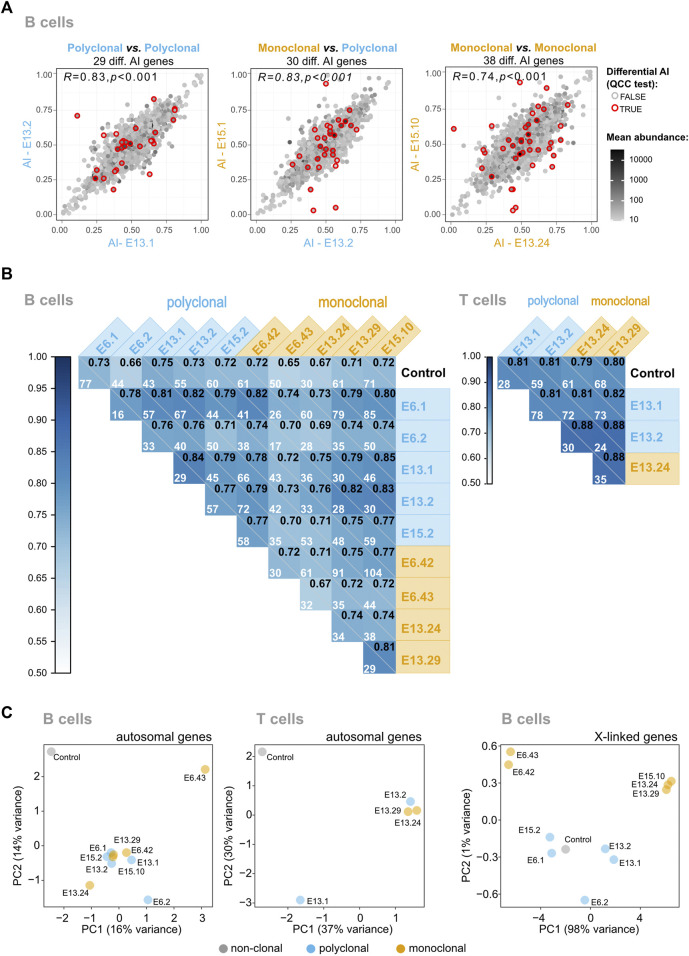
Evaluating the epigenetic landscape in the stem cell compartment at the single-cell level is essential to assess the cells' heterogeneity and predict their fate. Here, using a genome-wide transcriptomics approach in vivo, we evaluated the allelic expression imbalance in the progeny of single hematopoietic cells (HSCs) as a read-out of epigenetic marking. After 4 months of extensive proliferation and differentiation, we found that X-chromosome inactivation (XCI) is tightly maintained in all single-HSC derived hematopoietic cells. In contrast, the vast majority of the autosomal genes did not show clonal patterns of random monoallelic expression (RME). However, a persistent allele-specific autosomal transcription in HSCs and their progeny was found in a rare number of cases, none of which has been previously reported. These data show that: 1) XCI and RME in the autosomal chromosomes are driven by different mechanisms; 2) the previously reported high frequency of genes under RME in clones expanded in vitro (up to 15%) is not found in clones undergoing multiple differentiation steps in vivo; 3) prior to differentiation, HSCs have stable patterns of autosomal RME. We propose that most RME patterns in autosomal chromosomes are erased and established de novo during cell lineage differentiation.

Keywords: RNA-seq; X-chromosome inactivation (XCI); allele-specific expression; allelic imbalance (AI); clonal analysis; epigenetics; hematopoietic stem cell (HSC); random monoallelic expression (RME).


Conflict of interest statement

The authors declare that the research was conducted in the absence of any commercial or financial relationships that could be construed as a potential conflict of interest.

Figures

FIGURE 1
FIGURE 1
A single hematopoietic stem cell (HSC) gives rise to myeloid and lymphoid cells in the blood with long-term reconstitution. (A) Establishment of monoclonal and polyclonal hematopoietic systems in vivo. A single HSC or 50–200 HSCs were injected into sub-lethally irradiated recipient mice to generate a monoclonal or a polyclonal hematopoietic system, respectively. Different donor mice were used in each experiment. Both donor and recipient animals were the F1 progeny of CAST × B6 crosses, but the recipient and donor cells could be distinguished by the presence of a polymorphism in the pan-leukocyte antigen Ly5 [donor animals: F1(CASTLy5/Ly5 × B6Ly5.2/Ly5.2), recipient animals: F1(CASTLy5/Ly5 × B6Ly5.2/Ly5.1)]. Secondary reconstitutions and isolation of B/T cell populations were performed after 12 weeks of cell differentiation in vivo. (B) Long-term HSC (LT-HSC) isolation. The bone marrow cells of an F1 CASTLy5/Ly5 × B6Ly5.2/Ly5.2 mouse were stained with a cocktail of biotin-conjugated antibodies for surface markers of lineage-committed cells (anti-B220, anti-CD19, anti-Mac1, anti-Ter119, anti-Gr1, and anti-CD3), and subsequently, lineage-marked cells were depleted using MACS Streptavidin MicroBeads. After depletion, cells were stained with fluorophore-conjugated antibodies: APC-conjugated anti-c-Kit, FITC-conjugated anti-Sca-1, BV421-conjugated anti-CD48, PE-conjugated anti-CD150, Streptavidin/APC-Cy7 (SAV/APC-Cy7), and PI, and sorted on a FACSAriaIII. The cells were gated for PI/APC-Cy7 to exclude dead cells and any remaining lineage-positive cells, then for c-Kit+/Sca-1+ to obtain LinSca+c-Kit+ (LSK) cells, and finally gated for CD48/CD150+ to obtain LT-HSCs. (C) Evolution of donor-derived cell population percentages over time in the peripheral blood of the recipient animals. After blood collection, red cells were lysed, and the cells were then stained with anti-Ly5.2 and analyzed on a FACSCanto or FACScan instrument. (D) A single donor HSC differentiates into lymphoid and myeloid hematopoietic populations in vivo. Cells from different hematopoietic organs of recipient animals were isolated, stained, gated on PI, FITC anti-Ly5.1+, and PE anti-Ly5.2, and identified as splenic B cells (PE-Cy7 anti-CD19+), CD4 thymocytes (PE-Cy7 anti-CD4+), or bone marrow macrophages (BV786 anti-Mac1+). (E) A single donor HSC repopulates secondary recipients. Representative plots of secondary reconstitutions 4 weeks post-reconstitution with bone marrow cells isolated from polyclonal and monoclonal primary reconstituted animals. Blood samples of secondary reconstituted mice were lysed for red cells, stained with FITC-conjugated anti-Ly5.2 for donor cells and PE-conjugated anti-Ly5.1 for recipient cells, and analyzed using FACSCanto. (F) VDJ clonotypes in different populations of donor-HSC-derived B and T cells expanded in vivo, and in the control animal. On the left panel, the numbers of sequenced reads (x-axis) were plotted against the number of unique VDJ rearrangements (“clonotypes”) identified with the MiXCR software tool on each sample (y-axis). The right panel shows the number of antigen clonotypes normalized by the total number of reads.
FIGURE 2
FIGURE 2
Single-HSC reconstitutions produce clonal hematopoietic systems. (A) Schematic representation of single and multiple HSC reconstitutions that originated the samples used for RNA-seq in this study (experiments E6, E13, and E15). In each experiment, HSCs isolated from one donor mouse F1(CASTLy5/Ly5 × B6Ly5.2/Ly5.2) were injected into multiple sub-lethally irradiated recipient animals F1(CASTLy5/Ly5 × B6Ly5.2/Ly5.1). Different donors were used for each experiment. All animals showed long-term reconstitutions, and both monoclonal and polyclonal cells from primary repopulated animals reconstituted a secondary recipient (see representative cytometry profiles in Figure 1). The density plots represent the allelic ratios of X chromosome-linked genes for each sample, as measured by RNA-seq. (B) AI of X-linked genes and X-Chromosome Inactivation (XCI) escapee genes. Violin plots superimposing dot plots of X-linked genes allelic ratios per clonal/polyclonal B/T cell sample. For grey dots, the opacity reflects the relative abundance in trimmed mean of M (TMM)-normalized counts. Genes significantly escaping XCI (green dots) are the ones for which the AI value is significantly above (or below) the median AI value of all genes plus (or minus) 0.1 when the CAST (or B6) X chromosome is expressed (more details are given in the Materials and Methods section). (C) X chromosome ideogram annotating the location of XCI escapee genes confirmed in this study for B and T cells (upper ideogram) and in the literature (lower ideogram). The AI of XCI escapee genes are denoted in pink (for B cell samples) and brown (for T cell samples).
FIGURE 3
FIGURE 3
The vast majority of mitotically stable allelic biases of the hematopoietic system are not established during the HSC stage. (A) Representative plots of pairwise AI comparisons (monoclonal vs. polyclonal samples, polyclonal vs. polyclonal samples; and monoclonal vs. monoclonal samples). Red circles signal the genes for which differential AI remained statistically significant after quality control constant (QCC) correction, and the total number of these genes per comparison is shown above each plot. The Pearson’s coefficient correlation for all AI pairwise comparisons is also shown, in the upper left corner of each dot plot. A grayscale coloring the dots represents the mean expression between the two samples, calculated from each sample’s TMM-normalized counts. (B) Correlograms for B and T samples. Pearson’s coefficient correlation of AI for all pairwise comparisons between samples. Within each square, the Pearson’s coefficient is represented in the upper right corner, and the number of genes with a significant differential AI in each pairwise comparison after applying QCC correction on the binomial test is also shown. (C) Visualization of high-dimensional data of autosomal AI in a low-dimensional space using Principal Component Analysis suggests that the monoclonal animals have more variable AI values because of the slightly higher scattering compared to the polyclonal animals, but fails to reveal major differences between the two groups. As a control to show the impact of the AI values in the clustering of the samples in the low-dimensional space, the data from the X-linked genes of the monoclonals were added; as expected, these samples cluster according to the X chromosome (CAST or B6) that is expressed.
FIGURE 4
FIGURE 4
In some loci, the memory of allele-specific gene regulatory state persists over many cell divisions throughout extensive differentiation. (A) Dot plot showing standard deviations (SD) of AIs for five B cell monoclonal samples (x-axis) against the SD of AIs for five polyclonal samples (y-axis). Dashed vertical and horizontal lines—arbitrarily set at an AI SD of 0.15—represent the threshold above which genes were considered as potentially intrinsically imbalanced. Dots represent genes, black-circled dots highlight genes with higher AI variance among monoclonal samples in the autosomes, while pink-circled dots denote the X-linked genes (control). The genes included in this analysis have AI differences statistically significant after QCC correction in at least one pairwise comparison (see the matrix of Figure 3B for all pairwise comparisons) and are expressed in all the 10 B cell samples; see Supplementary Figure S9 for the same SD-based analysis without filtering the genes. (B) Comparison of putative mitotically stable allelically imbalanced genes between all B cell samples. Grey dots represent the AI values of the unmanipulated animal control sample, and empty circles are the AI values of monoclonal or polyclonal samples. Red circles represent comparisons for which the AI difference between the manipulated animal sample and unmanipulated control remained statistically significant after QCC correction. Not all genes show statistically significant differences with the unmanipulated control, but all represented genes have at least one statistically significant AI difference in monoclonal or polyclonal pairwise comparisons. The diameter of dots/circles is proportional to the reads abundance. (C) Dot plots showing the AI of putative transcriptionally stable allelically imbalanced genes in B cells (x-axis) against the corresponding ones in T cells (y-axis). Pairwise comparisons for two monoclonal animals are shown. In the left plot, the B and T cell data for each of the two animals are paired (within animal comparison), whereas the right plot is an artificial control in which the B and T cell data from different animals are paired (comparison between animals). Each plot shows the Pearson’s coefficient correlation considering the combined animal datasets; for the left graph, Pearson’s coefficient correlations for each animal are R = 0.33 (p = 0.147) and R = 0.85 (p < 0.001). (D) AI from RNA-seq data plotted against AI from whole exome sequencing (WES) data for the same animals (polyclonal sample E6.2, and monoclonal samples E6.43 and E15.10). Only genes with abundance>10 TMM-normalized counts are represented. For the DNA axis (x-axis), all of these genes fall in the vicinity of the dotted vertical lines highlighting the 0.4–0.6 AI “balanced” range. (E) Difference between the AIs in DNA data and RNA data (AIDNA−AIRNA) in two monoclonal samples for the genes highlighted in (B). In the left panel, the histogram represents the distributions of the means of the difference for 13 or 14 randomly sampled genes generated by bootstrapping the transcriptomics data (100,000 replicates per distribution). The dashed lines show the observed AIDNA−AIRNA means for the 13 and 14 of the 14 putative mitotically stable allelically imbalanced genes detected in the monoclonal samples E6.43 and E15.10, respectively, which are statistically different from the mean of a random sample considering the respective distributions (p = 0.0003 and p = 0.0002, respectively), unlike the AIDNA−AIRNA mean for the 14 putative mitotically stable allelically imbalanced genes in the E6.2 polyclonal sample (p = 0.10). The right panel shows the distribution of the | AIDNA−AIRNA | observed for the putative mitotically stable allelically imbalanced genes and a random sample of size 14 in E6.2 and E15.10, and 13 in E6.43. Whenever present, abundance values are TMM-normalized counts.
FIGURE 5
FIGURE 5
Abelson clones show a higher number of genes with clonal-specific AI than lymphocytes differentiated from a single HSC. (A) Representative dot plots of pairwise comparisons of AI between different Abelson-immortalized B cell clones. Pearson’s coefficient correlation of AI and the number of genes with a significant differential AI (after the QCC test) between samples are shown. Mean abundance levels (mean TMM-normalized counts) are represented as continuous grayscale colors. (B) Correlogram with pairwise comparisons of Abelson-immortalized B cell clones. Pearson’s coefficient correlation of AI for all pairwise comparisons between samples. Each square shows the Pearson’s coefficient in the upper right corner and the number of genes with a significant differential AI in each pairwise comparison after applying QCC correction on the binomial test. (C) Two dot plots showing SDs of AIs for four monoclonal (x-axis) against four polyclonal (y-axis) HSC-derived B cell samples (left plot), and SD of AI for all four Abelson clones (x-axis) against the SD of AI for four polyclonal HSC-derived B cell samples (y-axis) (right plot). WES data were used to exclude transcripts with possible loss of heterozygosity. Dashed vertical and horizontal lines represent the threshold above which genes were considered as potentially intrinsically imbalanced and were arbitrarily set at an AI SD of 0.15. Mean abundance levels (mean TMM-normalized counts) are represented as binned grayscale colors.
FIGURE 6
FIGURE 6
Models of RME. (A) For most autosomal genes under RME, the epigenetic states leading to allelic biases are established de novo during differentiation and shortly before the genes are expressed. This model of RME is characterized by documented (e.g., olfactory receptor and antigen receptor genes) or probable clonal stability due to the existence of locks that stabilize the AI [reviewed in (Barreto et al., 2021)]. One notable lock is the negative feedback triggered by the protein expression of one allelic form that prevents further gene or allelic activation (or recombination, in the case of the antigen receptors). (B) A model of RME in which the AI for each clone is meta-stable, i.e., it can change within a certain range during extensive periods of proliferation and differentiation. Assuming that HSCs have an initial percentage of genes under RME close to that estimated for cells from collections of developmentally frozen clones grown in vitro, our data are compatible with a meta-stable model of RME.

Similar articles

References

    1. Allen E., Horvath S., Tong F., Kraft P., Spiteri E., Riggs A. D., et al. (2003). High Concentrations of Long Interspersed Nuclear Element Sequence Distinguish Monoallelically Expressed Genes. Proc. Natl. Acad. Sci. U.S.A. 100, 9940–9945. 10.1073/pnas.1737401100 - DOI - PMC - PubMed
    1. Alves-Pereira C. F., De Freitas R., Lopes T., Gardner R., Marta F., Vieira P., et al. (2014). Independent recruitment of Igh alleles in V(D)J recombination. Nat. Commun. 5, 5623–5715. 10.1038/ncomms6623 - DOI - PMC - PubMed
    1. Ayachi S., Buscarlet M., Busque L. (2020). 60 Years of Clonal Hematopoiesis Research: From X-Chromosome Inactivation Studies to the Identification of Driver Mutations. Exp. Hematol. 83, 2–11. 10.1016/j.exphem.2020.01.008 - DOI - PubMed
    1. Barlow J. H., Faryabi R. B., Callén E., Wong N., Malhowski A., Chen H. T., et al. (2013). Identification of Early Replicating Fragile Sites that Contribute to Genome Instability. Cell 152, 620–632. 10.1016/j.cell.2013.01.006 - DOI - PMC - PubMed
    1. Barreto V. M., Kubasova N., Alves-Pereira C. F., Gendrel A.-V. (2021). X-chromosome Inactivation and Autosomal Random Monoallelic Expression as "Faux Amis". Front. Cell Dev. Biol. 9, 2599. 10.3389/FCELL.2021.740937 - DOI - PMC - PubMed