

A systematic pan-cancer analysis of the gasdermin (GSDM) family of genes and their correlation with prognosis, the tumor microenvironment, and drug sensitivity
- PMID: 36003332
- PMCID: PMC9393220
- DOI: 10.3389/fgene.2022.926796
A systematic pan-cancer analysis of the gasdermin (GSDM) family of genes and their correlation with prognosis, the tumor microenvironment, and drug sensitivity
Abstract
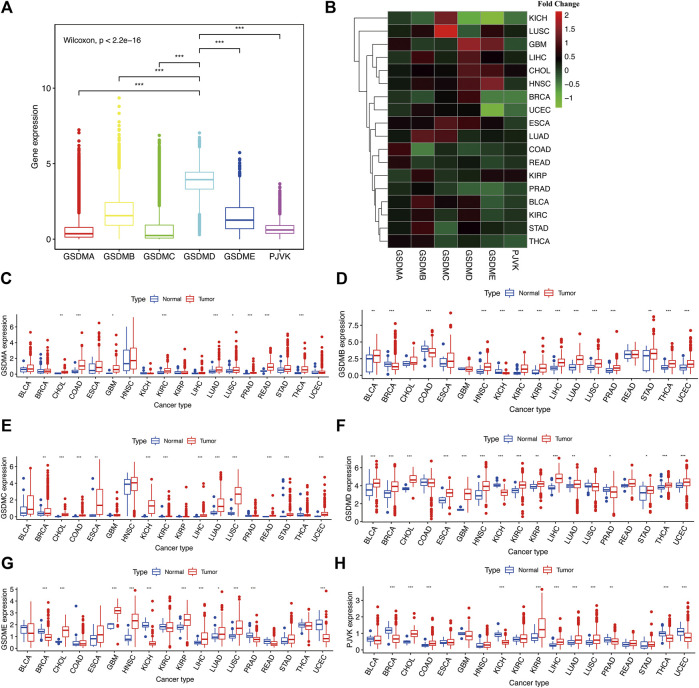
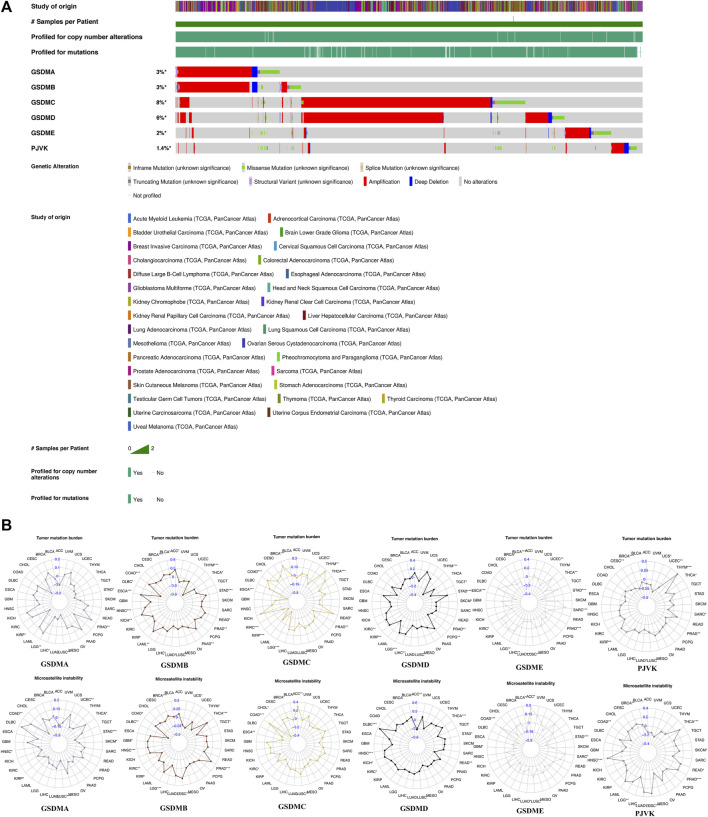
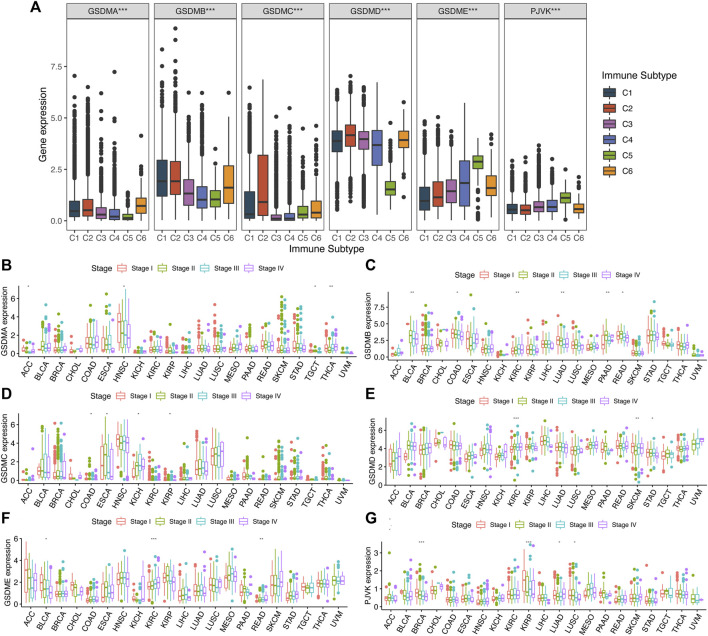
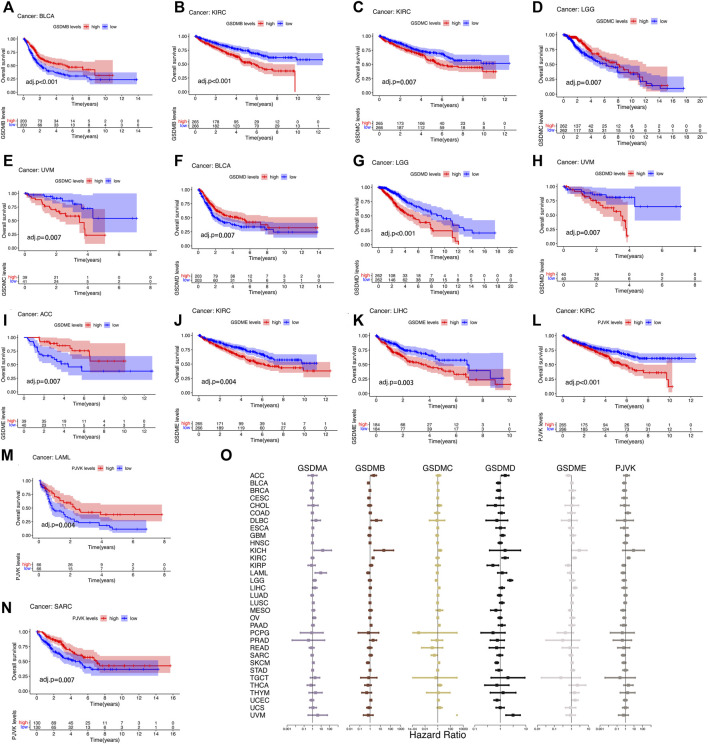
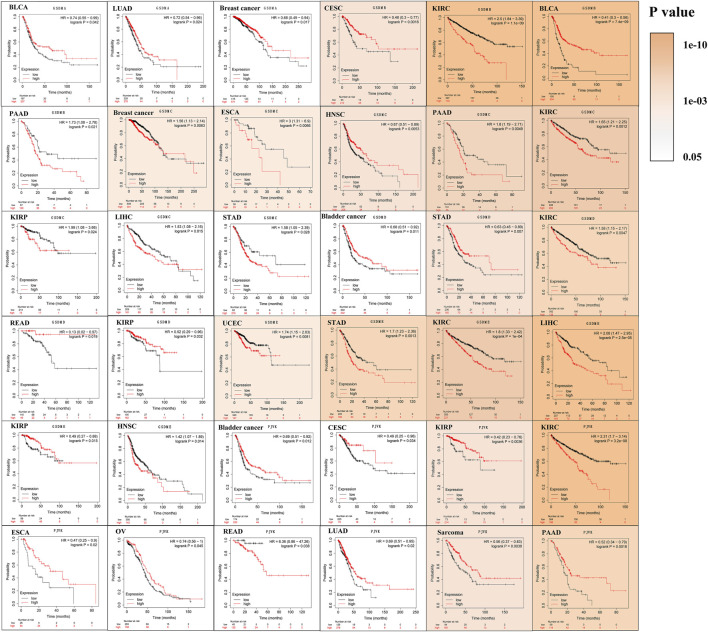
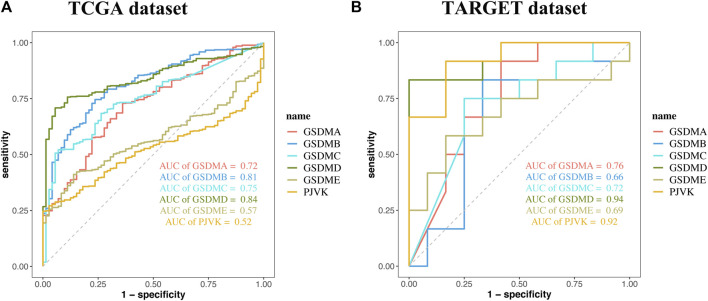
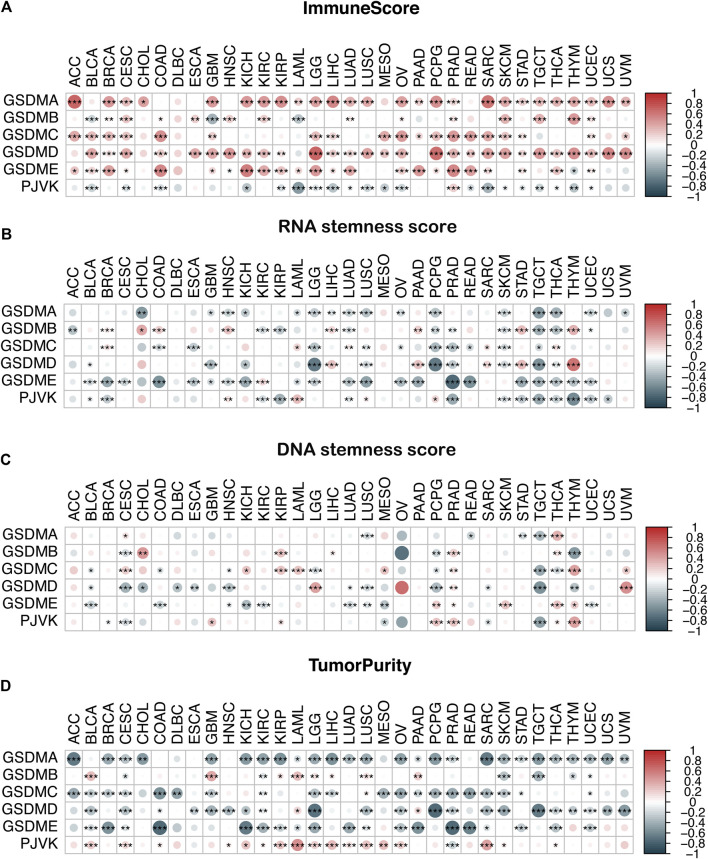
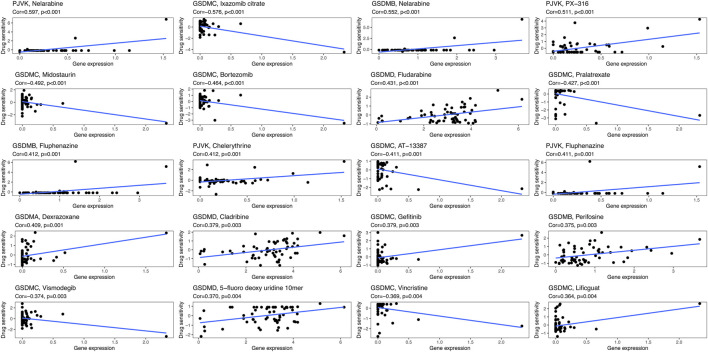
Background: Pyroptosis is a programmed cell death process mediated by the gasdermin (GSDM) protein. However, limited research has been conducted to comprehensively analyze the contribution of the GSDM family in a pan-cancer setting. Methods: We systematically evaluated the gene expression, genetic variations, and prognostic values of the GSDM family members. Furthermore, we investigated the association between the expression of GSDM genes and immune subtypes, the tumor microenvironment (TME), the stemness index, and cancer drug sensitivities by means of a pan-cancer analysis. Results: GSDM genes were highly upregulated in most of the tested cancers. Low-level mutation frequencies within GSDM genes were common across the examined types of cancer, and their expression levels were associated with prognosis, clinical characteristics, TME features, and stemness scores in several cancer types, particularly those of the urinary system. Importantly, we found that the expressions of GSDMB, GSDMC, and GSDMD were higher in kidney carcinomas, and specifically kidney renal clear cell carcinoma (KIRC); which adversely impacted the patient outcome. We showed that GSDMD was potentially the most useful biomarker for KIRC. The drug sensitivity analysis demonstrated that the expressions of GSDM genes were correlated with the sensitivity of tumor cells to treatment with chemotherapy drugs nelarabine, fluphenazine, dexrazoxane, bortezomib, midostaurin, and vincristine. Conclusion: GSDM genes were associated with tumor behaviors and may participate in carcinogenesis. The results of this study may therefore provide new directions for further investigating the role of GSDM genes as therapeutic targets in a pan-cancer setting.
Keywords: GSDM family; drug sensitivity; prognosis; pyroptosis; tumor microenvironment.
Copyright © 2022 Zheng, Yuan, Zhang and Tang.
Conflict of interest statement
The authors declare that the research was conducted in the absence of any commercial or financial relationships that could be construed as a potential conflict of interest.
Figures
Similar articles
-
A pan-cancer analysis of the expression of gasdermin genes in tumors and their relationship with the immune microenvironment.Transl Cancer Res. 2021 Sep;10(9):4125-4147. doi: 10.21037/tcr-21-1635. Transl Cancer Res. 2021. PMID: 35116710 Free PMC article.
-
GSDMB: A novel, independent prognostic marker and potential new therapeutic target in clear cell renal cell carcinoma.Oncol Lett. 2024 Jan 5;27(2):85. doi: 10.3892/ol.2024.14219. eCollection 2024 Feb. Oncol Lett. 2024. PMID: 38249806 Free PMC article.
-
Identification of gasdermin B function in the progression of renal clear cell carcinoma by a pan-cancer analysis.Discov Oncol. 2024 Nov 26;15(1):715. doi: 10.1007/s12672-024-01613-w. Discov Oncol. 2024. PMID: 39589674 Free PMC article.
-
Role of GSDMB in Pyroptosis and Cancer.Cancer Manag Res. 2020 Apr 30;12:3033-3043. doi: 10.2147/CMAR.S246948. eCollection 2020. Cancer Manag Res. 2020. PMID: 32431546 Free PMC article. Review.
-
Structural Insight of Gasdermin Family Driving Pyroptotic Cell Death.Adv Exp Med Biol. 2019;1172:189-205. doi: 10.1007/978-981-13-9367-9_9. Adv Exp Med Biol. 2019. PMID: 31628657 Review.
Cited by
-
Caspases: structural and molecular mechanisms and functions in cell death, innate immunity, and disease.Cell Discov. 2025 May 5;11(1):42. doi: 10.1038/s41421-025-00791-3. Cell Discov. 2025. PMID: 40325022 Free PMC article. Review.
-
Current evidence and therapeutic implication of PANoptosis in cancer.Theranostics. 2024 Jan 1;14(2):640-661. doi: 10.7150/thno.91814. eCollection 2024. Theranostics. 2024. PMID: 38169587 Free PMC article. Review.
-
Role of gasdermin family proteins in cancers (Review).Int J Oncol. 2023 Sep;63(3):100. doi: 10.3892/ijo.2023.5548. Epub 2023 Jul 21. Int J Oncol. 2023. PMID: 37477150 Free PMC article.
-
Regulation of gasdermins in pyroptosis and cytokine release.Adv Immunol. 2023;158:75-106. doi: 10.1016/bs.ai.2023.03.002. Epub 2023 Apr 11. Adv Immunol. 2023. PMID: 37453754 Free PMC article.
-
A seven-immune-genes risk model predicts the survival and suitable treatments for patients with skin cutaneous melanoma.Heliyon. 2023 Sep 19;9(9):e20234. doi: 10.1016/j.heliyon.2023.e20234. eCollection 2023 Sep. Heliyon. 2023. PMID: 37809963 Free PMC article.
References
-
- Croes L., Fransen E., Hylebos M., Buys K., Hermans C., Broeckx G., et al. (2019). Determination of the potential tumor-suppressive effects of gsdme in a chemically induced and in a genetically modified intestinal cancer mouse model. Cancers (Basel) 8, 1214. 10.3390/cancers11081214 - DOI - PMC - PubMed
LinkOut - more resources
Full Text Sources