. 2022 Jul 28:13:862104.
doi: 10.3389/fimmu.2022.862104. eCollection 2022.

Mass spectrometry imaging identifies altered hepatic lipid signatures during experimental Leishmania donovani infection

Affiliations

Mass spectrometry imaging identifies altered hepatic lipid signatures during experimental Leishmania donovani infection

Roel Tans et al. Front Immunol. .

Abstract

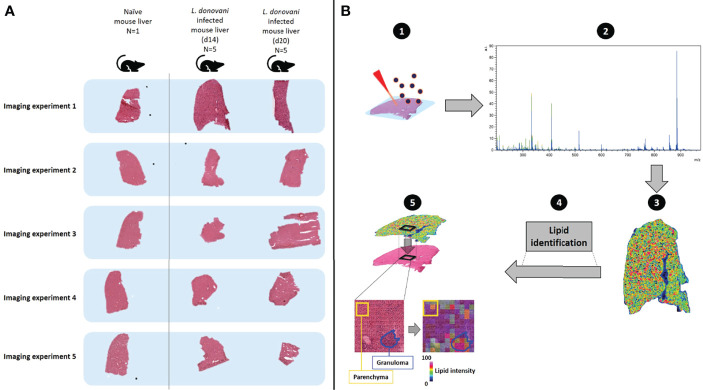
Introduction: Spatial analysis of lipids in inflammatory microenvironments is key to understand the pathogenesis of infectious disease. Granulomatous inflammation is a hallmark of leishmaniasis and changes in host and parasite lipid metabolism have been observed at the bulk tissue level in various infection models. Here, mass spectrometry imaging (MSI) is applied to spatially map hepatic lipid composition following infection with Leishmania donovani, an experimental mouse model of visceral leishmaniasis.

Methods: Livers from naïve and L. donovani-infected C57BL/6 mice were harvested at 14- and 20-days post-infection (n=5 per time point). 12 µm transverse sections were cut and covered with norhamane, prior to lipid analysis using MALDI-MSI. MALDI-MSI was performed in negative mode on a Rapiflex (Bruker Daltonics) at 5 and 50 µm spatial resolution and data-dependent analysis (DDA) on an Orbitrap-Elite (Thermo-Scientific) at 50 µm spatial resolution for structural identification analysis of lipids.

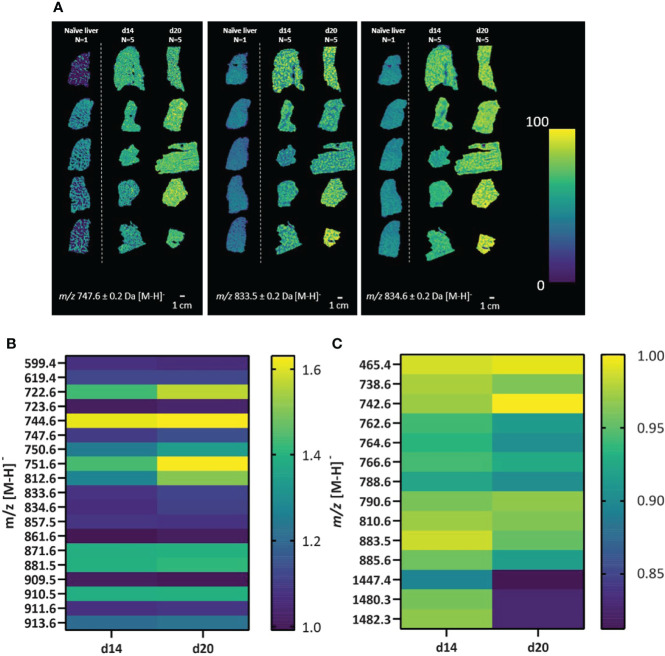
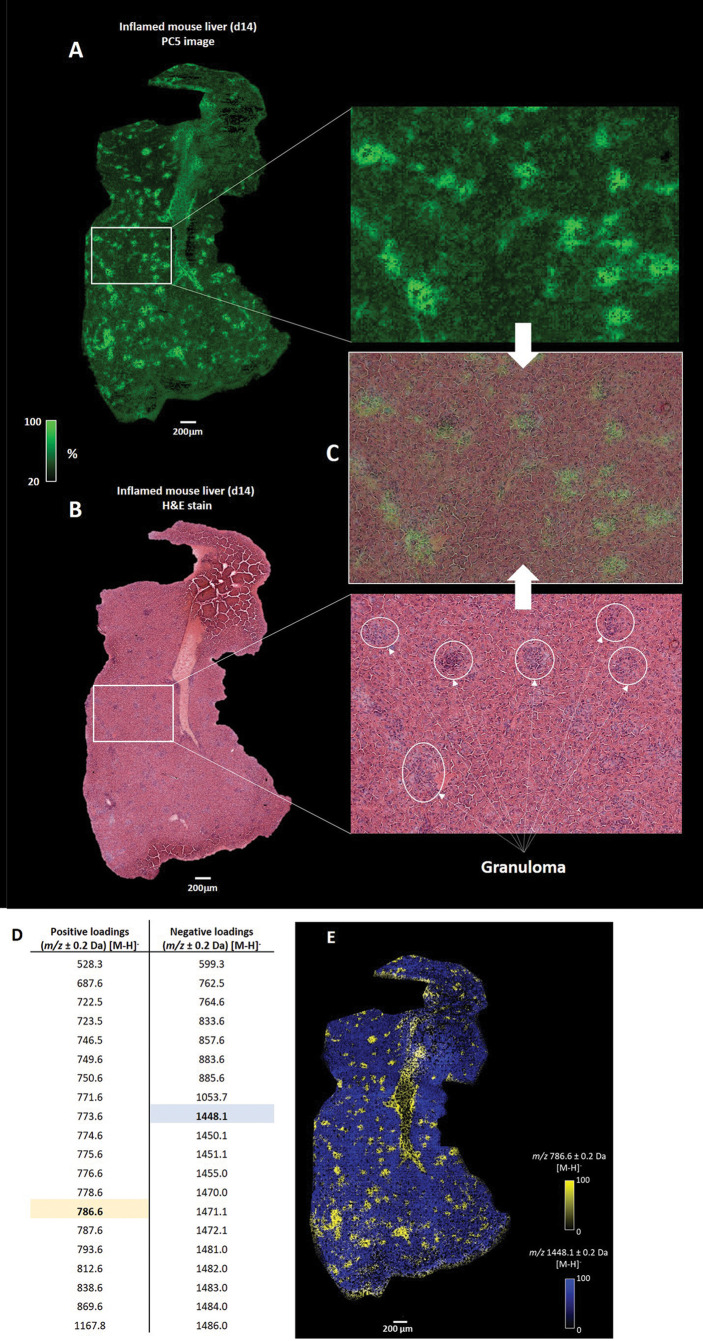
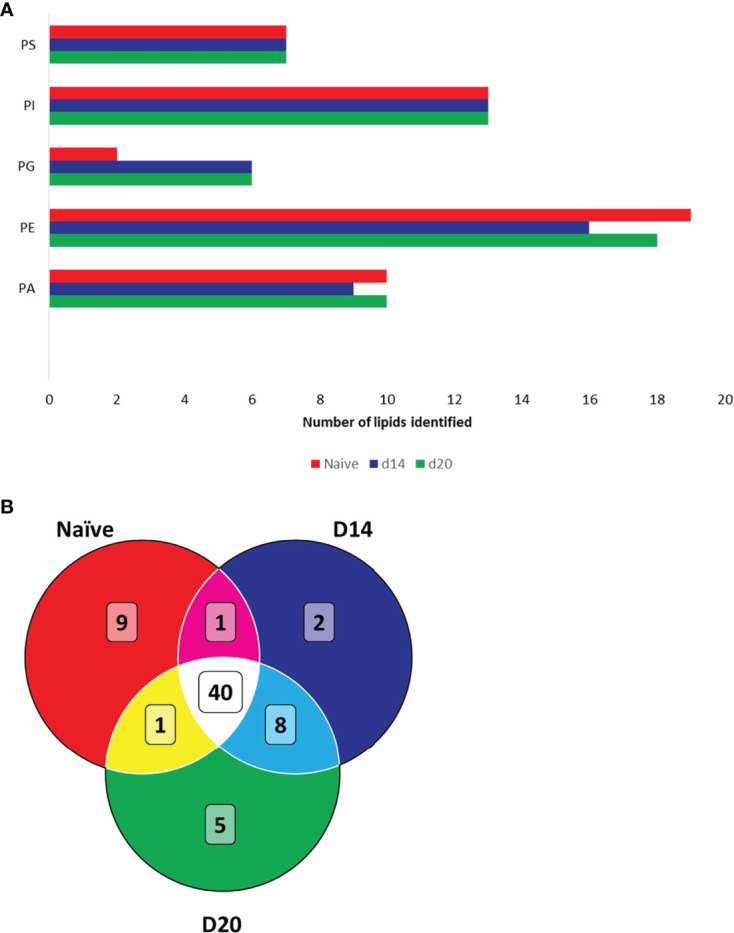
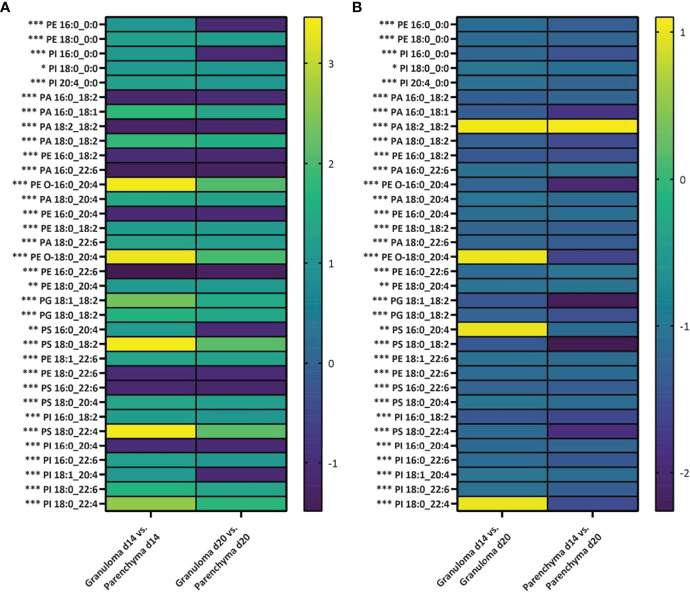
Results: Aberrant lipid abundances were observed in a heterogeneous distribution across infected mouse livers compared to naïve mouse liver. Distinctive localized correlated lipid masses were found in granulomas and surrounding parenchymal tissue. Structural identification revealed 40 different lipids common to naïve and d14/d20 infected mouse livers, whereas 15 identified lipids were only detected in infected mouse livers. For pathology-guided MSI imaging, we deduced lipids from manually annotated granulomatous and parenchyma regions of interests (ROIs), identifying 34 lipids that showed significantly different intensities between parenchyma and granulomas across all infected livers.

Discussion: Our results identify specific lipids that spatially correlate to the major histopathological feature of Leishmania donovani infection in the liver, viz. hepatic granulomas. In addition, we identified a three-fold increase in the number of unique phosphatidylglycerols (PGs) in infected liver tissue and provide direct evidence that arachidonic acid-containing phospholipids are localized with hepatic granulomas. These phospholipids may serve as important precursors for downstream oxylipin generation with consequences for the regulation of the inflammatory cascade. This study provides the first description of the use of MSI to define spatial-temporal lipid changes at local sites of infection induced by Leishmania donovani in mice.

Keywords: granulomas; inflammation; leishmania; lipids; liver; mass spectrometry imaging; spatial analysis.


Conflict of interest statement

The authors declare that the research was conducted in the absence of any commercial or financial relationships that could be construed as a potential conflict of interest.

Figures

Figure 1
Figure 1
Schematic describing workflow for monitoring spatially-resolved lipids during hepatic Leishmania donovani infection. (A) Livers were obtained from a naïve C57BL/6 mouse and from L. donovani-infected C57BL/6 mice at d14 and d20 p.i. (n=5 mice per time point). Samples were sequentially measured, using the naïve tissue as a baseline and comparator (n=1). In addition, consistency of naïve mouse livers (n=5) is shown in Figure S1. (B) The spatial distribution of lipids and their respective structural identification was assessed by MALDI-MSI (1): a chemical matrix was applied to the tissue surface – this absorbs lipids from the tissue while retaining spatial localization. Subsequently, lipids were ionized by MALDI, which generates charged ions in the gas-phase (2). A mass analyzer is used to determine the mass-to-charge (m/z) ratio of these ions from which (3) the ions can be visualized to reveal their spatial localization and relative abundance across the analyzed tissue (4). Structural identification of spatially- resolved lipids was performed by tandem mass spectrometry (5). H&E-stained tissues were co-registered with mass spectrometry images, to allow integration of molecular lipid information from annotated regions of interest (i.e. granulomas and surrounding parenchyma) with histopathology.
Figure 2
Figure 2
Alteration in lipid masses in naïve and L. donovani-infected mouse liver. Liver sections from L. donovani-infected C57BL/6 mice at d14 and d20 p.i. were compared to sections from naïve liver. (A) Spatial distributions of the relative abundance of three representative lipid masses (± 0.2 Da) in naïve, d14 and d20 livers. (B, C) Intensities of lipid masses increased in abundance (B) or decreased in abundance (C) in d14 (n=5) and d20 (n=5) mouse livers. Data are shown as relative mean fold change in infected vs naïve samples, as indicated in scale bar.
Figure 3
Figure 3
Integration of MSI and histopathology. (A) Principal component analysis (PCA) score image of the fifth principal component (PC5) shows the variance of correlated spatially-resolved lipid masses from a d14 L. donovani - infected mouse liver. (B) Post MALDI-MSI H&E staining of the tissue allows the histopathological annotation of granulomas. (C) Co-registration of the H&E-stained and the PC5 image reveals that lipid masses, correlated with the bright green regions, overlap with observed granulomas. Only a selection of granulomas are highlighted (D) Top 20 positive and negative loadings from the PC5 images, which represent the correlated lipid masses to the bright green (positive loadings) and dark green (negative loadings) regions. (E) Overlaid image of the spatial distribution of the relative abundance of m/z 786.6 (highlighted in yellow in D) and m/z 1448.1 (highlighted in blue in D).
Figure 4
Figure 4
Structural identification of lipids using FTMS. (A) Lipids identified in naïve and infected mouse liver. Bar chart displays the total number of identified lipids per lipid class. (B) Venn diagram showing overlap of identified lipids in naïve and infected liver. Phosphatidic acids (PA), phosphatidylethanolamines (PE), phosphatidylinositols (PI), phosphatidylserines (PS) and phosphatidylglycerols (PG). Lipids are detailed in Table S1.
Figure 5
Figure 5
Pathology-guided mass spectrometry imaging workflow. Figure shows the ability to deduce analyzed lipid features from morphologic regions of interest (ROI): (A) Zoomed-in histopathological characterization of granulomas (blue) and surrounding parenchyma (yellow) in L. donovani-infected mice liver (d14 p.i.). H&E-stained images are co-registered with mass spectrometry images for subsequent spatial lipid analysis from annotated granuloma and parenchymal ROIs. (B) Spatial distribution of m/z 528.2731 ± 3 ppm, (C) m/z 750.5438 ± 3 ppm and (D) 1479.8756 ± 3 ppm from the granuloma and parenchymal ROIs.
Figure 6
Figure 6
Differing abundance of lipids in granulomas and parenchyma over time of infection. Log2 fold changes in average relative intensities of lipids deduced from granulomas and parenchyma regions of interest (ROIs) from d14 and d20 p.i. (n=5 mice and 100 granulomatous and parenchymal ROIs per time point). (A) For each lipid, the fold change is presented for lipid intensity in granuloma ROIs compared to parenchymal ROIs for d14 and d20 parasitized mouse livers. (B) For each lipid, the fold change is presented for lipid intensity from granuloma or parenchymal d14 ROIs compared to granuloma or parenchymal d20 ROIs. Significance is defined as *p<0.05, **p<0.01 or ***p<0.001. P-values are adjusted for multiple comparisons. PA, phosphatidic acids; PE, phosphatidylethanolamines; PC, phosphocholine; PI, phosphatidylinositols; PS, phosphatidylserines; and PG, phosphatidylglycerols.

References

    1. Fung-Leung W-P. Phosphoinositide 3-kinase delta (PI3Kδ) in leukocyte signaling and function. Cell Signalling (2011) 23(4):603–8. doi: 10.1016/j.cellsig.2010.10.002 - DOI - PubMed
    1. Ghigo A, Damilano F, Braccini L, Hirsch E. PI3K inhibition in inflammation: Toward tailored therapies for specific diseases. Bioessays (2010) 32(3):185–96. doi: 10.1002/bies.200900150 - DOI - PubMed
    1. Ricciotti E, FitzGerald GA. Prostaglandins and inflammation. Arteriosclerosis thrombosis Vasc Biol (2011) 31(5):986–1000. doi: 10.1161/ATVBAHA.110.207449 - DOI - PMC - PubMed
    1. Dennis EA, Deems RA, Harkewicz R, Quehenberger O, Brown HA, Milne SB, et al. A mouse macrophage lipidome. J Biol Chem (2010) 285(51):39976–85. doi: 10.1074/jbc.M110.182915 - DOI - PMC - PubMed
    1. Zhang C, Wang Y, Wang F, Wang Z, Lu Y, Xu Y, et al. Quantitative profiling of glycerophospholipids during mouse and human macrophage differentiation using targeted mass spectrometry. Sci Rep (2017) 7(1):412. doi: 10.1038/s41598-017-00341-2 - DOI - PMC - PubMed

Publication types