. 2022 Aug 8:13:881722.
doi: 10.3389/fimmu.2022.881722. eCollection 2022.

Pan-Cancer Analysis of the Immunological Role of PDIA5: A Potential Target for Immunotherapy

Affiliations

Pan-Cancer Analysis of the Immunological Role of PDIA5: A Potential Target for Immunotherapy

Yu Chen et al. Front Immunol. .

Abstract

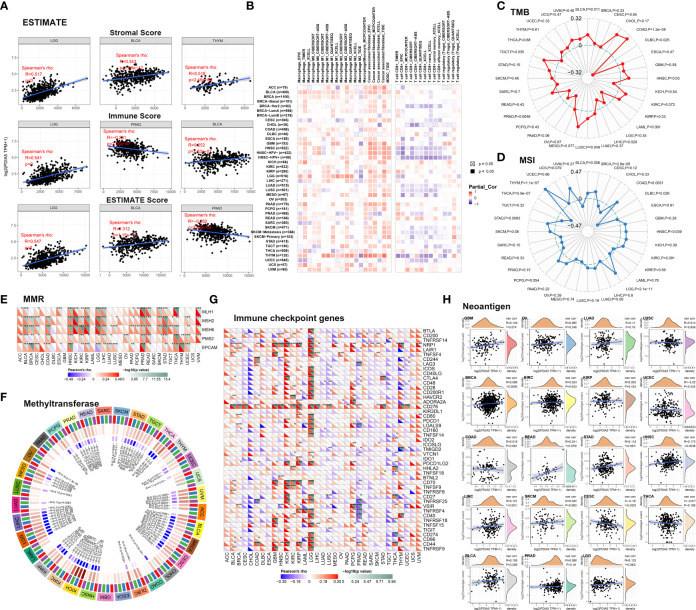
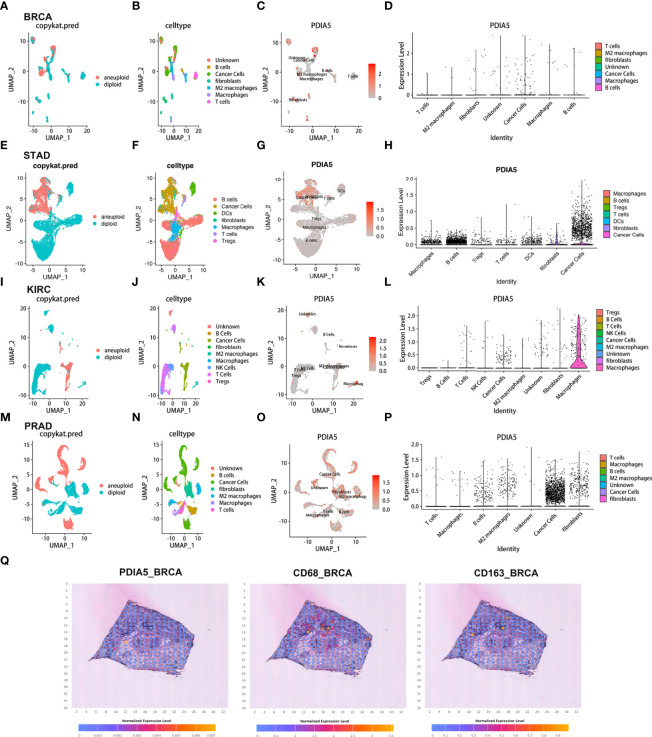
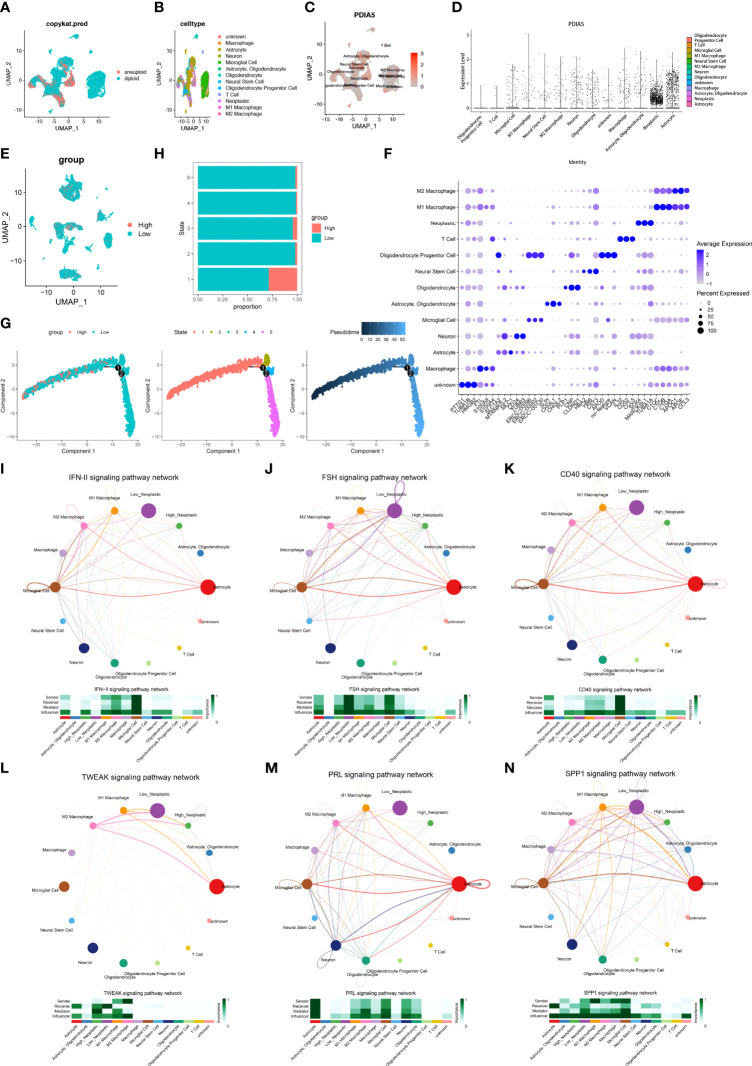
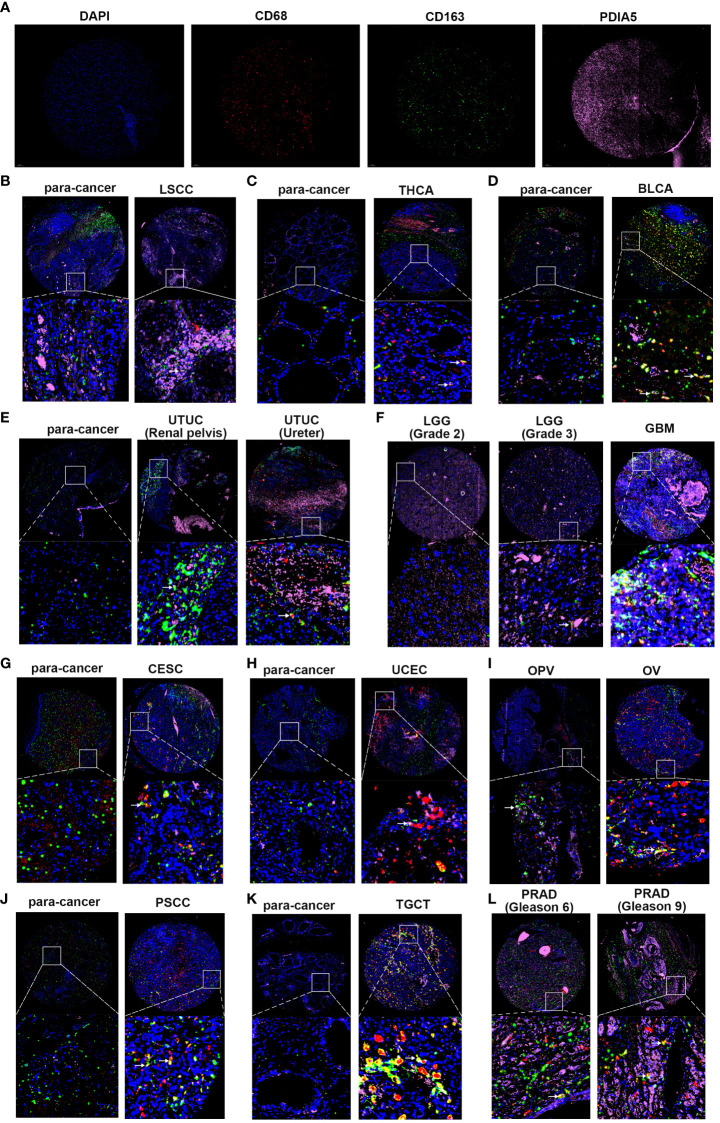
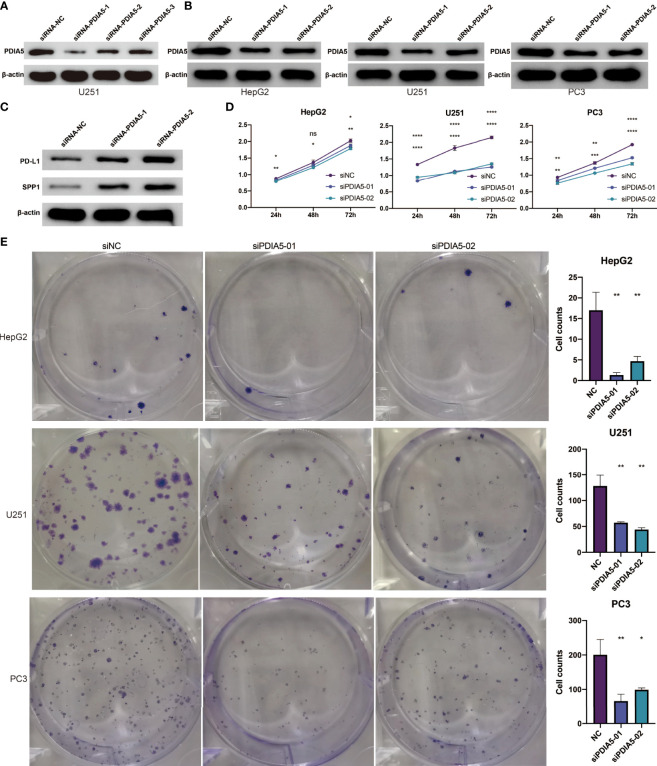
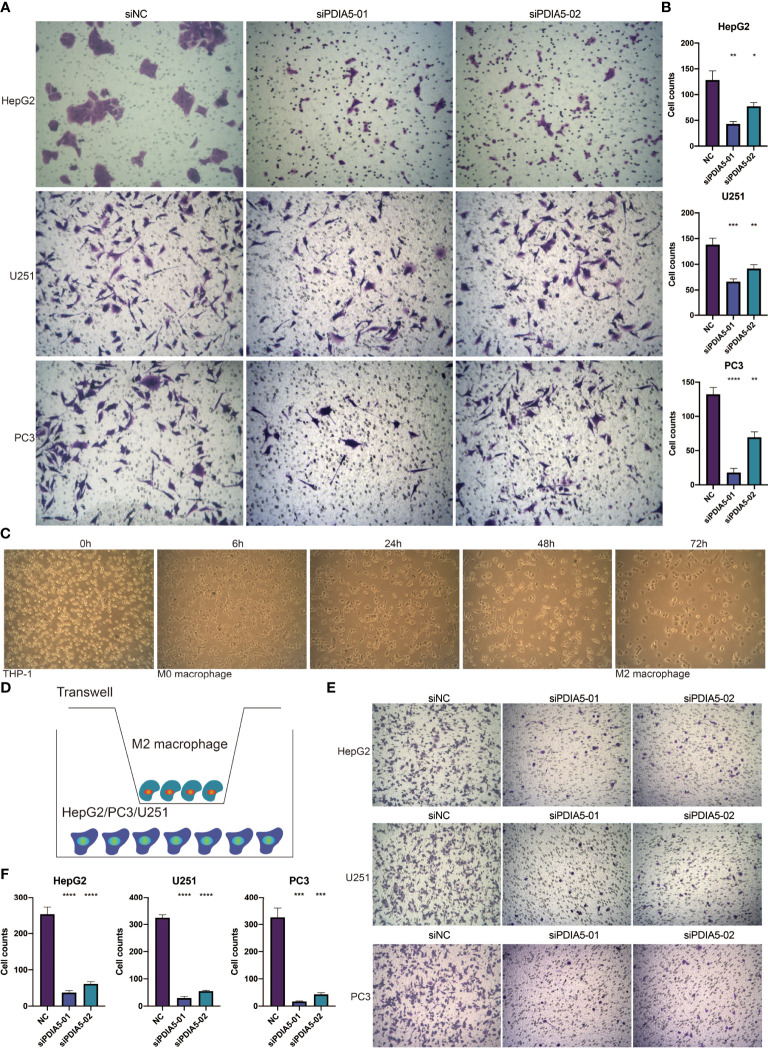
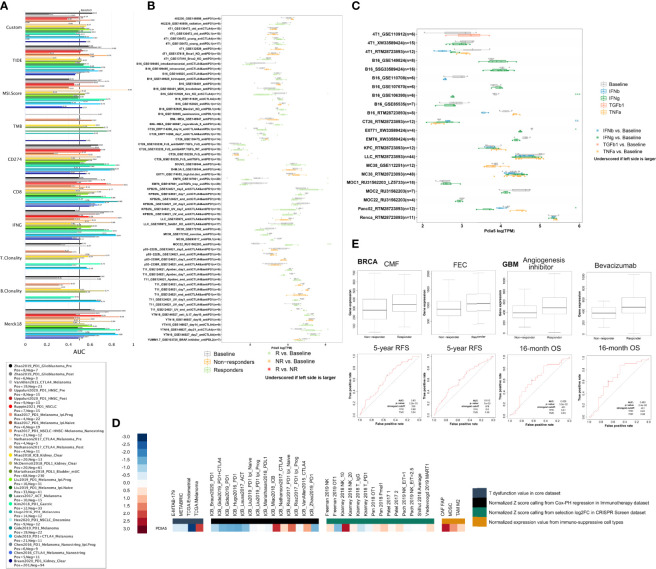
The aberrant protein disulfide isomerase A5 (PDIA5) expression was relevant to the poor prognosis of patients with human cancers. However, its relationship with the epigenetic and genetic alterations and its effect on tumor immunity is still lacking. In the present study, we comprehensively analyzed the immune infiltration role of PDIA5 in human cancers based on large-scale bioinformatics analyses and in vitro experiments. Obvious DNA methylation and moderate alteration frequency of PDIA5 were observed in human cancers. The expression level of PDIA5 was significantly correlated with infiltrated immune cells, immune pathways, and other immune signatures. We found that cancer cells and macrophages exhibited high PDIA5 expression in human cancers using the single-cell RNA sequencing analysis. We also demonstrated the interaction between PDIA5 and immune cells in glioblastoma multiforme (GBM). Multiplex immunofluorescence staining showed the upregulated expression level of PDIA5 and the increased number of M2 macrophage markers-CD163 positive cells in pan-cancer samples. Notably, PDIA5 silencing resulted in upregulated expression of PD-L1 and SPP1 in U251 cells. Silencing of PDIA5 in hepG2 cells, U251 cells, and PC3 cells contributed to a decline in their ability of proliferation, clone formation, and invasion and inhibited the migration of cocultured M2 macrophages. Additionally, PDIA5 also displayed predictive value in the immunotherapy response of both murine and human cancer cohorts. Overall, our findings indicated that PDIA5 might be a potential target for immunotherapies in cancers.

Keywords: bioinformatics; cancer immunotherapy; pan-cancer analysis; protein disulfide isomerase A5; single-cell RNA sequencing.


Conflict of interest statement

The authors declare that the research was conducted in the absence of any commercial or financial relationships that could be construed as a potential conflict of interest.

Figures

Figure 1
Figure 1
PDIA5 correlates with immune infiltration in human cancers. (A) The correlations between PDIA5 and stromal score, immune score, and ESTIMATE score. (B) The relationships between PDIA5 and immune cells. (C) The correlation analysis of PDIA5 and tumor mutational burden (TMB). (D) The correlation analysis regarding PDIA5 and microsatellite instability (MSI). (E) The relationships between the expression of PDIA5 and five mismatch repair (MMR) genes. (F) The correlation analysis regarding PDIA5 and four DNA methyltransferases. Red, blue, green, and purple represents DNMT1, DNMT2, DNMT3a, and DNMT3b. (G) The correlations between PDIA5 and immune checkpoint genes. (H) The correlation analysis of PDIA5 and the numbers of tumor neoantigens. The symbols “*”, “**”, and “***” mean p<0.05, p<0.01, and p<0.001, respectively.
Figure 2
Figure 2
The scRNA-seq results of PDIA5 expression in pan-cancers. The definition of tumor cells in BRCA (A), STAD (E), KIRC (I), and PRAD (M). The cells were categorized into different clusters in BRCA (B), STAD (F), KIRC (J), and PRAD (N). The scatter plots depict the PDIA5 expression distribution of different cell clusters in BRCA (C), STAD (G), KIRC (K), and PRAD (O). The violin plot visualizes the distribution of PDIA5 expression of different cell clusters in BRCA (D), STAD (H), KIRC (L), and PRAD (P). (Q) The spatial transcriptomics of PDIA5, CD68, and CD163 in BRCA.
Figure 3
Figure 3
The scRNA-seq results of PDIA5 expression in GBM. (A) The definition of neoplastic cells in GBM. (B)The cells were categorized into 13 clusters in GBM. (C) The scatter plots visualize the PDIA5 expression distribution of different cell clusters in GBM. (D) The violin plot depicts the PDIA5 expression of varying cell clusters in GBM. (E) The visualization of the high and low expression levels of PDIA5 in all cell types. The red color represents those cells with high PDIA5 expression, while the blue represents low PDIA5 expression. (F) The differentially expressed genes (DEGs) among the 13 cell types in GBM. (G) The single-cell trajectory of neoplastic cells includes four branches. Cells are colored based on PDIA5 expression (left), state (middle), and pseudotime (right). (H) The proportion of cells with high and low PDIA5 levels in each state. (I–N) The signaling pathways involved in the correlations between neoplastic cells and immune cells in GBM: (I) IFN-II, (J) FSH, (K) CD40, (L) TWEAK, (M) PRL, and (N) SPP1 signaling pathway.
Figure 4
Figure 4
Multiplex immunofluorescence staining in pan-cancer samples and the corresponding para-cancerous tissues (para-cancer). (A) The representative image of DAPI, CD68, CD163, and PDIA5 staining in pan-cancer samples, respectively. Blue represents the DAPI-stained nucleus; red, green, and pink represent CD68-positive cells, CD163-positive cells, and PDIA5-positive cells. (B) laryngeal squamous cell carcinoma (LSCC), (C) thyroid carcinoma (THCA), (D) bladder urothelial carcinoma (BLCA), (E) urinary tract urothelial carcinoma (UTUC), (F) lower-grade glioma (LGG) and glioblastoma multiforme (GBM), (G) cervical squamous cell carcinoma and endocervical adenocarcinoma (CESC), (H) uterine corpus endometrial carcinoma (UCEC), (I) ovarian serous papillary cystadenocarcinoma (OPV) and ovarian serous cystadenocarcinoma (OV), (J) penis squamous cell carcinoma (PSCC), (K) testicular germ cell tumors (TGCT), (L) prostate adenocarcinoma (PRAD). The white arrow shows PDIA5 and CD163 double-positive cells, 10× amplification.
Figure 5
Figure 5
PDIA5 regulates the expression of PD-L1 and SPP1 in U251 cells and promotes the proliferation and clone formation of hepG2, U251, and PC3 cells. (A) The transduction results of different PDIA5 siRNA are verified using western blotting. (B) The protein expression level of PDIA5 in hepG2, U251, and PC3 cells after transfection with siRNA-PDIA5-1 and siRNA-PDIA5-2. (C) The protein expression level of PD-L1 and SPP1 in U251 cells after transfection with siRNA-PDIA5-1 and siRNA-PDIA5-2. (D) The cell proliferation of hepG2, U251, and PC3 cells after transfection of siRNA-PDIA5-1 and siRNA-PDIA5-2. (E) The clone formation of hepG2, U251, and PC3 cells after transfection of siRNA-PDIA5-1 and siRNA-PDIA5-2. Data are displayed as mean ± SD based on three independent experiments. *p < 0.05, **p < 0.01, ***p < 0.001, and ****p< 0.0001 compared with the normal control (NC) group. ns, no significance.
Figure 6
Figure 6
PDIA5 mediates the invasion of tumor cells and the migration of M2 macrophages. (A, B) The invasion of hepG2, U251, and PC3 cells after transfection of siRNA-PDIA5-1 and siRNA-PDIA5-2. (C) The induction process and morphology of M2 macrophages. (D) The schematic diagram illustrates the coculture of M2 macrophages and hepG2, U251, or PC3 cells. (E, F) The migration of M2 macrophages after being cocultured with hepG2, U251, and PC3 cells transfected with siRNA-PDIA5-1 and siRNA-PDIA5-2. Data are displayed as mean ± SD based on three independent experiments. *p < 0.05, **p < 0.01, ***p < 0.001, and ****p < 0.0001 compared with the normal control (NC) group.
Figure 7
Figure 7
PDIA5 exhibits predictive value in immunotherapy response. (A) The PDIA5’s predictive power of response outcomes and overall survival (OS) in human immunotherapy cohorts. (B) The predictive value of PDIA5 in murine immunotherapy cohorts. (C) The expression levels of PDIA5 across cell lines between pre-and post-cytokine-treated groups. *p < 0.05, **p < 0.01, and ***p < 0.001 compared with the Baseline group. (D) The expression level of PDIA5 in different datasets. (E) The predictive value of PDIA5 in response to therapy in BRCA and GBM. RFS, relapse-free survival; OS, overall survival.

Similar articles

Cited by

References

    1. Nishikawa H, Koyama S. Mechanisms of Regulatory T Cell Infiltration in Tumors: Implications for Innovative Immune Precision Therapies. J immunother Cancer (2021) 9(7):e002591. doi: 10.1136/jitc-2021-002591 - DOI - PMC - PubMed
    1. Sung H, Ferlay J, Siegel RL, Laversanne M, Soerjomataram I, Jemal A, et al. . Global Cancer Statistics 2020: GLOBOCAN Estimates of Incidence and Mortality Worldwide for 36 Cancers in 185 Countries. CA: Cancer J Clin (2021) 71(3):209–49. doi: 10.3322/caac.21660 - DOI - PubMed
    1. Siegel RL, Miller KD, Jemal A. Cancer Statistics, 2020. CA: Cancer J Clin (2020) 70(1):7–30. doi: 10.3322/caac.21590 - DOI - PubMed
    1. Zhang H, Dai Z, Wu W, Wang Z, Zhang N, Zhang L, et al. . Regulatory Mechanisms of Immune Checkpoints PD-L1 and CTLA-4 in Cancer. J Exp Clin Cancer Res CR (2021) 40(1):184. doi: 10.1186/s13046-021-01987-7 - DOI - PMC - PubMed
    1. Riemer J, Bulleid N, Herrmann JM. Disulfide Formation in the ER and Mitochondria: Two Solutions to a Common Process. Sci (New York NY) (2009) 324(5932):1284–7. doi: 10.1126/science.1170653 - DOI - PubMed

Substances