. 2022 Aug 8:13:892331.
doi: 10.3389/fimmu.2022.892331. eCollection 2022.

Evaluation of serological response to anti-SARS-CoV-2 mRNA vaccination in hematological patients

Affiliations

Evaluation of serological response to anti-SARS-CoV-2 mRNA vaccination in hematological patients

Sara Pasquina Pascale et al. Front Immunol. .

Abstract

Introduction: In immunocompromised patients, SARS-CoV-2 mRNA vaccine has been used in Italy from the beginning of the vaccination campaign, but several studies have shown that the serological response of onco-hematological patients was reduced compared to healthy subjects, due to the state of immunosuppression because of both underlying disease and administered therapy.

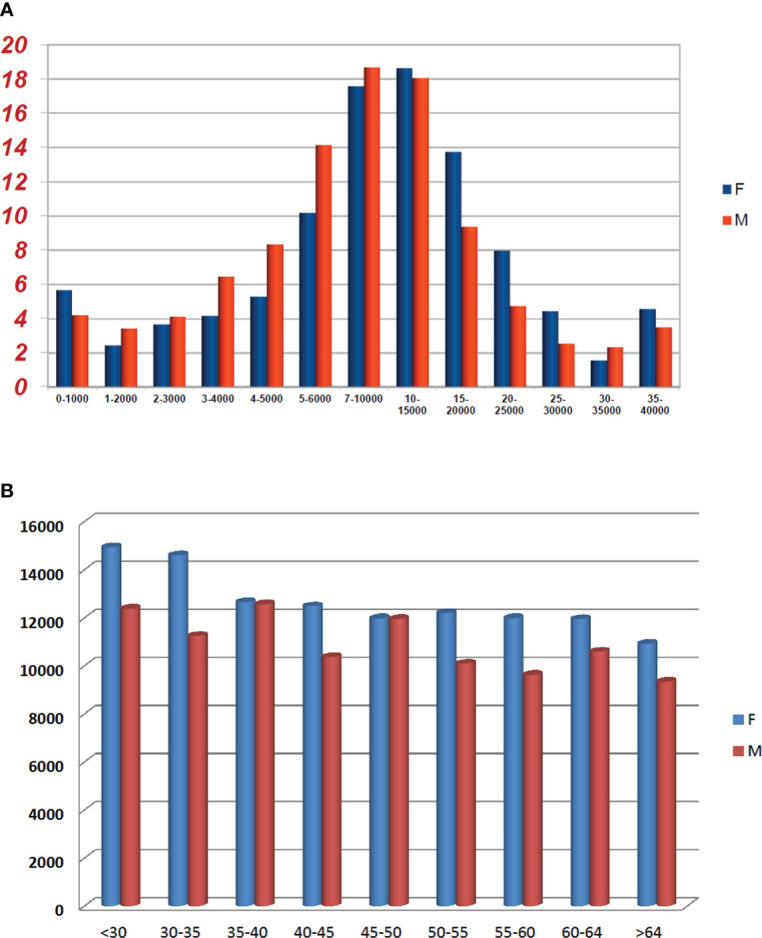
Methods: We evaluated the association of anti-SARS-CoV-2 spike IgG titers in 215 hematological patients with clinical and demographic variables to verify if it was possible to identify predictive parameters of serological response, as well as using a control group, consisting of healthy health workers of San Carlo Hospital in Potenza. Anti-SARS-CoV2 IgG titers were evaluated after 30-45 days post second dose vaccine using chemiluminescent microparticle immunoassay technology.

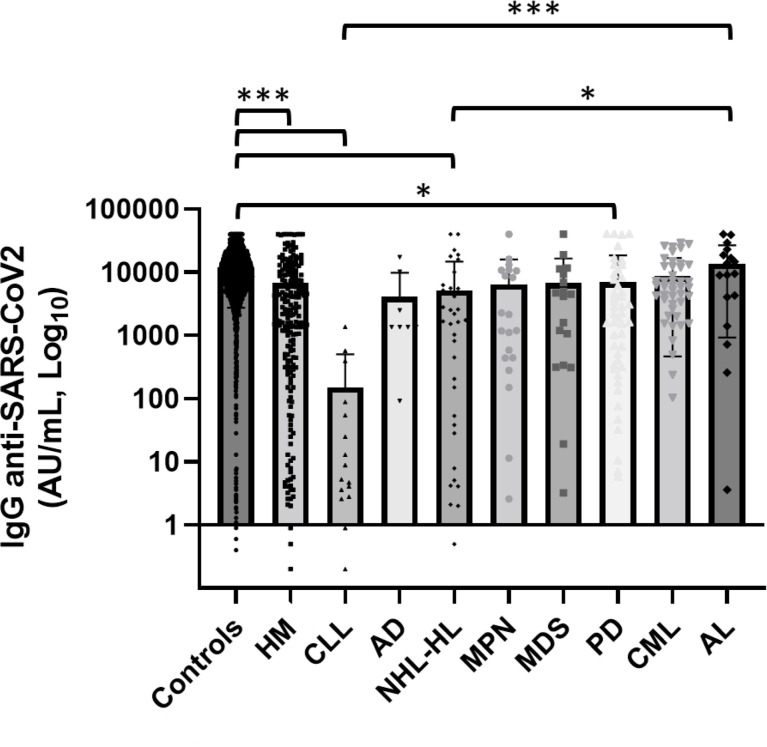
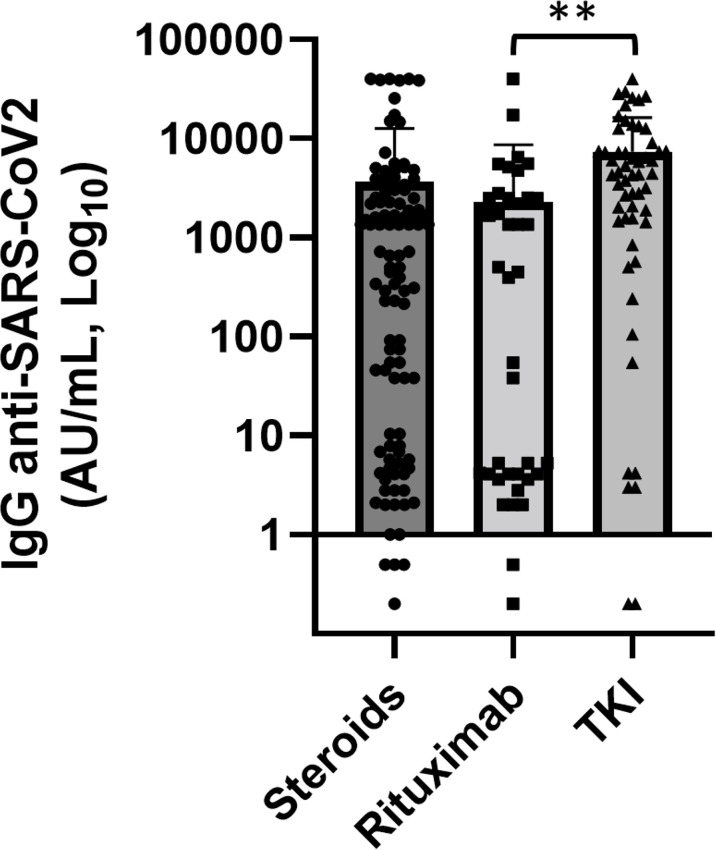
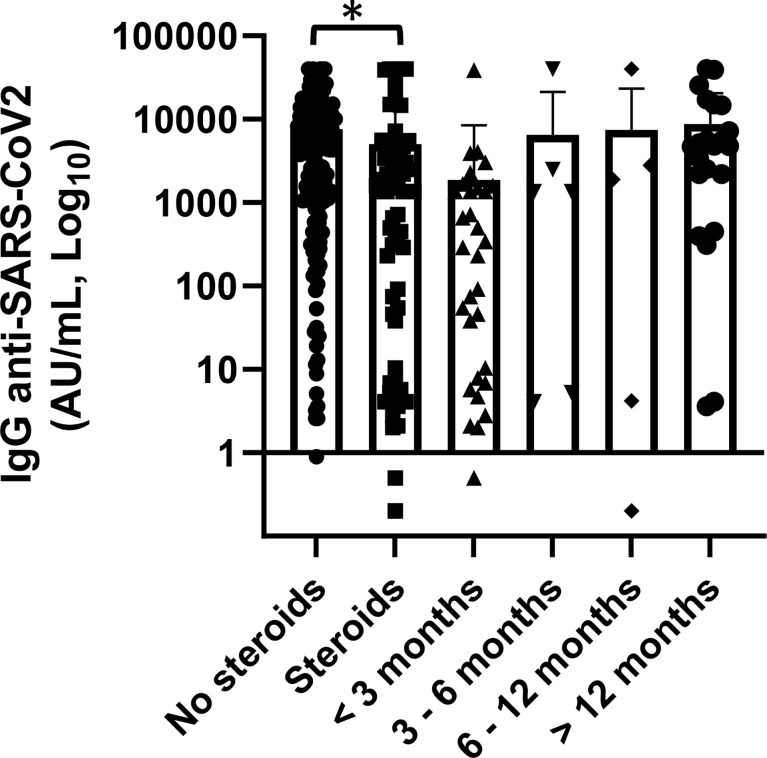
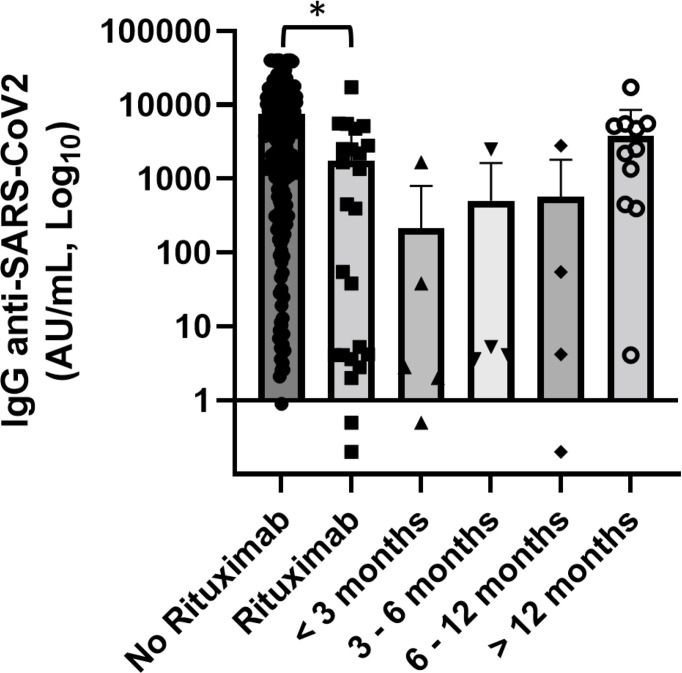
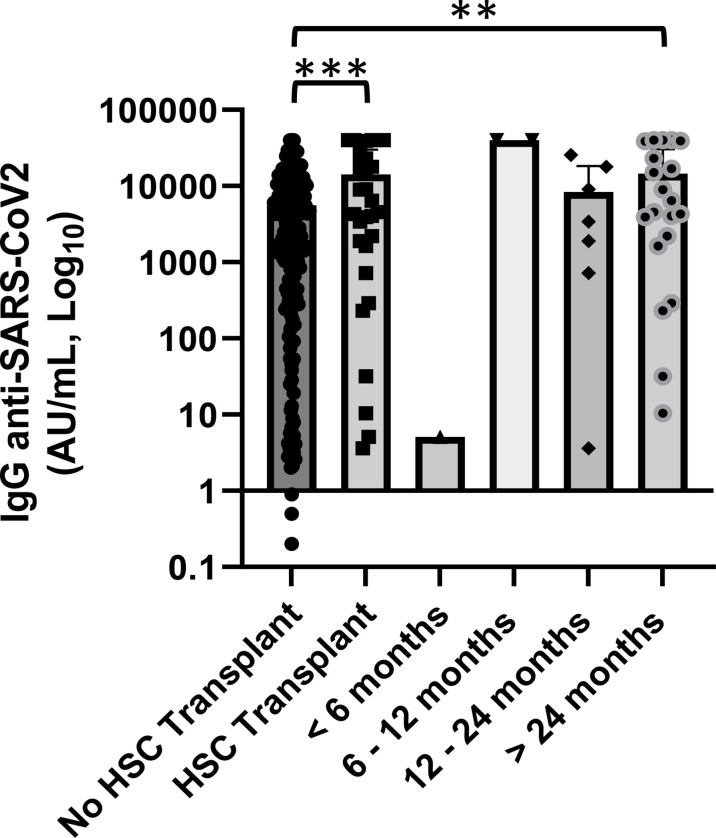
Results: Patients with hematological malignancies, compared with the control arm, had both a mean concentration of anti-SARS-CoV-2 IgG significantly lower and a seroconversion rate numerically lower. All chronic lymphatic leukemia patients showed levels of antibody titer below the mean concentration, also in only clinical surveillance patients. Comparing serological response in hematological malignancies, only acute leukemia patients who were off therapy had the highest seroconversion rate among the patients' cohorts and a mean antibody concentration greater than the control arm. Patients treated with steroids and rituximab showed a lower level of anti-SARS-CoV-2 spike IgG. Differences in anti-spike IgG levels among chronic myeloid leukemia patients stratified according to tyrosine kinase inhibitor therapy and molecular response were observed, and they could have interesting implications on the evaluation of the effects of these drugs on the immune system, but having not reached statistical significance at the moment. The cohort of patients who received a stem cell transplant was very heterogeneous because it included different hematological malignancies and different types of transplant; however, a mean concentration of anti-SARS-CoV2 IgG greater than the control arm was reported. Indeed, among patients who performed a transplant for over 6 months only one had a spike IgG concentration below the cutoff.

Conclusions: Our data confirm reduced serological response in hematological patients after anti-SARS-CoV-2 vaccination. However, we found a great diversity of SARS-CoV-2 antibody response according to types of pathologies and therapies.

Keywords: SARS-COV-2; anti-spike IgG; hematological malignancies; mRNA vaccination; onco-hematology.


Conflict of interest statement

The authors declare that the research was conducted in the absence of any commercial or financial relationships that could be construed as a potential conflict of interest.

Figures

Figure 1
Figure 1
Comparison between sexes in the control group according to anti-SARS-CoV-2 concentrations (A) and age (B). (A) Proportion of healthy subjects by sex and different IgG anti-SARS-CoV-2 concentration (AU/mL × 103) groups. (B) IgG anti-SARS-CoV-2 mean concentration stratified by sex and age groups.
Figure 2
Figure 2
Comparison of serological response among different hematological malignancies and the comparator arm. HM, hematological malignancies; CLL, chronic lymphatic leukemia; AD, autoimmune disorder; NHL, non-Hodgkin lymphoma; HL, Hodgkin lymphoma; MPN, myeloproliferative neoplasm; MDS, myelodysplastic syndrome; PD, plasms cell disorder; CML, chronic myeloid leukemia; AL, acute leukemia; HSCT, hematopoietic stem cell transplantation. Hematological patients had a significantly lower level of anti-SARS-CoV-2 IgG than the control group (p < 0.001). CLL and lymphoma patients showed lower anti-SARS-CoV-2 IgG concentrations than AL patients (respectively p < 0.0001 and p = 0.008). Differences assessed by one-way ANOVA test (p < 0.001), Bonferroni post-hoc test: (*) p < 0.05; (**) p < 0.005; (***) p < 0.001. Error bars correspond to standard deviation calculated from the mean of relative concentrations. Values below black line were corresponding to anti-SARS-CoV-2 IgG lower than 10.0 AU/ml, and values of 0 AU/ml were not shown since the graph was on a log scale.
Figure 3
Figure 3
Association of anti-SARS-CoV2 IgG concentrations with various anticancer treatments. Patients treated with rituximab (n = 30) showed significantly lower levels of anti-SARS-CoV-2 IgG than patients treated with tyrosine kinase inhibitors (TKI) (n = 44) (p = 0.004). Differences assessed by one-way ANOVA test (p = 0.005), Bonferroni post-hoc test: (**) p < 0.005. Error bars correspond to standard deviation calculated from the mean of relative concentrations. Values below the black line correspond to anti-SARS-CoV-2 IgG lower than 10.0 AU/ml, and values of 0 AU/ml were not shown since the graph is on a log scale.
Figure 4
Figure 4
Association of anti-SARS-CoV2 IgG concentrations with steroid therapy and distance from the end of steroid treatment. Patients treated with steroid therapy (n = 70) showed significantly lower levels of anti-SARS-CoV-2 IgG than patients with did not receive them (p = 0.045). Differences assessed by t-test, (*) p < 0.05. Error bars correspond to standard deviation calculated from the mean of relative concentrations. Values below the black line correspond to anti-SARS-CoV-2 IgG lower than 10.0 AU/ml, and values of 0 AU/ml were not shown since the graph is on a log scale.
Figure 5
Figure 5
Association of anti-SARS-CoV2 IgG concentrations with anti-CD20 therapy and distance from the end of anti-CD20 treatment. Patients treated with rituximab (n = 30) showed significantly lower levels of anti-SARS-CoV-2 IgG than patients did not receive anti-CD20 treatment. Differences assessed by one-way ANOVA test (p = 0.003), Bonferroni post-hoc test: (*) p < 0.05. Error bars correspond to standard deviation calculated from the mean of relative concentrations. Values below the black line correspond to anti-SARS-CoV-2 IgG lower than 10.0 AU/ml, and values of 0 AU/ml were not shown since the graph is on a log scale.
Figure 6
Figure 6
Association of anti-SARS-CoV2 IgG concentrations with hematopoietic stem cell (HSC) transplant and distance from day 0 of infusion. Patients who received an HSC transplant showed a significantly lower level of anti-SARS-CoV-2 IgG than patients who did not perform (p < 0.001). Differences assessed by one-way ANOVA test (p < 0.001), Bonferroni post-hoc test: (***) p < 0.001. Statistical analysis was not done for groups of patients with a median follow-up since day 0 of infusion <12 months because of small number of cases. Error bars correspond to standard deviation calculated from the mean of relative concentrations. Values below the black line correspond to anti-SARS-CoV-2 IgG lower than 10.0 AU/ml, and values of 0 AU/ml were not shown since the graph is on a log scale. **p<0.01.
Figure 7
Figure 7
Association of anti-SARS-CoV-2 IgG concentrations with side effects. Patients who experienced more symptoms showed anti-SARS-CoV-2 IgG titer greater than patients who did not report side effect or only mild pain. Differences assessed by one-way ANOVA test (p < 0.001), Bonferroni post-hoc test: (*) p < 0.05; (**) p < 0.005. Error bars correspond to standard deviation calculated from the mean of relative concentrations. Values below the black line correspond to anti-SARS-CoV-2 IgG lower than 10.0 AU/ml, and values of 0 AU/ml were not shown since the graph is on a log scale.

Similar articles

Cited by

References

    1. Horby P, Lim WS, Emberson JR, Mafham M, Bell JL, Linsell L, et al. . Dexamethasone in hospitalized patients with covid-19. N Engl J Med (2021) 384:693–704. doi: 10.1056/NEJMoa2021436 - DOI - PMC - PubMed
    1. Conti P, Ronconi G, Caraffa A, Gallenga CE, Ross R, Frydas I, et al. . Induction of pro-inflammatory cytokines (IL-1 and IL-6) and lung inflammation by coronavirus-19 (COVI-19 or SARS-CoV-2): anti-inflammatory strategies. J Biol Regul Homeost Agents (2020) 34:327–31. doi: 10.23812/CONTI-E - DOI - PubMed
    1. Rosas IO, Bräu N, Waters M, Go RC, Hunter BD, Bhagani S, et al. . Tocilizumab in hospitalized patients with severe covid-19 pneumonia. N Engl J Med (2021) 384:1503–16. doi: 10.1056/NEJMoa2028700 - DOI - PMC - PubMed
    1. Simonovich VA, Burgos Pratx LD, Scibona P, Beruto MV, Vallone MG, Vázquez C, et al. . A randomized trial of convalescent plasma in covid-19 severe pneumonia. N Engl J Med (2021) 384:619–29. doi: 10.1056/NEJMoa2031304 - DOI - PMC - PubMed
    1. Spinner CD, Gottlieb RL, Criner GJ, Arribas López JR, Cattelan AM, Soriano Viladomiu A, et al. . Effect of remdesivir vs standard care on clinical status at 11 days in patients with moderate COVID-19: A randomized clinical trial. JAMA (2020) 324:1048–57. doi: 10.1001/jama.2020.16349 - DOI - PMC - PubMed