Association Between State Opioid Prescribing Cap Laws and Receipt of Opioid Prescriptions Among Children and Adolescents
- PMID: 36003417
- PMCID: PMC9356320
- DOI: 10.1001/jamahealthforum.2022.2461
Association Between State Opioid Prescribing Cap Laws and Receipt of Opioid Prescriptions Among Children and Adolescents
Abstract
Importance: High-dose and long-duration opioid prescriptions remain relatively common among children and adolescents, but there is insufficient research on the association of state laws limiting the dose and/or duration of opioid prescriptions (referred to as opioid prescribing cap laws) with opioid prescribing for this group.
Objective: To examine the association between state opioid prescribing cap laws and the receipt of opioid prescriptions among children and adolescents.
Design setting and participants: This repeated cross-sectional study used a difference-in-differences approach accounting for staggered policy adoption to assess the association of state opioid prescribing cap laws in the US from January 1, 2013, to December 31, 2019, with receipt of opioid prescriptions among children and adolescents. Analyses were conducted between March 22 and December 15, 2021. Data were obtained from the OptumLabs Data Warehouse, a national commercial insurance claims database. The analysis included 482 118 commercially insured children and adolescents aged 0 to 17 years with full calendar-year continuous insurance enrollment between 2013 and 2019. Individuals were included for every year in which they were continuously enrolled; they did not need to be enrolled for the entire 7-year study period. Those with any cancer diagnosis were excluded from analysis.
Exposure: Implementation of a state opioid prescribing cap law between January 1, 2017, and July 1, 2019. This date range allowed analysis of the same number years for both pre-cap and post-cap data.
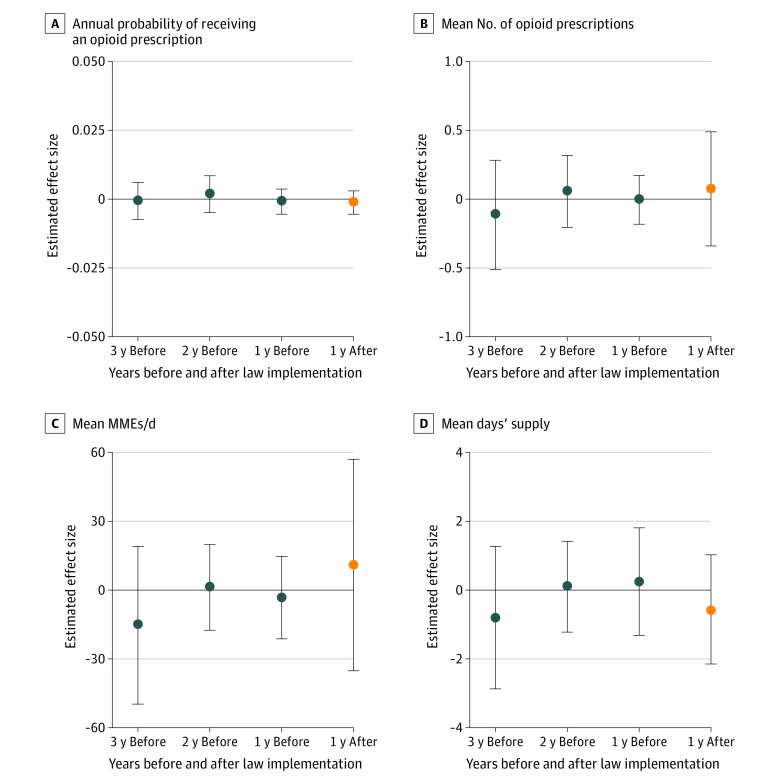
Main outcomes and measures: Outcomes of interest included receipt of any opioid prescription and, among those with at least 1 opioid prescription, the mean number of opioid prescriptions, mean morphine milligram equivalents (MMEs) per day, and mean days' supply.
Results: Among 482 118 children and adolescents (754 368 person-years of data aggregated to the state-year level), 245 178 (50.9%) were male, with a mean (SD) age of 9.8 (4.8) years at the first year included in the sample (data on race and ethnicity were not collected as part of this data set, which was obtained from insurance billing claims). Overall, 10 659 children and adolescents (2.2%) received at least 1 opioid prescription during the study period. Among those with at least 1 prescription, the mean (SD) number of filled opioid prescriptions was 1.2 (0.8) per person per year. No statistically significant association was found between state opioid prescribing cap laws and any outcome. After opioid prescribing cap laws were implemented, a -0.001 (95% CI, -0.005 to 0.002) percentage point decrease in the proportion of youths receiving any opioid prescription was observed. In addition, percentage point decreases of -0.01 (95% CI, -0.10 to 0.09) in high-dose opioid prescriptions (>50 MMEs per day) and -0.02 (95% CI, -0.12 to 0.08) in long-duration opioid prescriptions (>7 days' supply) were found after cap laws were implemented.
Conclusions and relevance: In this cross-sectional study, no association was observed between state opioid prescribing cap laws and the receipt of opioid prescriptions among children and adolescents. Alternative strategies, such as opioid prescribing guidelines tailored to youths, are needed.
Copyright 2022 Stone EM et al. JAMA Health Forum.
Conflict of interest statement
Conflict of Interest Disclosures: Dr Bicket reported receiving grants from the Centers for Disease Control and Prevention, the Michigan Department of Health and Human Services, and the National Institutes of Health and personal fees from Alosa Health and axialHealthcare outside the submitted work. No other disclosures were reported.
Figures


Similar articles
-
Effects of state opioid prescribing cap laws on opioid prescribing after surgery.Health Serv Res. 2022 Oct;57(5):1154-1164. doi: 10.1111/1475-6773.14023. Epub 2022 Jul 29. Health Serv Res. 2022. PMID: 35801988 Free PMC article.
-
Indication-Specific Opioid Prescribing for US Patients With Medicaid or Private Insurance, 2017.JAMA Netw Open. 2020 May 1;3(5):e204514. doi: 10.1001/jamanetworkopen.2020.4514. JAMA Netw Open. 2020. PMID: 32391892 Free PMC article.
-
Effects of State Opioid Prescribing Laws on Use of Opioid and Other Pain Treatments Among Commercially Insured U.S. Adults.Ann Intern Med. 2022 May;175(5):617-627. doi: 10.7326/M21-4363. Epub 2022 Mar 15. Ann Intern Med. 2022. PMID: 35286141 Free PMC article.
-
The effect of targeted insurer-mandated prescription monitoring on opioid prescribing patterns.J Am Pharm Assoc (2003). 2020 Jul-Aug;60(4):559-564. doi: 10.1016/j.japh.2019.12.019. Epub 2020 Feb 6. J Am Pharm Assoc (2003). 2020. PMID: 32033899 Review.
-
The state of the science in opioid policy research.Drug Alcohol Depend. 2020 Sep 1;214:108137. doi: 10.1016/j.drugalcdep.2020.108137. Epub 2020 Jun 27. Drug Alcohol Depend. 2020. PMID: 32652376 Free PMC article. Review.
Cited by
-
Changes in Postpartum Opioid Prescribing After Implementation of State Opioid Prescribing Limits.JAMA Health Forum. 2024 Nov 1;5(11):e244216. doi: 10.1001/jamahealthforum.2024.4216. JAMA Health Forum. 2024. PMID: 39602107 Free PMC article.
-
The relationship between state-level factors and LGBTQ+ policies in diverse healthcare settings in the United States: a cross-sectional multilevel analysis.BMC Health Serv Res. 2025 Aug 6;25(1):1033. doi: 10.1186/s12913-025-13148-z. BMC Health Serv Res. 2025. PMID: 40770751 Free PMC article.
-
Association Between Legal Access to Medical Cannabis and Frequency of Non-Medical Prescription Opioid Use Among U.S. Adults.Int J Ment Health Addict. 2025 Apr;23(2):1663-1676. doi: 10.1007/s11469-023-01191-y. Epub 2023 Oct 30. Int J Ment Health Addict. 2025. PMID: 40443432
-
Effects of state opioid prescribing cap laws on providers' opioid prescribing patterns among patients with chronic non-cancer pain.Prev Med. 2023 Jul;172:107535. doi: 10.1016/j.ypmed.2023.107535. Epub 2023 May 5. Prev Med. 2023. PMID: 37150305 Free PMC article.
-
State-level Payday Loan Bans and Preterm Births in the US, 2000-2019.Epidemiology. 2025 Jul 1;36(4):541-550. doi: 10.1097/EDE.0000000000001865. Epub 2025 Apr 8. Epidemiology. 2025. PMID: 40197649
References
-
- Conn Gen Stat Ann ch 370, §20-14o (2016).
Publication types
MeSH terms
Substances
Grants and funding
LinkOut - more resources
Full Text Sources
Miscellaneous