

Flow dynamics of surgical and transcatheter aortic valves: Past to present
- PMID: 36003460
- PMCID: PMC9390780
- DOI: 10.1016/j.xjon.2022.01.017
Flow dynamics of surgical and transcatheter aortic valves: Past to present
Abstract
Objective: To perform an in vitro characterization of surgical aortic valves (SAVs) and transcatheter aortic valves (TAVs) to highlight the development of the flow dynamics depending on the type of valve implanted and assess the basic differences in the light of flow turbulence and its effect on blood damage likelihood and hemodynamic parameters that shed light on valve performance.
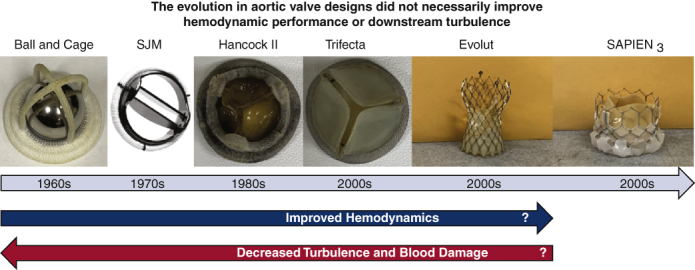
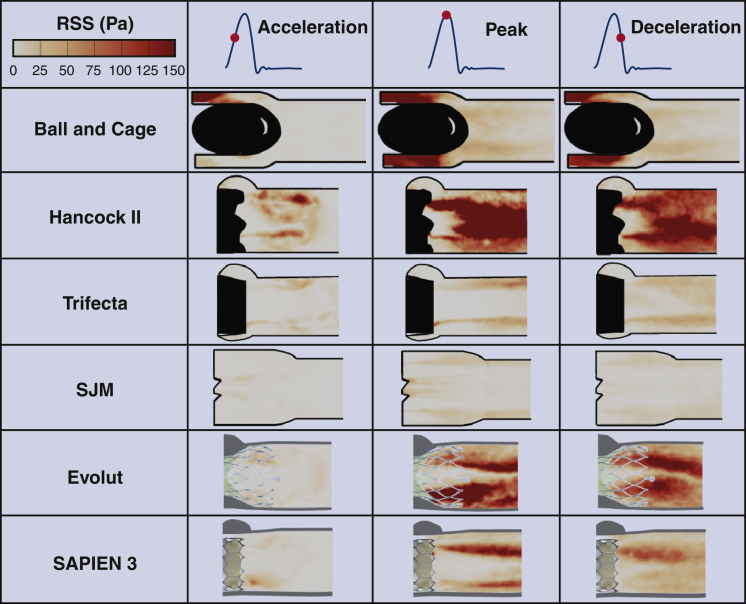
Methods: A Starr-Edwards ball and cage valve of internal diameter 22 mm, a 23-mm Medtronic Hancock II SAV, a 23-mm St Jude Trifecta SAV, a 23-mm St Jude SJM (mechanical valve) SAV, a 26-mm Medtronic Evolut TAV, and a 26-mm Edwards SAPIEN 3 TAV were assessed in a pulse duplicator under physiological conditions. Particle image velocimetry was performed for each valve. Pressure gradient and effective orifice area (EOA) along with velocity flow field, Reynolds shear stress (RSS), and viscous shear stress (VSS) were calculated.
Results: The SJM mechanical valve exhibited the greatest EOA (1.96 ± 0.02 cm2), showing superiority of efficiency compared with the same-size Trifecta (1.87 ± 0.07 cm2) and Hancock II (1.05 ± 0.01 cm2) (P < .0001). The TAVs show close EOAs (2.10 ± 0.06 cm2 with Evolut and 2.06 ± 0.03 cm2 with SAPIEN 3; P < .0001). The flow characteristics and behavior downstream of the valves differed depending on the valve type, design, and size. The greater the RSS and VSS the more turbulent the downstream flow. Hancock II displays the greatest range of RSS and VSS magnitudes compared with the same-size Trifecta and SJM. The Evolut displays the greatest range of RSS and VSS compared with the SAPIEN 3.
Conclusions: The results of this study shed light on numerous advancements in the design of aortic valve replacement prosthesis and the subsequent hemodynamic variations. Future surgical and transcatheter valve designs should aim at not only concentrating on hemodynamic parameters but also at optimizing downstream flow properties.
Keywords: AV, aortic valve; EOA, effective orifice area; ID, internal diameter; PIV, particle image velocimetry; RSS, Reynolds shear stress; SAV, surgical aortic valve; SAVR, surgical aortic valve replacement; SJM, St Jude Medical; TAV, transcatheter aortic valve; VSS, viscous shear stress; ball and cage; blood damage; surgical aortic valves; transcatheter aortic valve replacement; turbulence.
© 2022 The Author(s).
Figures


Similar articles
-
The hemodynamics of transcatheter aortic valves in transcatheter aortic valves.J Thorac Cardiovasc Surg. 2021 Feb;161(2):565-576.e2. doi: 10.1016/j.jtcvs.2019.09.174. Epub 2019 Oct 30. J Thorac Cardiovasc Surg. 2021. PMID: 31767355 Free PMC article.
-
Comparison of performance of self-expanding and balloon-expandable transcatheter aortic valves.JTCVS Open. 2022 Apr 20;10:128-139. doi: 10.1016/j.xjon.2022.04.015. eCollection 2022 Jun. JTCVS Open. 2022. PMID: 36004225 Free PMC article.
-
Flow dynamics in the sinus and downstream of third and fourth generation balloon expandable transcatheter aortic valves.J Mech Behav Biomed Mater. 2022 Mar;127:105092. doi: 10.1016/j.jmbbm.2022.105092. Epub 2022 Jan 17. J Mech Behav Biomed Mater. 2022. PMID: 35066348
-
Balloon-expandable versus self-expanding transcatheter aortic valve replacement: a comparison and evaluation of current findings.Expert Rev Cardiovasc Ther. 2020 Oct;18(10):697-708. doi: 10.1080/14779072.2020.1807326. Epub 2020 Aug 13. Expert Rev Cardiovasc Ther. 2020. PMID: 32757863 Review.
-
Assessing options for the small aortic root.J Heart Valve Dis. 2002 Jan;11 Suppl 1:S50-5. J Heart Valve Dis. 2002. PMID: 11843521 Review.
Cited by
-
Stanford A aortic dissection 40 years after aortic valve replacement with a Starr-Edwards caged-ball prosthesis: a case report.J Surg Case Rep. 2024 Nov 16;2024(11):rjae707. doi: 10.1093/jscr/rjae707. eCollection 2024 Nov. J Surg Case Rep. 2024. PMID: 39554387 Free PMC article.
-
The importance of tissue science and valve design in relation to durability and hemodynamics of the DurAVR aortic heart valve.Front Cardiovasc Med. 2025 Feb 7;12:1512961. doi: 10.3389/fcvm.2025.1512961. eCollection 2025. Front Cardiovasc Med. 2025. PMID: 39991635 Free PMC article. Review.
-
Commentary: Can in vitro valve testing reliably predict clinical outcomes?JTCVS Open. 2022 Feb 11;9:57-58. doi: 10.1016/j.xjon.2022.02.004. eCollection 2022 Mar. JTCVS Open. 2022. PMID: 36003476 Free PMC article. No abstract available.
References
-
- Pibarot P., Dumesnil J.G. Prosthetic heart valves: selection of the optimal prosthesis and long-term management. Circulation. 2009;119:1034–1048. - PubMed
-
- Kontos G.J., Jr., Schaff H.V. Thrombotic occlusion of a prosthetic heart valve: diagnosis and management. Mayo Clin Proc. 1985;60:118–122. - PubMed
-
- Morse D., Steiner R.M., Fernandez J. Springer Science & Business Media; 2012. Guide to Prosthetic Cardiac Valves.
-
- Chandran K., Khalighi B., Chen C.-J. Experimental study of physiological pulsatile flow past valve prostheses in a model of human aorta—I. Caged ball valves. J Biomech. 1985;18:763–772. - PubMed
-
- Yoganathan A.P., He Z., Casey Jones S. Fluid mechanics of heart valves. J Annu Rev Biomed Eng. 2004;6:331–362. - PubMed
Grants and funding
LinkOut - more resources
Full Text Sources
Miscellaneous
