. 2022 Aug 8:12:981009.
doi: 10.3389/fonc.2022.981009. eCollection 2022.

Upregulated integrin α11 in the stroma of cutaneous squamous cell carcinoma promotes skin carcinogenesis

Affiliations

Upregulated integrin α11 in the stroma of cutaneous squamous cell carcinoma promotes skin carcinogenesis

Guillermo A Martínez-Nieto et al. Front Oncol. .

Abstract

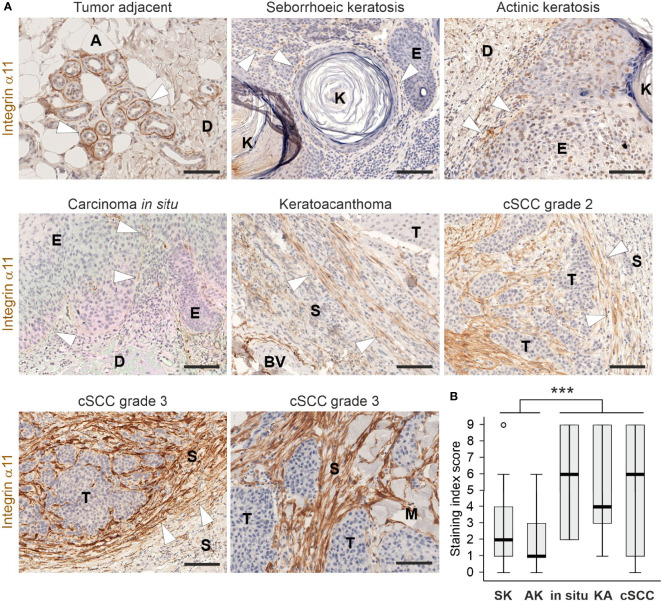
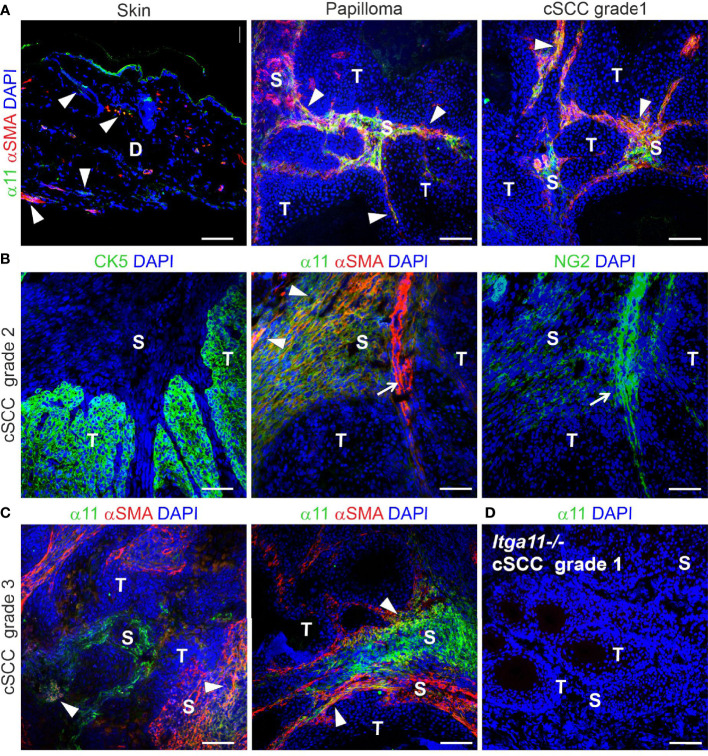
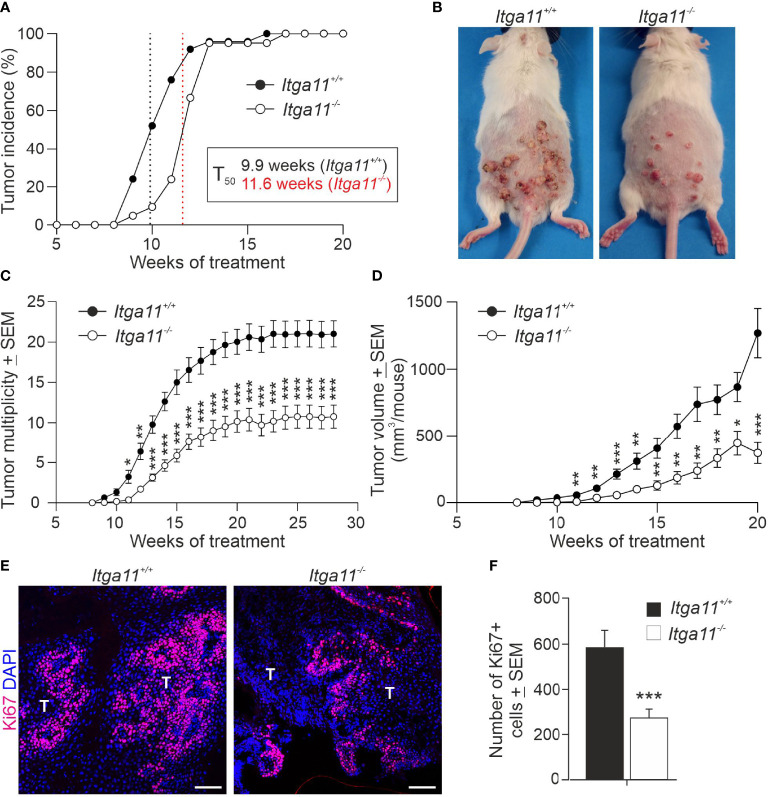
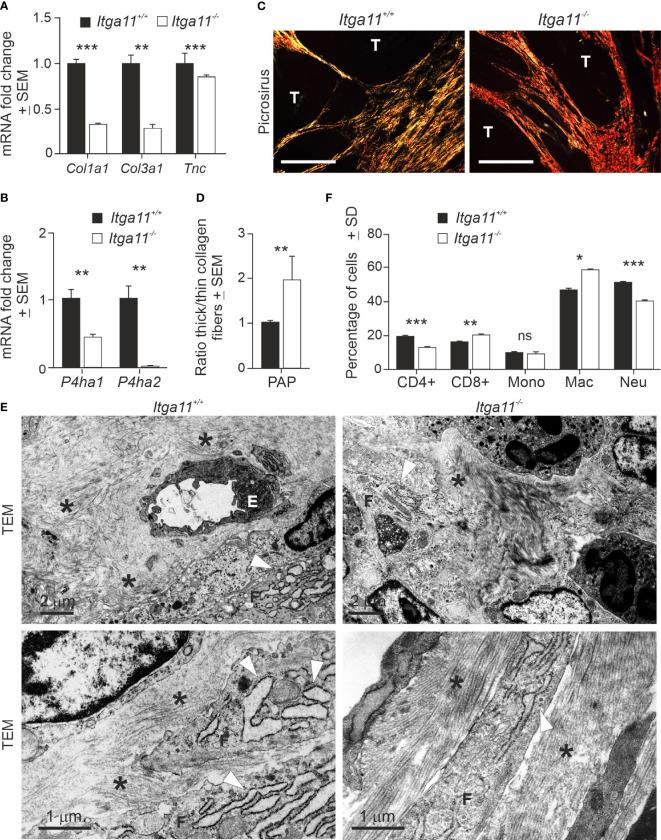
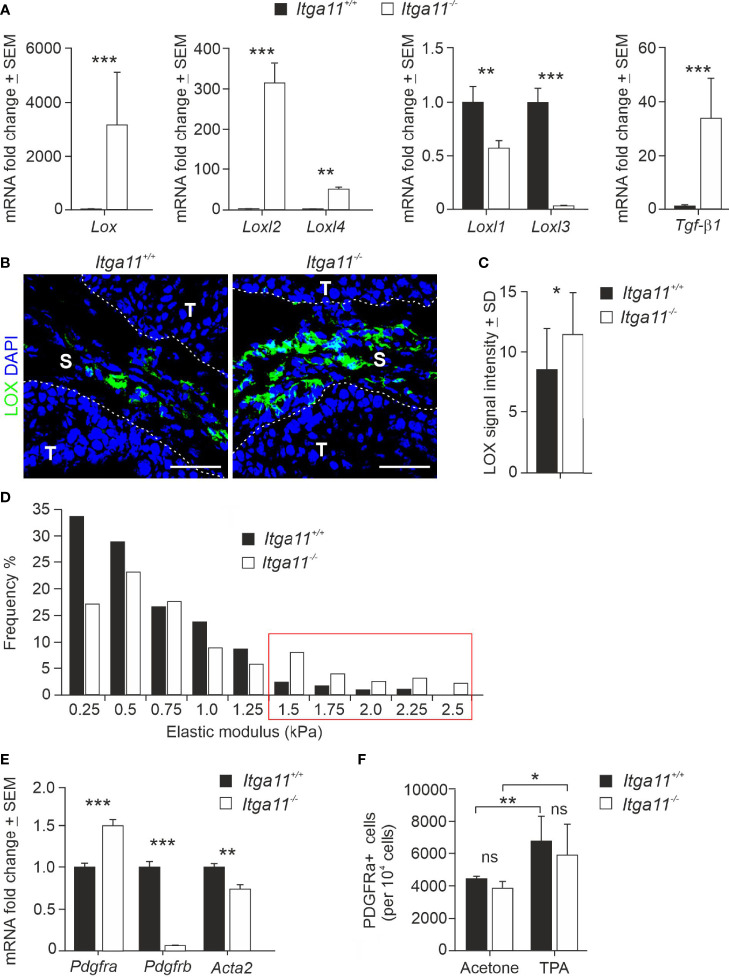
Integrin α11β1 is a collagen-binding integrin that is needed to induce and maintain the myofibroblast phenotype in fibrotic tissues and during wound healing. The expression of the α11 is upregulated in cancer-associated fibroblasts (CAFs) in various human neoplasms. We investigated α11 expression in human cutaneous squamous cell carcinoma (cSCC) and in benign and premalignant human skin lesions and monitored its effects on cSCC development by subjecting α11-knockout (Itga11-/- ) mice to the DMBA/TPA skin carcinogenesis protocol. α11-deficient mice showed significantly decreased tumor cell proliferation, leading to delayed tumor development and reduced tumor burden. Integrin α11 expression was significantly upregulated in the desmoplastic tumor stroma of human and mouse cSCCs, and the highest α11 expression was detected in high-grade tumors. Our results point to a reduced ability of α11-deficient stromal cells to differentiate into matrix-producing and tumor-promoting CAFs and suggest that this is one causative mechanism underlying the observed decreased tumor growth. An unexpected finding in our study was that, despite reduced CAF activation, the α11-deficient skin tumors were characterized by the presence of thick and regularly aligned collagen bundles. This finding was attributed to a higher expression of TGFβ1 and collagen crosslinking lysyl oxidases in the Itga11-/- tumor stroma. In summary, our data suggest that α11β1 operates in a complex interactive tumor environment to regulate ECM synthesis and collagen organization and thus foster cSCC growth. Further studies with advanced experimental models are still needed to define the exact roles and molecular mechanisms of stromal α11β1 in skin tumorigenesis.

Keywords: DMBA/TPA; cancer-associated fibroblast; collagen; extracellular matrix; lysyl oxidase; myofibroblast; tumor microenvironment.


Conflict of interest statement

The authors declare that the research was conducted in the absence of any commercial or financial relationships that could be construed as a potential conflict of interest.

Figures

Figure 1
Figure 1
Expression and localization of integrin α11 in human cutaneous lesions. (A) Representative images of integrin α11 expression and localization in human skin lesions, stained with a monoclonal anti-human integrin α11 antibody (clone 210F4B6A4) (26). Integrin α11 showed strong expression around sweat glands in the tumor-adjacent normal skin, likely in the myoepithelial cells of the acini (arrowheads); scant positive signals in spindle-shaped cells at the dermal-epidermal junction (arrowheads) in benign seborrheic keratosis, premalignant actinic keratosis, and in squamous carcinoma in situ; generally moderate or strong signals in spindle-shaped cells distributed within the fibrillar stroma; and present in a tangle-like pattern at the tumor−stroma interphase (arrowheads) in malignant keratoacanthoma and cutaneous squamous cells carcinomas (cSCC). Stromal α11 staining is strong in grade 3 cSCCs. (B) A boxplot diagram representing the staining index score in seborrhoeic keratosis (SK), actinic keratosis (AK), in situ carcinomas (in situ), keratoacanthomas (KA), and cSCCs. Arrowheads, α11 signals. A, adipocyte, BV, blood vessel; D, dermis; E, epidermis; K, keratin; M, muscle; S, stroma; T, tumor. Scale bars, 100 μm. ***, p<0.001.
Figure 2
Figure 2
Expression and localization of integrin α11 in mouse skin and chemically induced skin tumors. Representative images of α11 immunofluorescence in normal mouse skin and skin tumors, stained with a polyclonal anti-mouse α11 antibody (28). (A) α11 expression is negligible in normal mouse skin; scant positive signals are found around hair follicles and in isolated dermal cells (arrowheads), sometimes overlapping with smooth muscle actin (αSMA) signals. The positive signal in the cornified epithelium represents non-specific tissue autofluorescence due to Alexa Fluor 488-conjugated secondary antibody. (A-C) α11 is significantly upregulated in the stroma of premalignant papillomas and malignant cSCCs of different grades and partially co-localizes with αSMA-positive cells (arrowheads). (B) Sequential sections of a moderately differentiated (grade 2) cSCC. Integrin α11 and αSMA are localized exclusively in the tumor stroma and show partial overlapping (arrowheads). αSMA is also detected in smooth muscle cells around some blood vessels (arrow) and is closely associated with a pericyte marker, NG2. Cytokeratin 5 (CK5) is a marker of carcinoma cells and does not co-localize with α11. (C) Examples of integrin α11 and αSMA staining in grade 3 cSCC; immunofluorescent signals in the stroma occasionally overlap with αSMA (arrowheads). (D) A well differentiated (grade 1) cSCC from a Itga11-/- mouse was used as a staining control for the α11 antibody. Scale bars: A, 100 μm, B-D, 50 μm. Markings in images: D, dermis; S, stroma; T, tumor.
Figure 3
Figure 3
Skin tumor growth is impaired in integrin α11-deficient mice. Tumors were induced in the dorsal skin of the Itga11+/+ (n = 25) and Itga11-/- (n = 21) male mice using the 7,12-dimethylbenz[a]anthracene (DMBA)/12-O-tetradecanoylphorbol-13-acetate (TPA) protocol, and tumor incidence and multiplicity were monitored for up to 28 weeks in some individuals. (A) Tumor incidence. At week 10, the tumor incidence in the Itga11-/- mice was approximately 50% that in the Itga11+/+ mice. There was a delay of two weeks in terms of tumor incidence in the Itga11-/- mice (T50); however, all mice developed skin tumors by week 13. (B) Representative photographs of the DMBA/TPA-treated Itga11+/+ and Itga11-/- mice at week 20. (C) Cumulative tumor multiplicity. Compared to the Itga11+/+ controls, the Itga11-/- mice developed roughly 50% fewer skin tumors upon DMBA and TPA treatments. (D) The total tumor burden per mouse was significantly smaller in the Itga11-/- mice from week 10 onwards. (E, F) Tumor cell proliferation. Representative images of Ki67 staining of the control and α11-deficient skin papillomas and quantification of proliferating Ki67-positive cells. Ten papillomas per genotype (from different mice) and four to five microscopic fields for each papilloma sample at a magnification of 200× were counted. In E, scale bars 100 μm; T, tumor. *, p<0.05, **, p<0.01, ***, p<0.001.
Figure 4
Figure 4
Characterization of α11-deficient of skin tumor stroma. (A, B) RT-qPCR analysis of collagen I (Col1a1) and III (Col3a1) α1 chain, tenascin (Tnc), and prolyl-4-hydoxylase 1 (Pdha1) and 2 (Pdha2) in Itga11+/+ and Itga11-/- papillomas. RT-qPCR data are an average of ten samples (from different individuals) per genotype collected at weeks 19–20 and normalized with endogenous Gapdh. (C) Representative images of picrosirius red staining of Itga11+/+ and Itga11-/- papillomas imaged by polarized light microscopy. Thin collagen fibers appear as yellow/green, and thick collagen bundles appear as red/orange tones. Scale bar, 200 μm. T, tumor. (D) The quantification of collagen birefringence shows that the ratio of thick/thin collagen fibers is significantly increased in the Itga11-/- tumors compared to the Itga11+/+ tumors (n = 10 per genotype). (E) Transmission electron microscopy (TEM) of skin tumors (n = 3 per genotype). Representative images of two separate Itga11+/+ and two Itga11-/- papillomas with different magnifications are shown. In the Itga11+/+ papillomas, a prominent dilated rough endoplasmic reticulum (rER, arrowhead) of fibroblasts is evident, and collagen fibers (asterisk) are scattered in the stroma. In the Itga11-/- tumors, collagen fibers are organized parallelly in large bundles (asterisk), and the rER is less evident. E, endothelial cell; F, fibroblast; scale bars are marked in the pictures. (F) FACS analysis of immune cells in skin tumors. Ten papillomas per genotype, which were harvested from three individuals, were analyzed. In (A, B, D, F) *, p<0.05; **, p<0.01; ***, p<0.001. ns, not significant.
Figure 5
Figure 5
Expression of LOX family members and CAF markers in Itga11−/− skin tumors. (A) RT-qPCR analysis of lysyl oxidase (Lox), LOX-like enzymes (Loxl1-4), and transforming growth factor beta-1 (Tgfβ1) in Itga11+/+ and Itga11-/- skin papillomas at week 20. The data are an average of ten samples (from different individuals) per genotype and normalized with endogenous Gapdh. (B) Representative immunofluorescence staining of LOX in Itga11+/+ and Itga11-/- papillomas. LOX signals are prominent in α11-deficient skin tumors and widely distributed within the tumor stroma. Scale bars, 50 μm. S, stroma; T, tumor. (C) Quantification of LOX immunofluorescence in Itga11+/+ and Itga11-/- papillomas. Twelve to 15 images from five tumors from five different individuals/genotype were quantified using Fiji ImageJ analysis software. (D) Tumor stiffness measurements by atomic force microscopy. Histograms of the Young’s elastic modulus (kPa) of the Itga11+/+ (n = 4) and Itga11-/- (n = 3) papillomas collected at weeks 20–25. (E) RT-qPCR analysis of fibroblast markers PDGFRα, PDGFRβ, and αSMA (Acta2) in Itga11+/+ and Itga11-/- papillomas collected at week 20. Data are an average of ten samples (from different individuals) per genotype. Values were normalized with Gapdh. (F) Numbers of Lin- PDGFRα+ cells in the acetone-treated normal and TPA-treated hyperplastic skin of the Itga11+/+ and Itga11-/- mice. In (A, C, E, F) *, p<0.05, **, p<0.01, ***, p<0.001. ns, not significant

Similar articles

Cited by

References

    1. Pickup MW, Mouw JK, Weaver VM. The extracellular matrix modulates the hallmarks of cancer. EMBO Rep (2014) 15(12):1243–53. doi: 10.15252/embr.201439246 - DOI - PMC - PubMed
    1. Chen Y, McAndrews KM, Kalluri R. ‘Clinical and therapeutic relevance of cancer-associated fibroblasts’. Nat Rev Clin Oncol (2021) 18(12):792–804. doi: 10.1038/s41571-021-00546-5 - DOI - PMC - PubMed
    1. Sahai E, Astsaturov I, Cukierman E, DeNardo DG, Egeblad M, Evans RM, et al. . ‘A framework for advancing our understanding of cancer-associated fibroblasts’. Nat Rev Cancer (2020) 20(3):174–86. doi: 10.1038/s41568-019-0238-1 - DOI - PMC - PubMed
    1. Zeltz C, Navab R, Heljasvaara R, Kusche-Gullberg M, Lu N, Tsao M-S, et al. . ‘Integrin α11β1 in tumor fibrosis: more than just another cancer-associated fibroblast biomarker’. J Cell Commun Signaling (2022):1–12. doi: 10.1007/s12079-022-00673-3 - DOI - PMC - PubMed
    1. Öhlund D, Handly-Santana A, Biffi G, Elyada E, Almeida AS, Ponz-Sarvise M, et al. . Distinct populations of inflammatory fibroblasts and myofibroblasts in pancreatic cancer. J Exp Med (2017) 214(3):579–96. doi: 10.1084/jem.20162024 - DOI - PMC - PubMed