

A machine learning model for predicting patients with major depressive disorder: A study based on transcriptomic data
- PMID: 36003956
- PMCID: PMC9393475
- DOI: 10.3389/fnins.2022.949609
A machine learning model for predicting patients with major depressive disorder: A study based on transcriptomic data
Abstract
Background: Identifying new biomarkers of major depressive disorder (MDD) would be of great significance for its early diagnosis and treatment. Herein, we constructed a diagnostic model of MDD using machine learning methods.
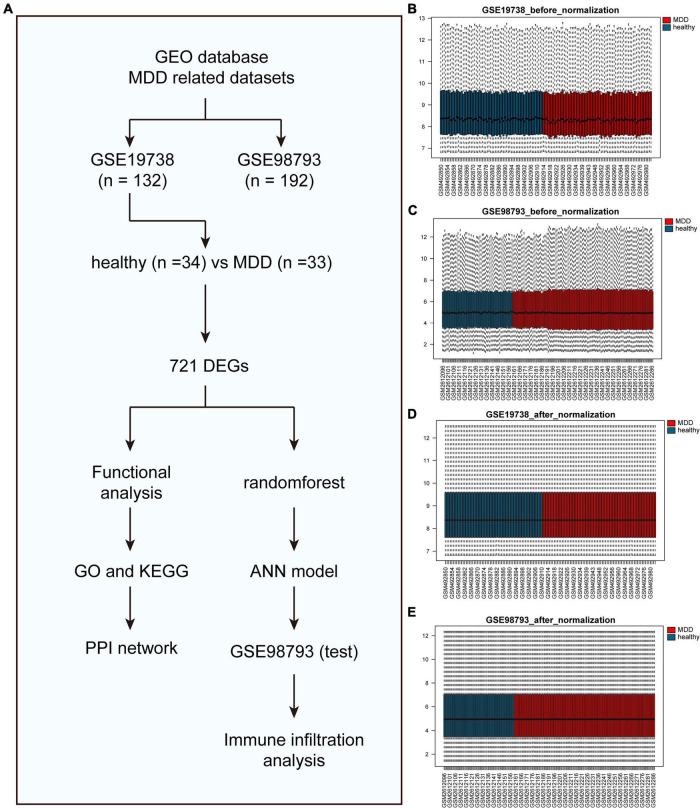
Methods: The GSE98793 and GSE19738 datasets were obtained from the Gene Expression Omnibus database, and the limma R package was used to analyze differentially expressed genes (DEGs) in MDD patients. Gene ontology (GO) and Kyoto Encyclopedia of Genes and Genomes (KEGG) enrichment analyses were performed to identify potential molecular functions and pathways. A protein-protein interaction network (PPI) was constructed, and hub genes were predicted. Random forest (RF) and artificial neural network (ANN) machine-learning algorithms were used to select variables and construct a robust diagnostic model.
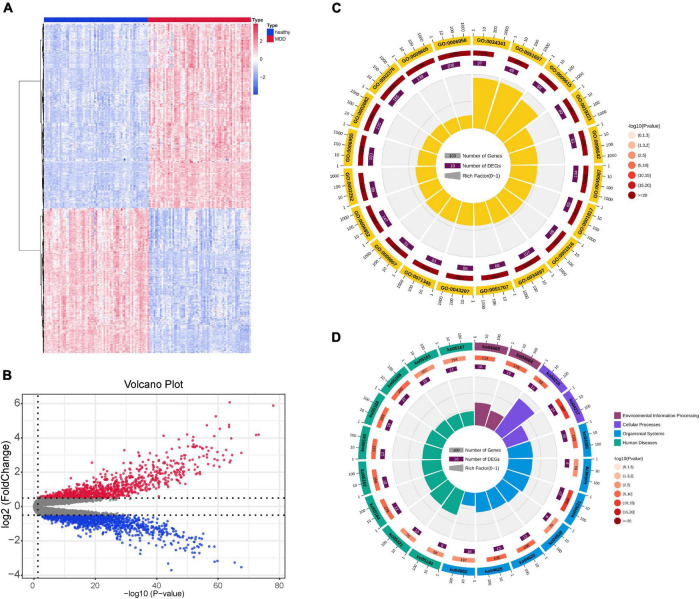
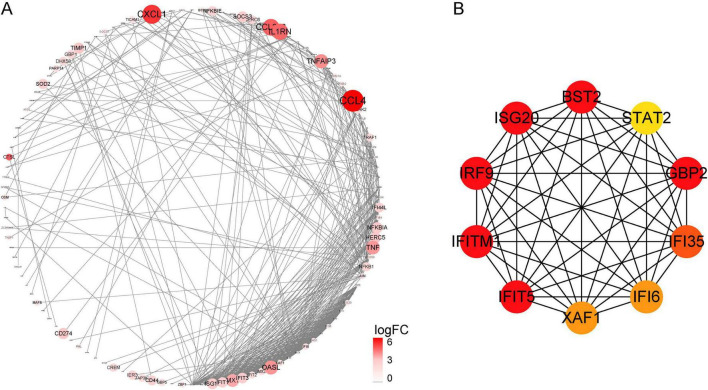
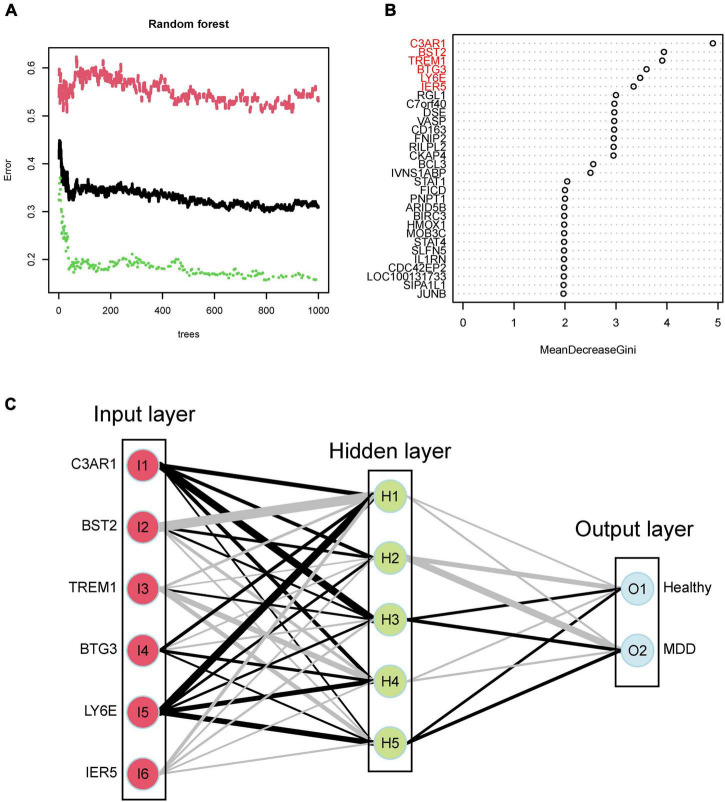
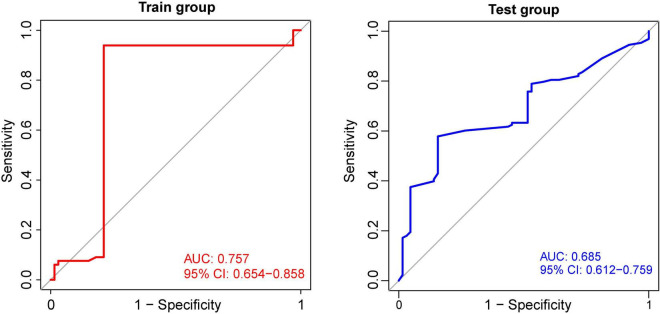
Results: A total of 721 DEGs were identified in peripheral blood samples of patients with MDD. GO and KEGG analyses revealed that the DEGs were mainly enriched in cytokines, defense responses to viruses, responses to biotic stimuli, immune effector processes, responses to external biotic stimuli, and immune systems. A PPI network was constructed, and CytoHubba plugins were used to screen hub genes. Furthermore, a robust diagnostic model was established using a RF and ANN algorithm with an area under the curve of 0.757 for the training model and 0.685 for the test cohort.
Conclusion: We analyzed potential driver genes in patients with MDD and built a potential diagnostic model as an adjunct tool to assist psychiatrists in the clinical diagnosis and treatment of MDD.
Keywords: artificial neural network; bioinformatics analysis; machine learning; major depressive disorder; random forest.
Copyright © 2022 Liu, Lu, Zhao, Fu, Wang, Li, Yang, Huang and Lyu.
Conflict of interest statement
The authors declare that the research was conducted in the absence of any commercial or financial relationships that could be construed as a potential conflict of interest.
Figures
Similar articles
-
Developing a Genetic Biomarker-based Diagnostic Model for Major Depressive Disorder using Random Forests and Artificial Neural Networks.Comb Chem High Throughput Screen. 2023;26(2):424-435. doi: 10.2174/1386207325666220404123433. Comb Chem High Throughput Screen. 2023. PMID: 35379119
-
Integrative analysis of signaling and metabolic pathways, immune infiltration patterns, and machine learning-based diagnostic model construction in major depressive disorder.Sci Rep. 2025 Apr 19;15(1):13519. doi: 10.1038/s41598-025-97623-x. Sci Rep. 2025. PMID: 40253457 Free PMC article.
-
Identification of hub biomarkers of myocardial infarction by single-cell sequencing, bioinformatics, and machine learning.Front Cardiovasc Med. 2022 Jul 25;9:939972. doi: 10.3389/fcvm.2022.939972. eCollection 2022. Front Cardiovasc Med. 2022. PMID: 35958412 Free PMC article.
-
Comprehensive analysis of endoplasmic reticulum stress and immune infiltration in major depressive disorder.Front Psychiatry. 2022 Oct 24;13:1008124. doi: 10.3389/fpsyt.2022.1008124. eCollection 2022. Front Psychiatry. 2022. PMID: 36353576 Free PMC article.
-
Development of gene model combined with machine learning technology to predict for advanced atherosclerotic plaques.Clin Neurol Neurosurg. 2023 Aug;231:107819. doi: 10.1016/j.clineuro.2023.107819. Epub 2023 Jun 10. Clin Neurol Neurosurg. 2023. PMID: 37315377
Cited by
-
Screening for depression in the general population through lipid biomarkers.EBioMedicine. 2024 Dec;110:105455. doi: 10.1016/j.ebiom.2024.105455. Epub 2024 Nov 20. EBioMedicine. 2024. PMID: 39571307 Free PMC article.
-
Ensemble Learning for Higher Diagnostic Precision in Schizophrenia Using Peripheral Blood Gene Expression Profile.Neuropsychiatr Dis Treat. 2024 May 3;20:923-936. doi: 10.2147/NDT.S449135. eCollection 2024. Neuropsychiatr Dis Treat. 2024. PMID: 38716091 Free PMC article.
References
LinkOut - more resources
Full Text Sources