

Iron deposition in the precuneus is correlated with mild cognitive impairment in patients with cerebral microbleeds: A quantitative susceptibility mapping study
- PMID: 36003962
- PMCID: PMC9395124
- DOI: 10.3389/fnins.2022.944709
Iron deposition in the precuneus is correlated with mild cognitive impairment in patients with cerebral microbleeds: A quantitative susceptibility mapping study
Abstract
Purpose: The purpose of this study was to define whether mild cognitive impairment (MCI) is associated with iron deposition in rich-club nodes distant from cerebral microbleeds (CMBs) in patients with cerebral small vessel disease (CSVD).
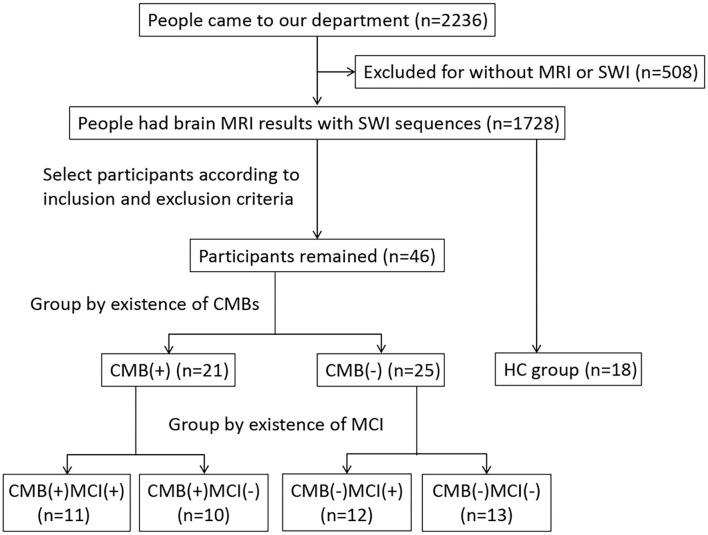
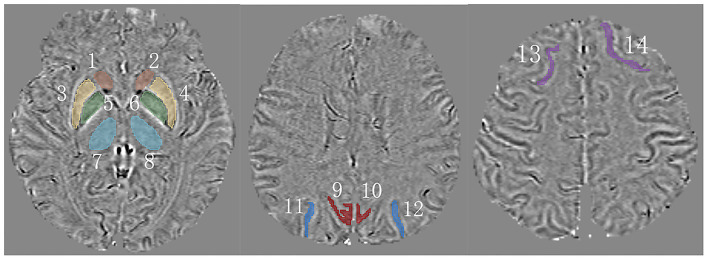
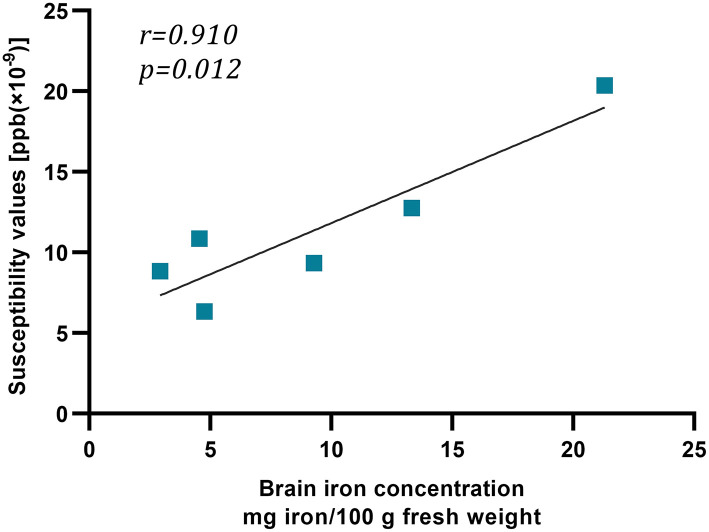
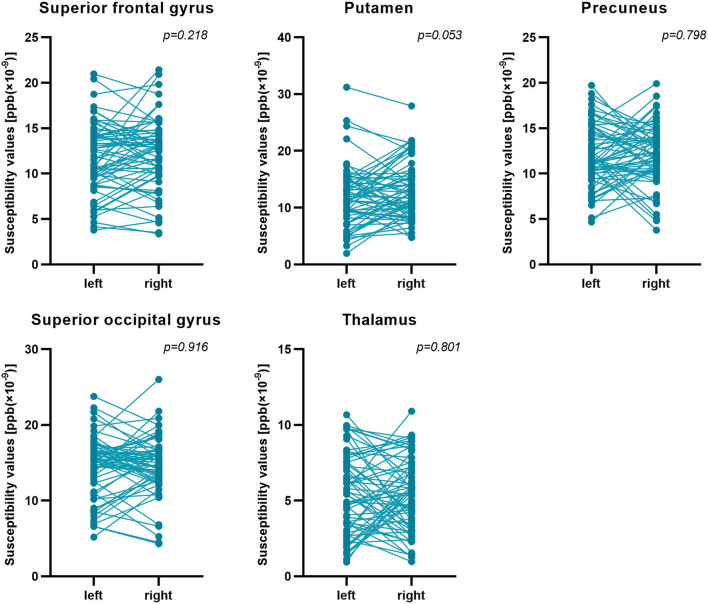
Methods: A total of 64 participants underwent magnetic resonance imaging (MRI) scanning and were separated into three groups, namely, CMB(+), CMB(-), and healthy controls (HCs). We compared their characteristics and susceptibility values of rich-club nodes [e.g., superior frontal gyrus (SFG), precuneus, superior occipital gyrus (SOG), thalamus, and putamen]. We then divided the CMB(+) and CMB(-) groups into subgroups of patients with or without MCI. Then, we analyzed the relationship between iron deposition and MCI by comparing the susceptibility values of rich-club nodes. We assessed cognitive functions using the Montreal Cognitive Assessment (MoCA) and quantified iron content using quantitative susceptibility mapping (QSM).
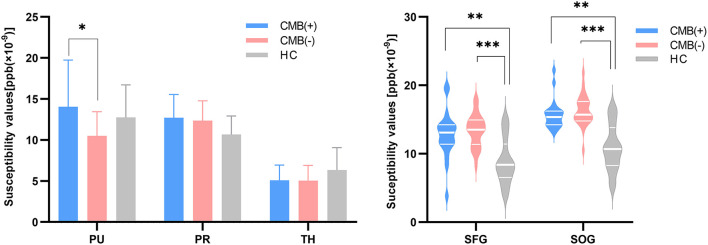
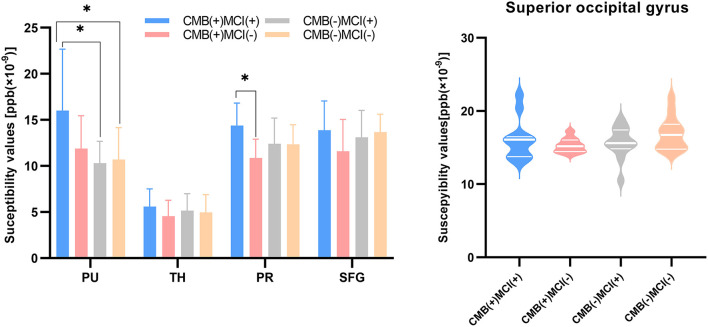
Results: In the putamen, the CMB(+) and CMB(-) groups had significantly different susceptibility values. Compared with the HCs, the CMB(+) and CMB(-) groups had significantly different susceptibility values for the SFG and SOG. In addition, we found significant differences in the putamen susceptibility values of the CMB(+)MCI(+) group and the two CMB(-) groups. The CMB(+)MCI(+) and CMB(+)MCI(-) groups had significantly different precuneus susceptibility values. The binary logistic regression analysis revealed that only higher susceptibility values of precuneus were associated with a cognitive decline in patients with CMBs, and it indicated statistical significance.
Conclusion: Iron deposition in the precuneus is an independent risk factor for MCI in patients with CMBs. CMBs might influence iron content in remote rich-club nodes and be relevant to MCI.
Keywords: cerebral microbleed; cerebral small vessel disease; cognitive impairment; precuneus; quantitative susceptibility mapping.
Copyright © 2022 Tu, Yan, Liu, Liu, Wang and Gao.
Conflict of interest statement
The authors declare that the research was conducted in the absence of any commercial or financial relationships that could be construed as a potential conflict of interest.
Figures
Similar articles
-
Cerebral Microbleeds Are Associated With Increased Brain Iron and Cognitive Impairment in Patients With Cerebral Small Vessel Disease: A Quantitative Susceptibility Mapping Study.J Magn Reson Imaging. 2022 Sep;56(3):904-914. doi: 10.1002/jmri.28092. Epub 2022 Jan 31. J Magn Reson Imaging. 2022. PMID: 35099829
-
Brain iron deposition and cognitive decline in patients with cerebral small vessel disease : a quantitative susceptibility mapping study.Alzheimers Res Ther. 2025 Jan 9;17(1):17. doi: 10.1186/s13195-024-01638-x. Alzheimers Res Ther. 2025. PMID: 39789638 Free PMC article.
-
Deep-Learning-Based MRI Microbleeds Detection for Cerebral Small Vessel Disease on Quantitative Susceptibility Mapping.J Magn Reson Imaging. 2024 Sep;60(3):1165-1175. doi: 10.1002/jmri.29198. Epub 2023 Dec 27. J Magn Reson Imaging. 2024. PMID: 38149750
-
Cerebral microbleed detection and mapping: principles, methodological aspects and rationale in vascular dementia.Exp Gerontol. 2012 Nov;47(11):843-52. doi: 10.1016/j.exger.2012.06.008. Epub 2012 Jun 29. Exp Gerontol. 2012. PMID: 22750456 Review.
-
Systematic Review on the Role of Lobar Cerebral Microbleeds in Cognition.J Alzheimers Dis. 2022;86(3):1025-1035. doi: 10.3233/JAD-215323. J Alzheimers Dis. 2022. PMID: 35180115
Cited by
-
Deeper insight into ferroptosis: association with Alzheimer's, Parkinson's disease, and brain tumors and their possible treatment by nanomaterials induced ferroptosis.Redox Rep. 2023 Dec;28(1):2269331. doi: 10.1080/13510002.2023.2269331. Epub 2023 Nov 27. Redox Rep. 2023. PMID: 38010378 Free PMC article. Review.
-
Iron accumulation/overload and Alzheimer's disease risk factors in the precuneus region: A comprehensive narrative review.Aging Med (Milton). 2024 Oct 22;7(5):649-667. doi: 10.1002/agm2.12363. eCollection 2024 Oct. Aging Med (Milton). 2024. PMID: 39507230 Free PMC article. Review.
-
Multimodal comparisons of QSM and PET in neurodegeneration and aging.Neuroimage. 2023 Jun;273:120068. doi: 10.1016/j.neuroimage.2023.120068. Epub 2023 Mar 31. Neuroimage. 2023. PMID: 37003447 Free PMC article. Review.
-
Associations Between Cortical Iron Accumulation and Memory in Patients With Amnestic Mild Cognitive Impairment and in Cognitively Normal Individuals.Brain Behav. 2025 May;15(5):e70521. doi: 10.1002/brb3.70521. Brain Behav. 2025. PMID: 40384339 Free PMC article.
-
Prefrontal cortex iron content in neurodegeneration and healthy subjects: A systematic review.Ibrain. 2025 Apr 10;11(2):215-227. doi: 10.1002/ibra.12195. eCollection 2025 Summer. Ibrain. 2025. PMID: 40546874 Free PMC article. Review.
References
LinkOut - more resources
Full Text Sources