

Discrimination of Escherichia coli, Shigella flexneri, and Shigella sonnei using lipid profiling by MALDI-TOF mass spectrometry paired with machine learning
- PMID: 36004556
- PMCID: PMC9405496
- DOI: 10.1002/mbo3.1313
Discrimination of Escherichia coli, Shigella flexneri, and Shigella sonnei using lipid profiling by MALDI-TOF mass spectrometry paired with machine learning
Abstract
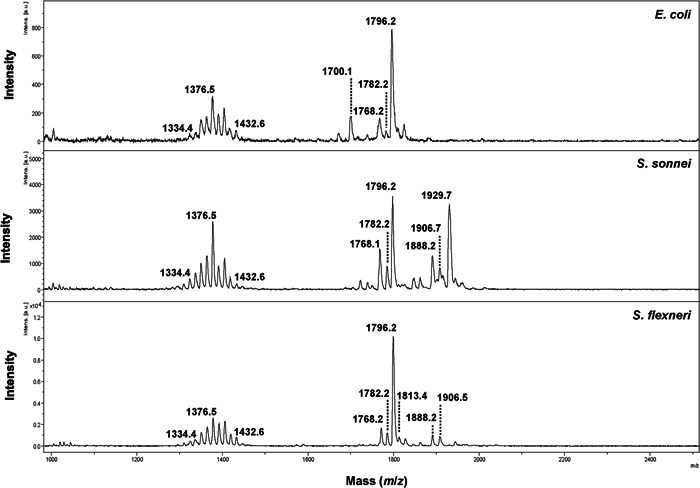
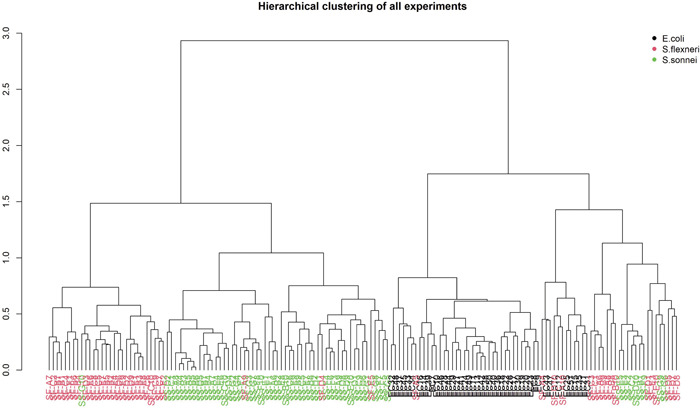
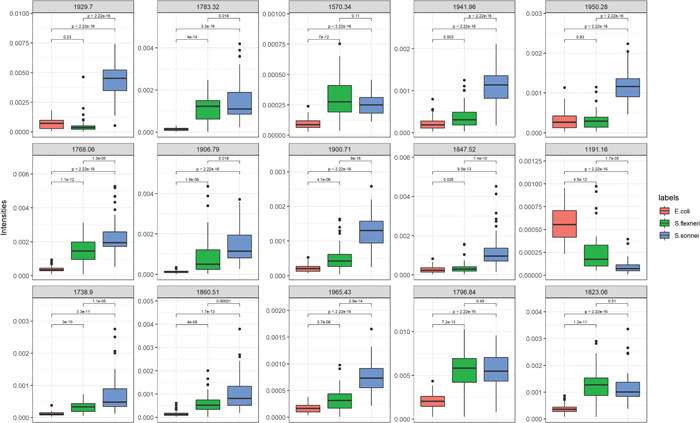
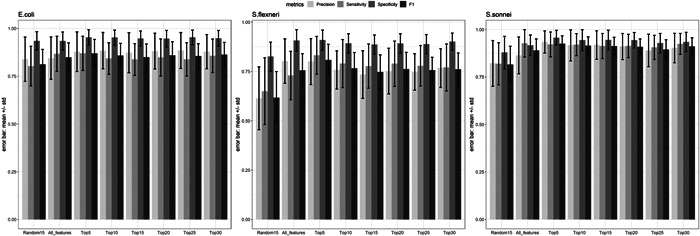
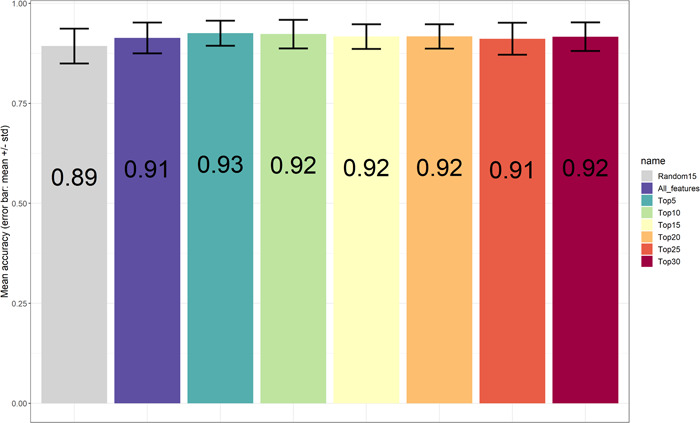
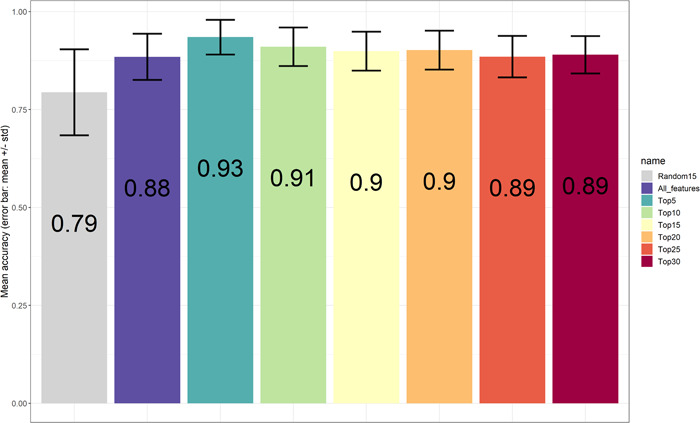
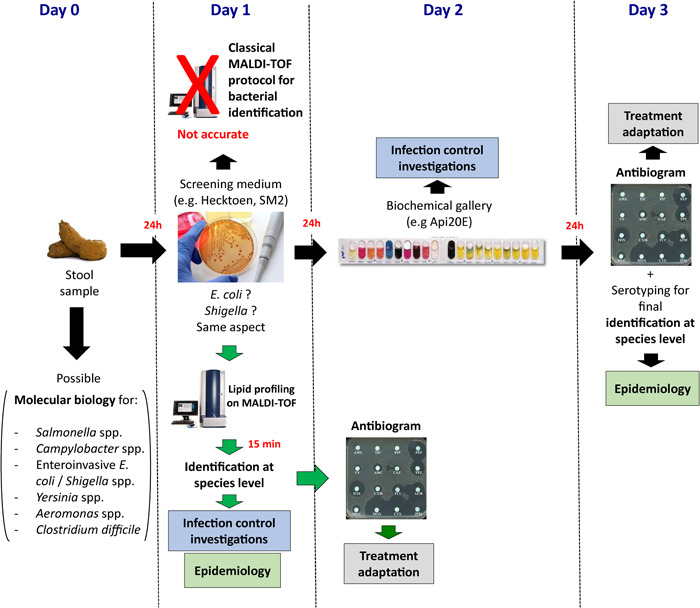
Matrix-assisted laser desorption/ionization-time of flight mass spectrometry (MALDI-TOF MS) has become a staple in clinical microbiology laboratories. Protein-profiling of bacteria using this technique has accelerated the identification of pathogens in diagnostic workflows. Recently, lipid profiling has emerged as a way to complement bacterial identification where protein-based methods fail to provide accurate results. This study aimed to address the challenge of rapid discrimination between Escherichia coli and Shigella spp. using MALDI-TOF MS in the negative ion mode for lipid profiling coupled with machine learning. Both E. coli and Shigella species are closely related; they share high sequence homology, reported for 16S rRNA gene sequence similarities between E. coli and Shigella spp. exceeding 99%, and a similar protein expression pattern but are epidemiologically distinct. A bacterial collection of 45 E. coli, 48 Shigella flexneri, and 62 Shigella sonnei clinical isolates were submitted to lipid profiling in negative ion mode using the MALDI Biotyper Sirius® system after treatment with mild-acid hydrolysis (acetic acid 1% v/v for 15 min at 98°C). Spectra were then analyzed using our in-house machine learning algorithm and top-ranked features used for the discrimination of the bacterial species. Here, as a proof-of-concept, we showed that lipid profiling might have the potential to differentiate E. coli from Shigella species using the analysis of the top five ranked features obtained by MALDI-TOF MS in the negative ion mode of the MALDI Biotyper Sirius® system. Based on this new approach, MALDI-TOF MS analysis of lipids might help pave the way toward these goals.
Keywords: MALDI; Shigella; identification; lipids.
© 2022 The Authors. Microbiology Open published by John Wiley & Sons Ltd.
Conflict of interest statement
None declared.
Figures
References
-
- Allison, G. E. , & Verma, N. K. (2000). Serotype‐converting bacteriophages and o‐antigen modification in Shigella flexneri . Trends in Microbiology, 8, 17–23. - PubMed
-
- van den Beld, M. J. C. , Warmelink, E. , Friedrich, A. W. , Reubsaet, F. A. G. , Schipper, M. , de Boer, R. F. , Notermans, D. W. , Petrignani, M. W. F. , van Zanten, E. , Rossen, J. W. A. , Friesema, I. H. M. , & Kooistra‐Smid, A. , & IBESS working group. (2019). Incidence, clinical implications and impact on public health of infections with shigella spp. and entero‐invasive Escherichia coli (EIEC): Results of a multicenter cross‐sectional study in the Netherlands during 2016‐2017. BMC Infectious Diseases, 19, 1037. - PMC - PubMed
-
- Casabuono, A. C. , van der Ploeg, C. A. , Roge, A. D. , Bruno, S. B. , & Couto, A. S. (2012). Characterization of lipid A profiles from Shigella flexneri variant X lipopolysaccharide. Rapid Communications in Mass Spectrometry, 26, 2011–2020. - PubMed
Publication types
MeSH terms
Substances
Grants and funding
LinkOut - more resources
Full Text Sources
Medical
Miscellaneous
