. 2022 Oct 4;146(14):1033-1045.
doi: 10.1161/CIRCULATIONAHA.121.056719. Epub 2022 Aug 25.

Plasma Cell-Free DNA Predicts Survival and Maps Specific Sources of Injury in Pulmonary Arterial Hypertension

Affiliations

Plasma Cell-Free DNA Predicts Survival and Maps Specific Sources of Injury in Pulmonary Arterial Hypertension

Samuel B Brusca et al. Circulation. .

Abstract

Background: Cell-free DNA (cfDNA) is a noninvasive marker of cellular injury. Its significance in pulmonary arterial hypertension (PAH) is unknown.

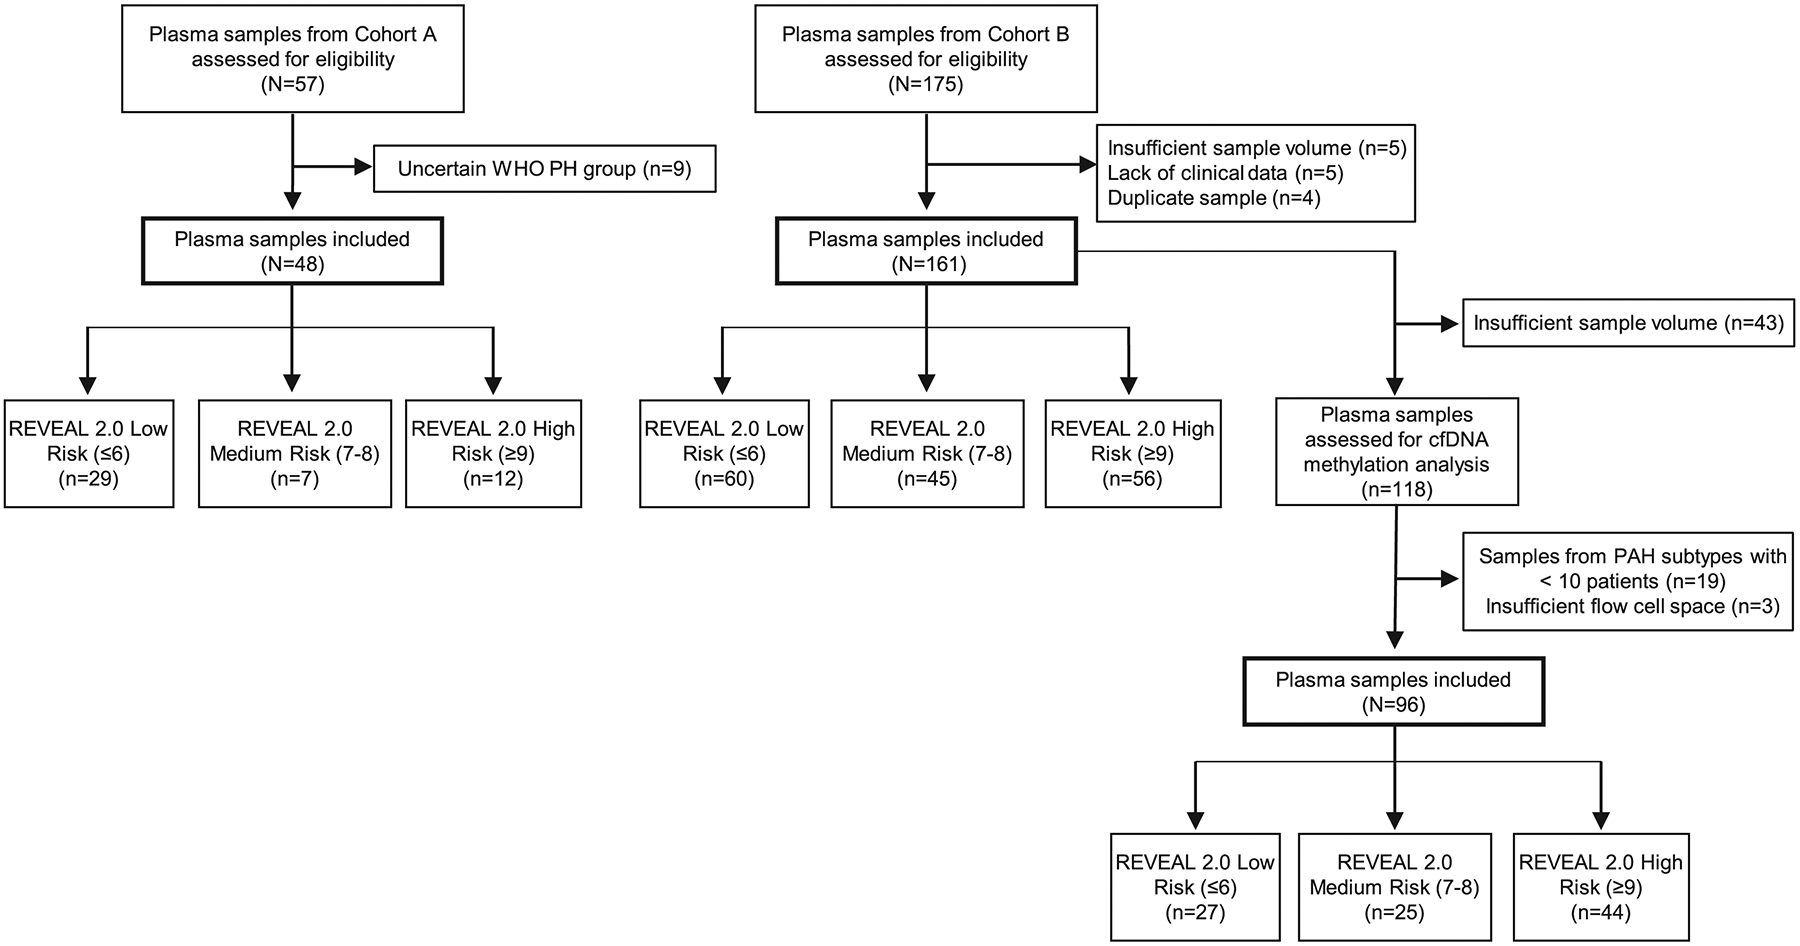
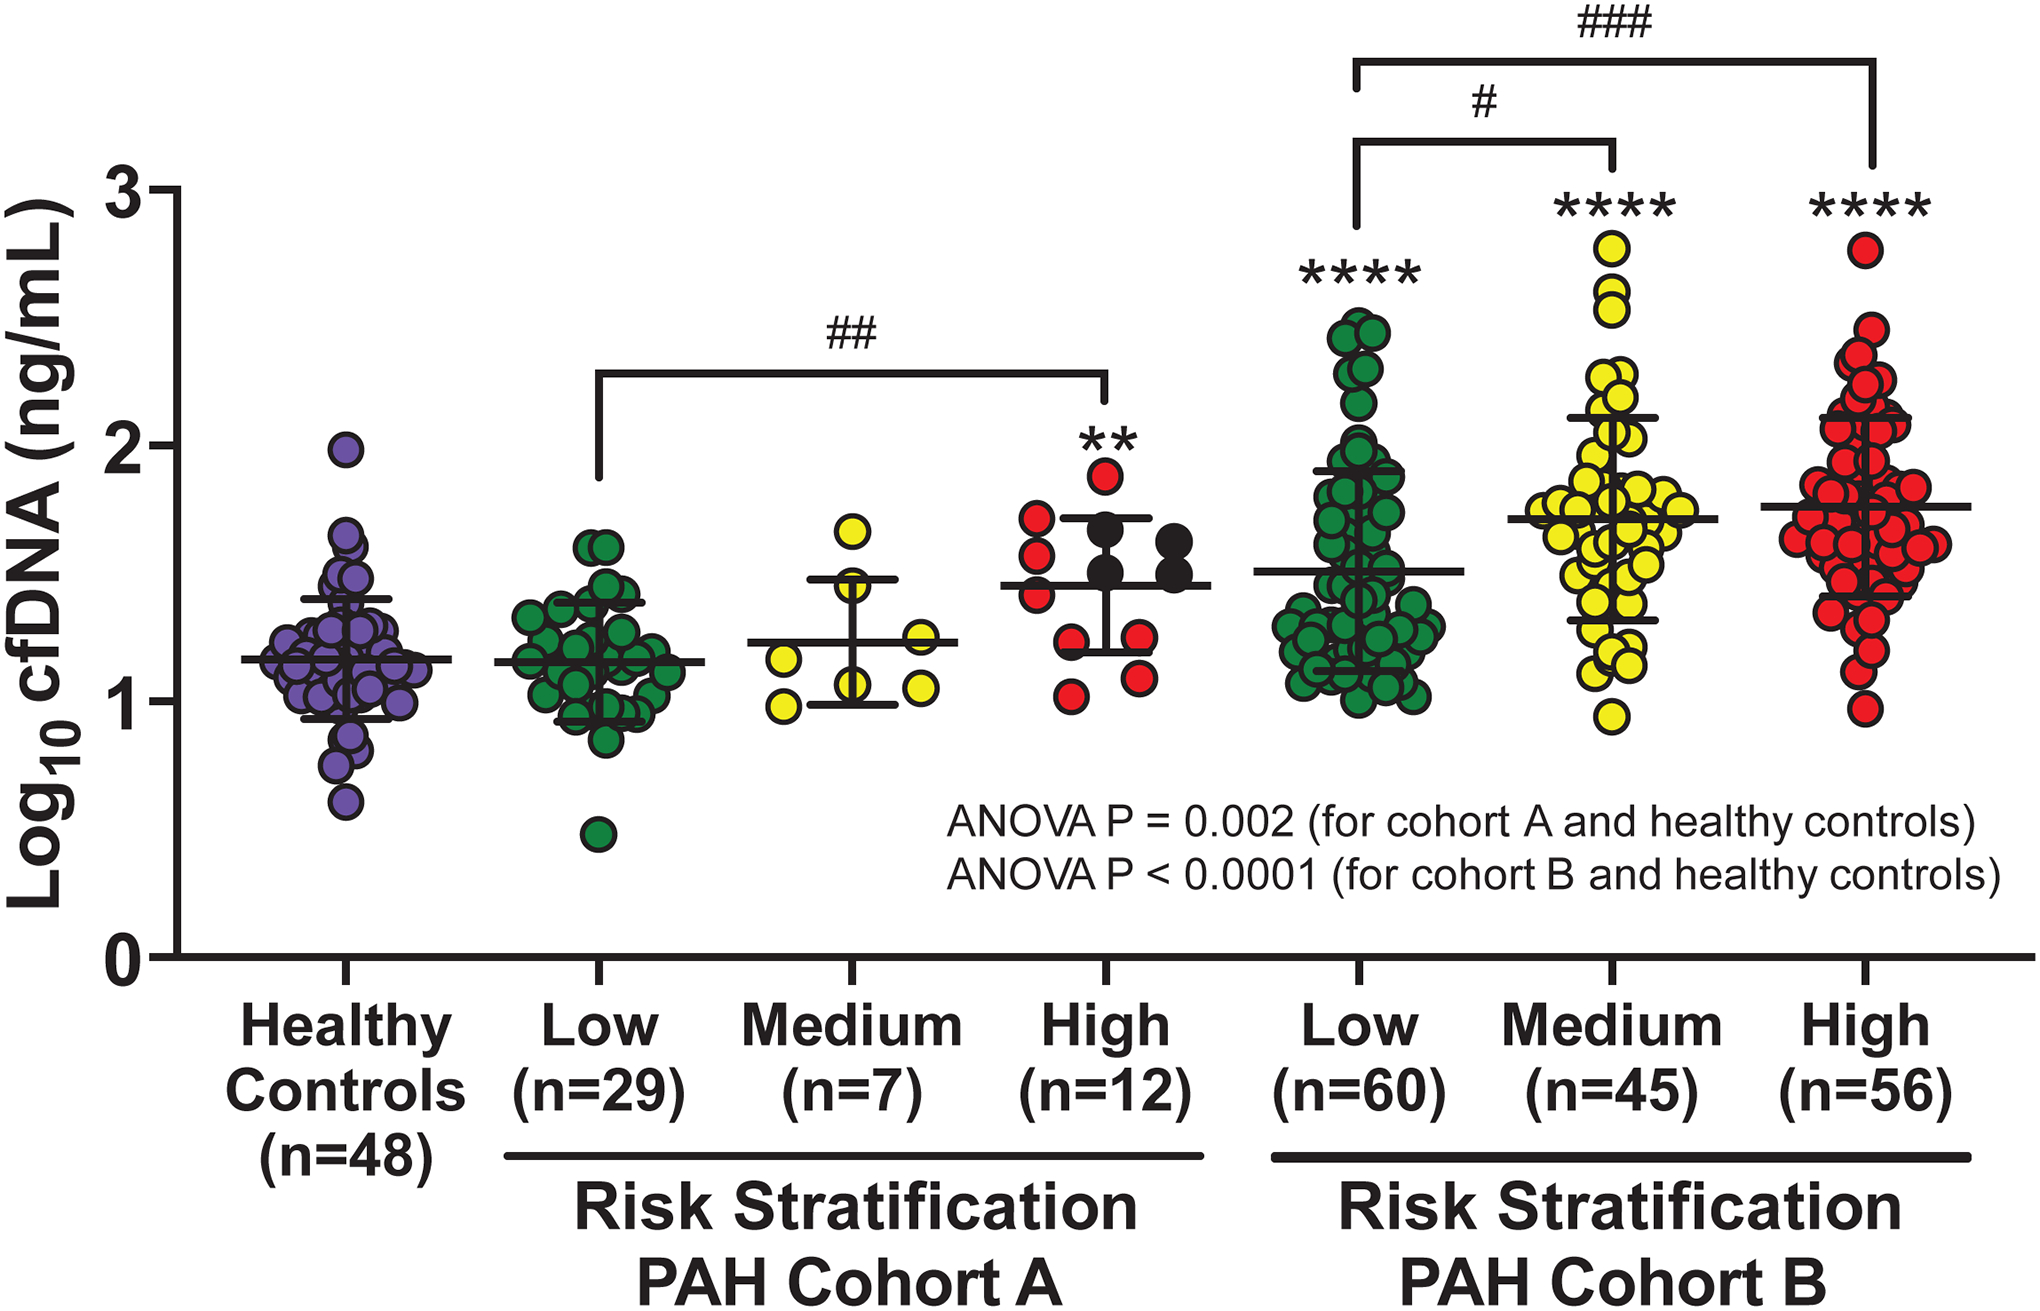
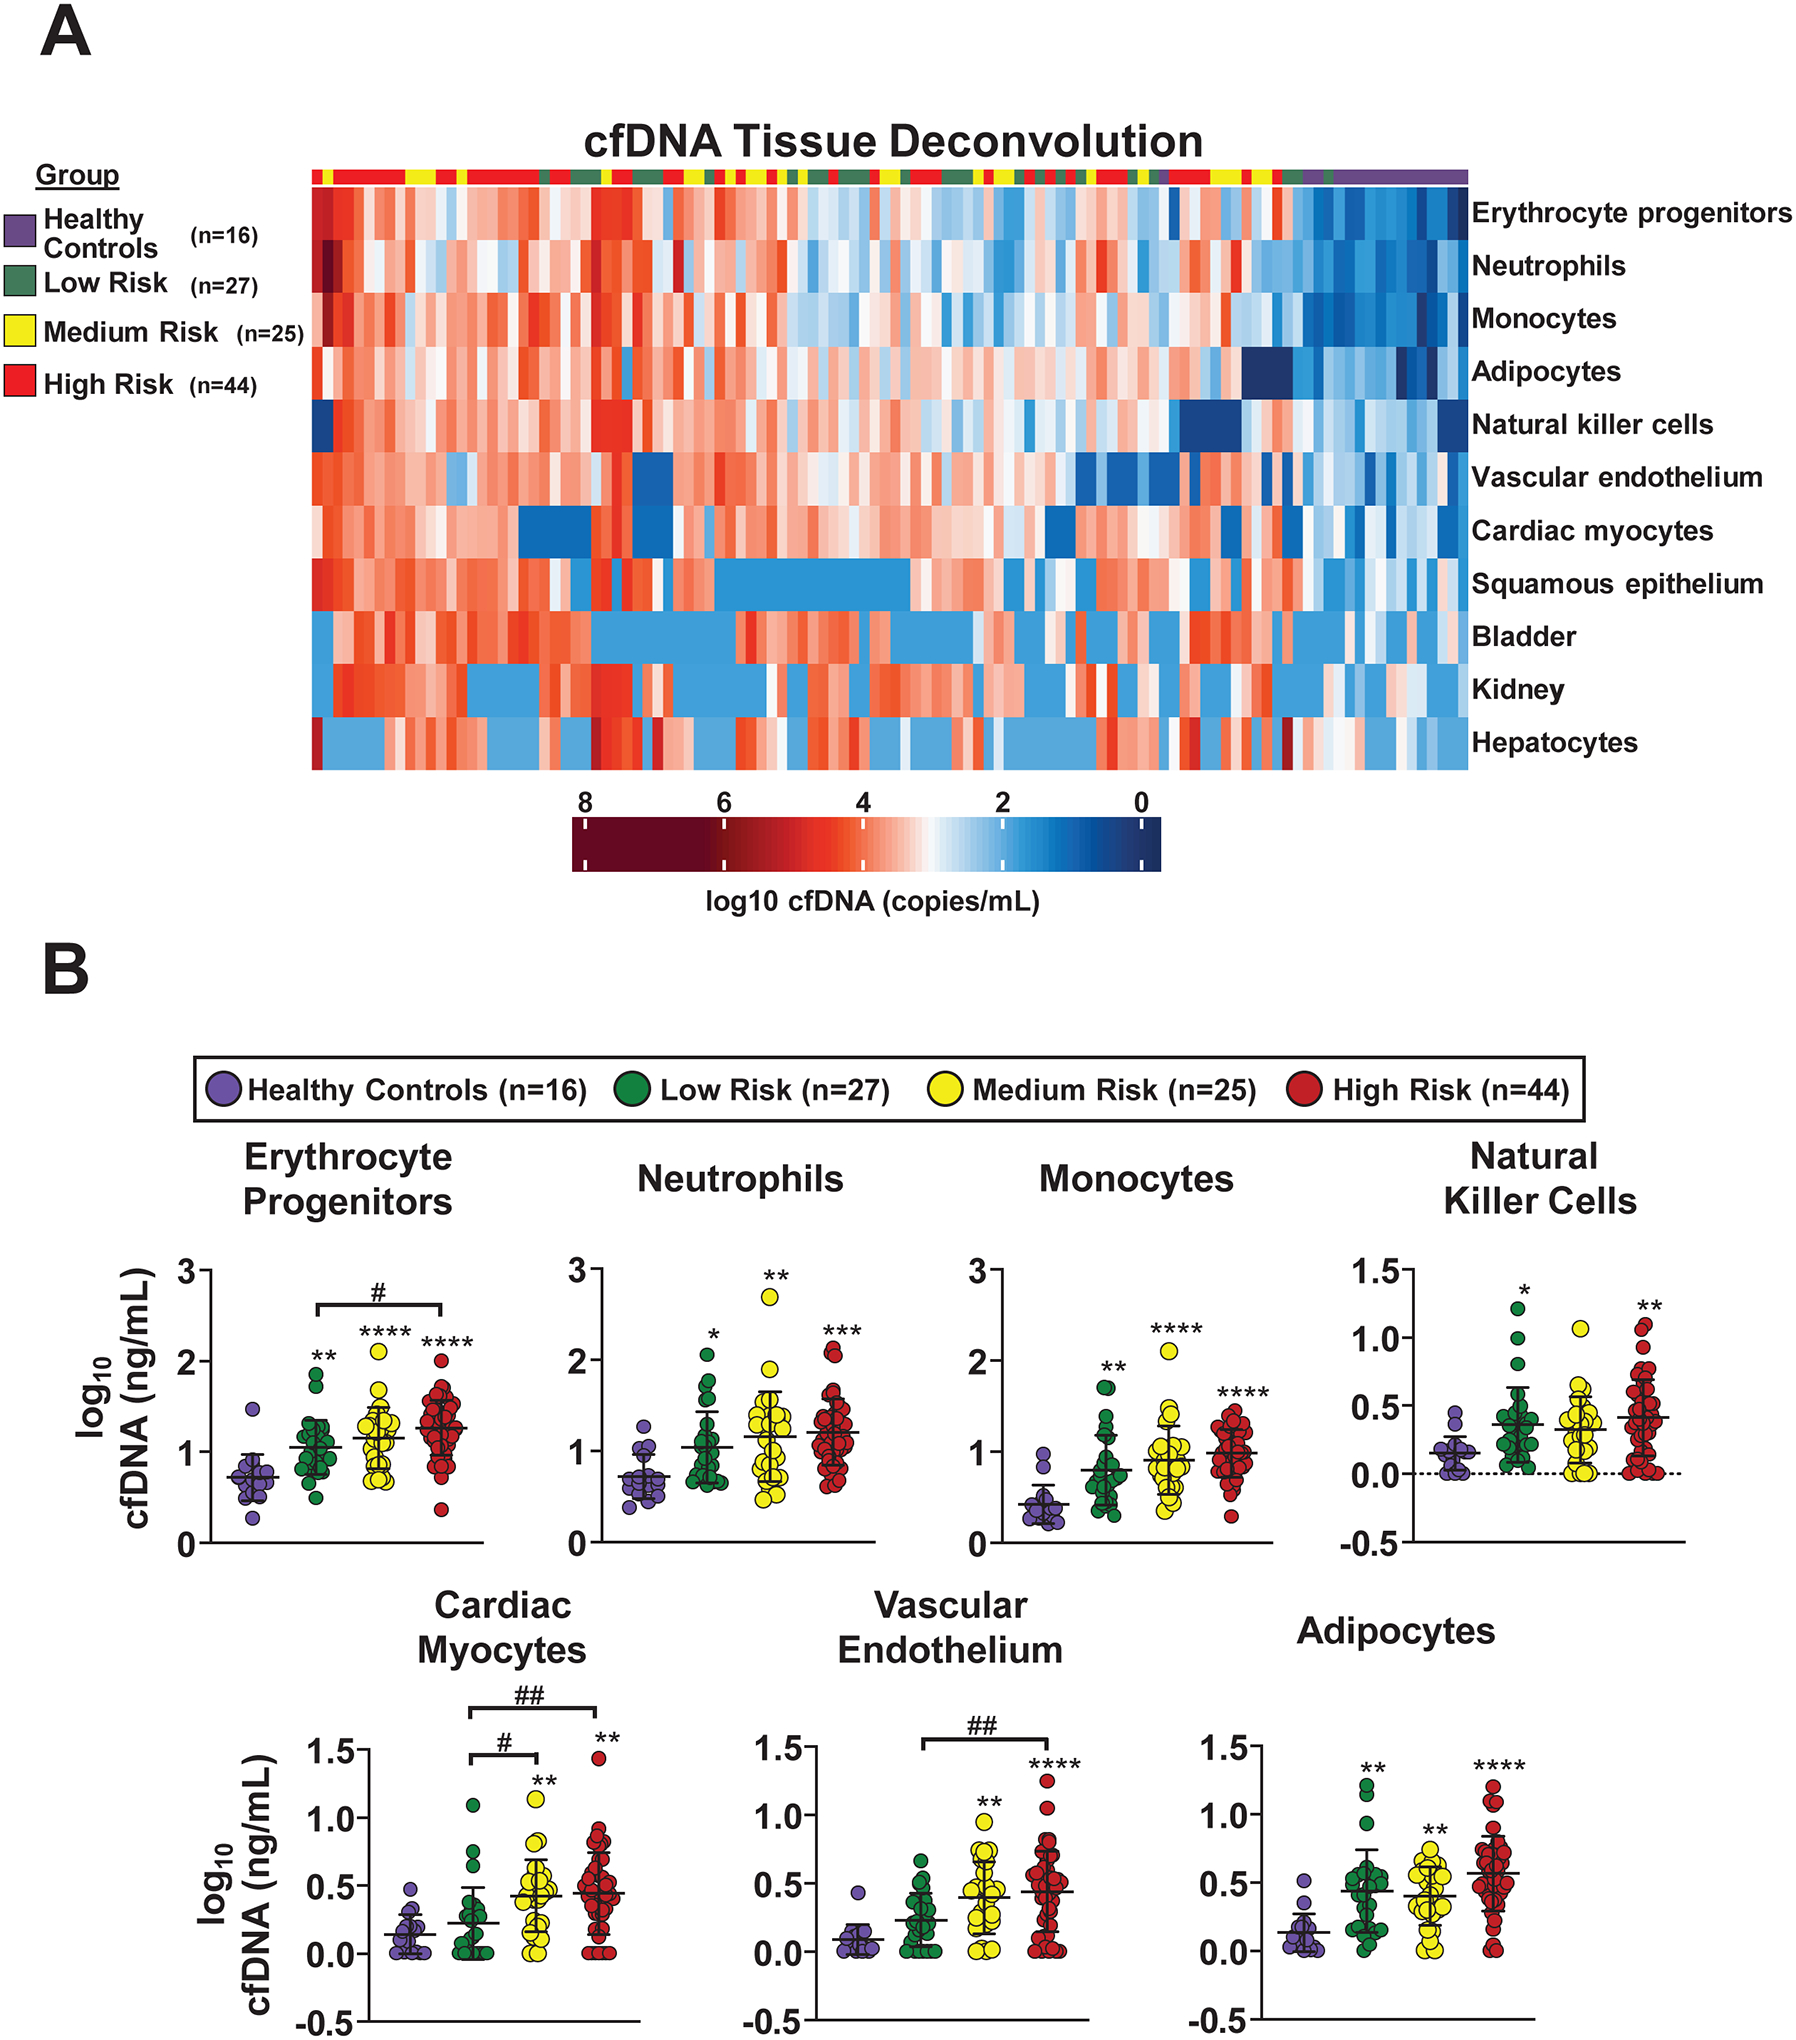
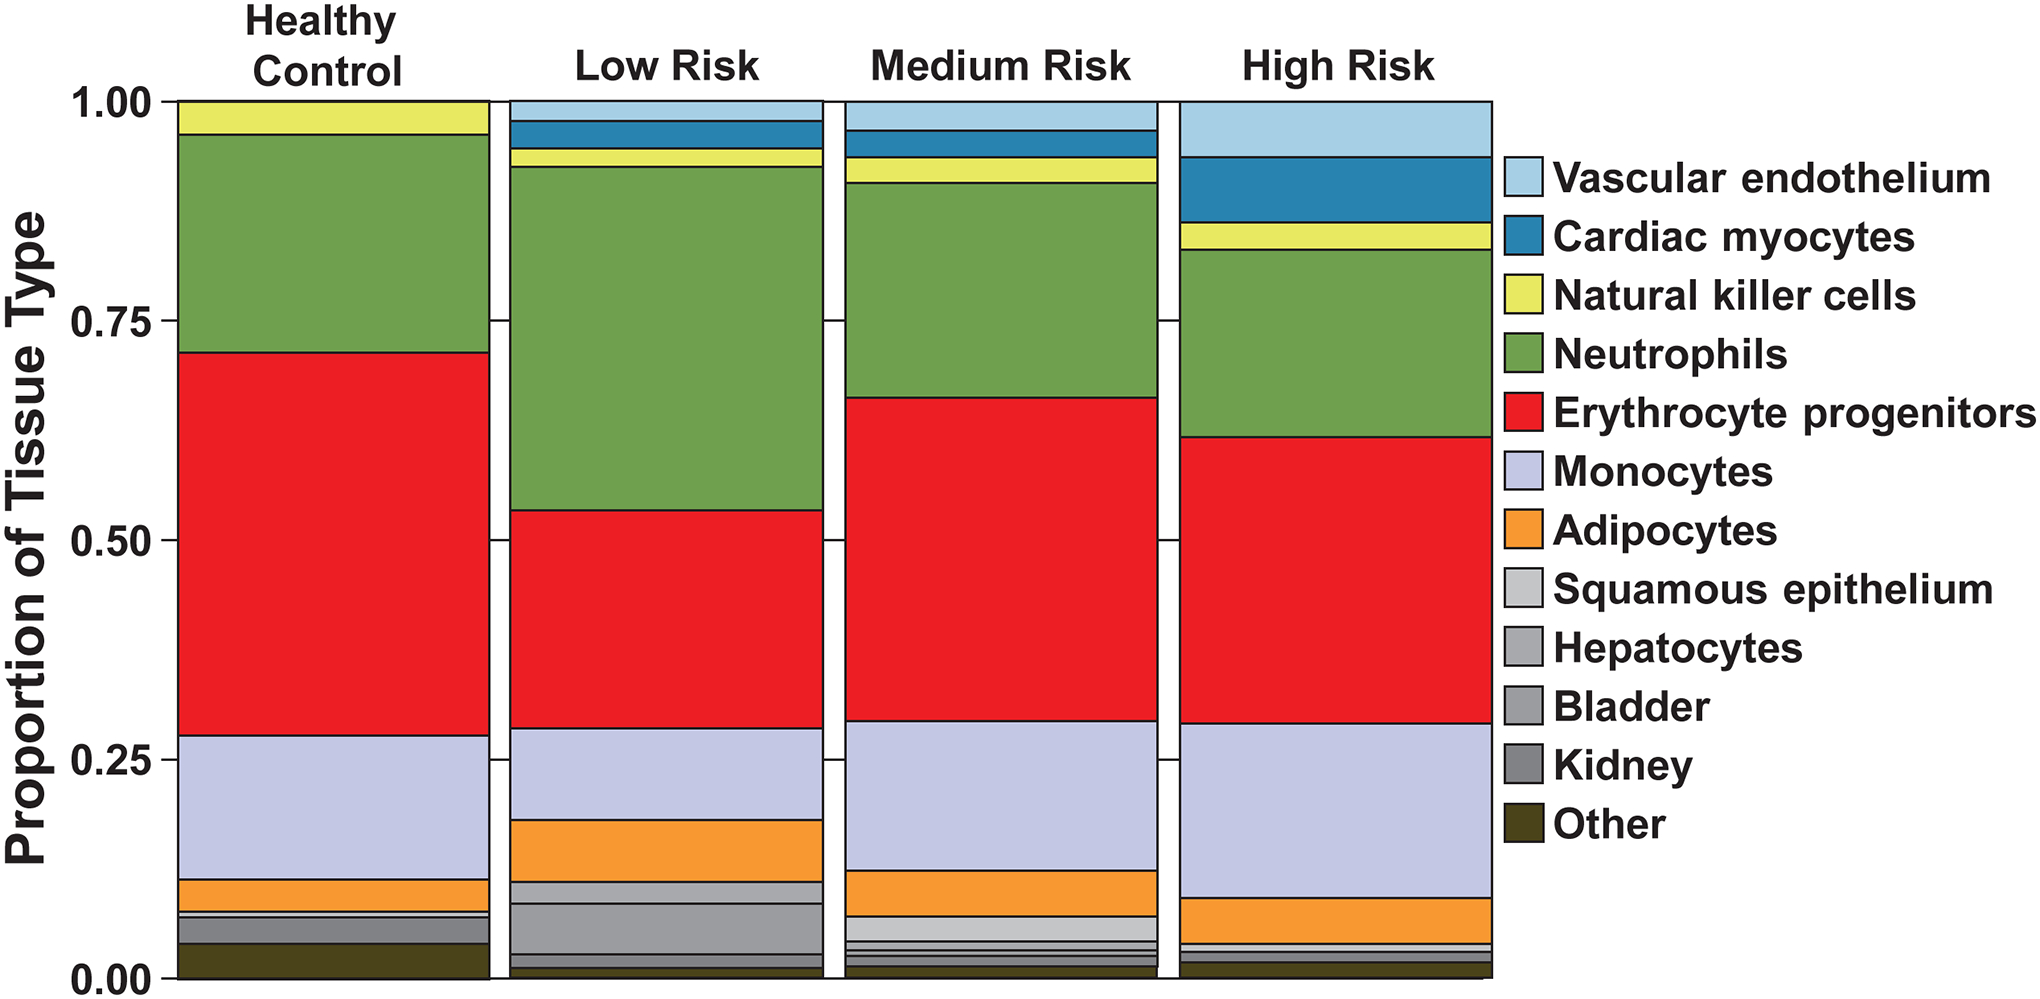
Methods: Plasma cfDNA was measured in 2 PAH cohorts (A, n=48; B, n=161) and controls (n=48). Data were collected for REVEAL 2.0 (Registry to Evaluate Early and Long-Term PAH Disease Management) scores and outcome determinations. Patients were divided into the following REVEAL risk groups: low (≤6), medium (7-8), and high (≥9). Total cfDNA concentrations were compared among controls and PAH risk groups by 1-way analysis of variance. Log-rank tests compared survival between cfDNA tertiles and REVEAL risk groups. Areas under the receiver operating characteristic curve were estimated from logistic regression models. A sample subset from cohort B (n=96) and controls (n=16) underwent bisulfite sequencing followed by a deconvolution algorithm to map cell-specific cfDNA methylation patterns, with concentrations compared using t tests.

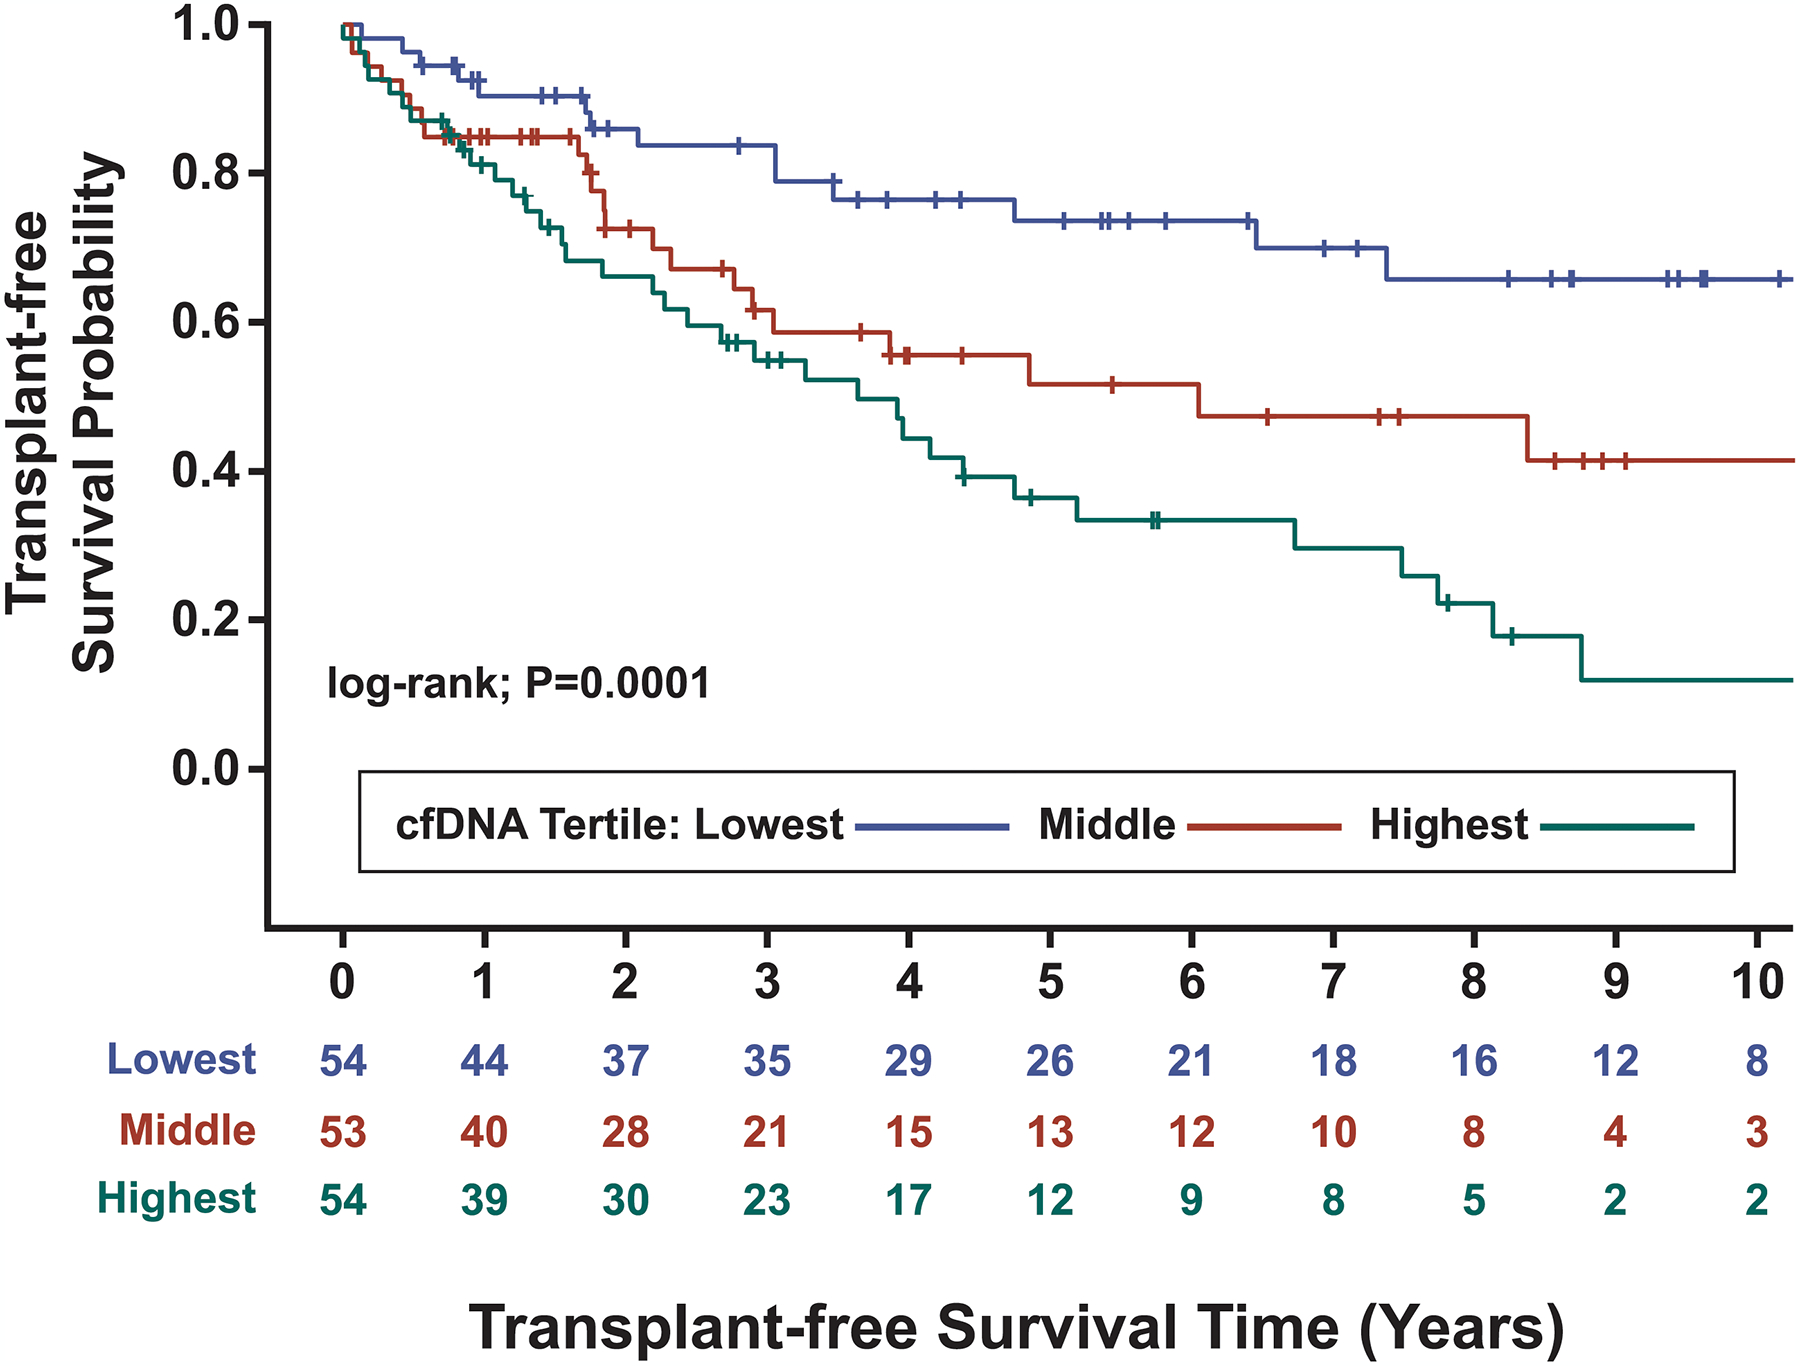
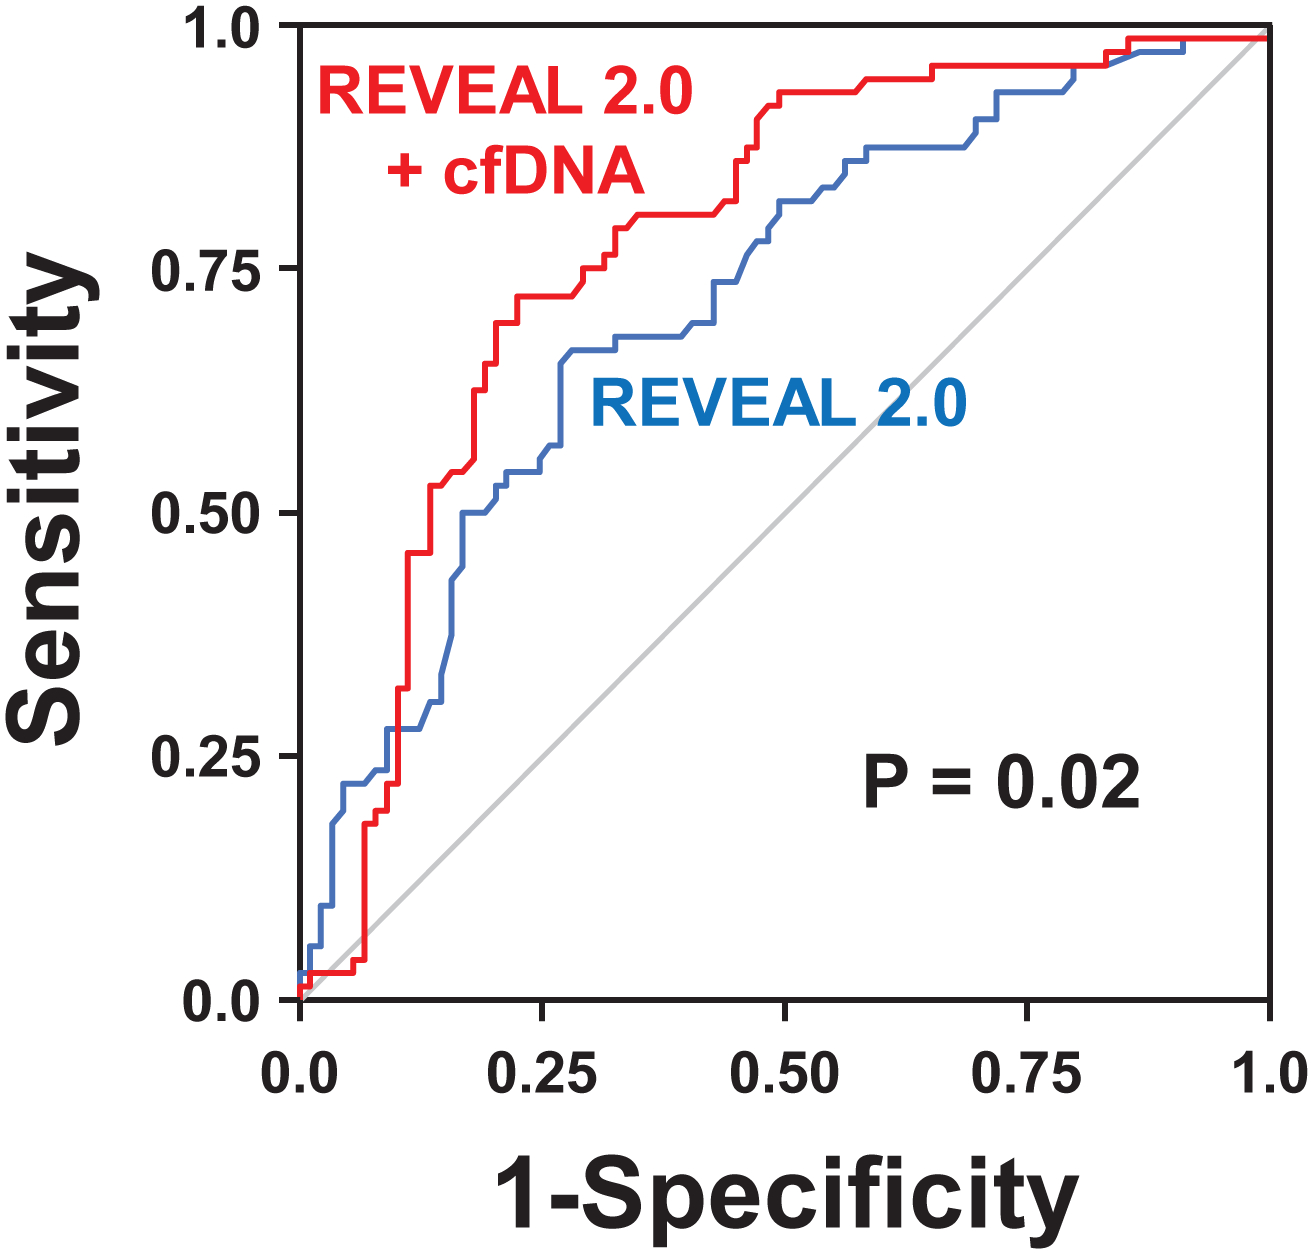
Results: In cohort A, median (interquartile range) age was 62 years (47-71), with 75% female, and median (interquartile range) REVEAL 2.0 was 6 (4-9). In cohort B, median (interquartile range) age was 59 years (49-71), with 69% female, and median (interquartile range) REVEAL 2.0 was 7 (6-9). In both cohorts, cfDNA concentrations differed among patients with PAH of varying REVEAL risk and controls (analysis of variance P≤0.002) and were greater in the high-risk compared with the low-risk category (P≤0.002). In cohort B, death or lung transplant occurred in 14 of 54, 23 of 53, and 35 of 54 patients in the lowest, middle, and highest cfDNA tertiles, respectively. cfDNA levels stratified as tertiles (log-rank: P=0.0001) and REVEAL risk groups (log-rank: P<0.0001) each predicted transplant-free survival. The addition of cfDNA to REVEAL improved discrimination (area under the receiver operating characteristic curve, 0.72-0.78; P=0.02). Compared with controls, methylation analysis in patients with PAH revealed increased cfDNA originating from erythrocyte progenitors, neutrophils, monocytes, adipocytes, natural killer cells, vascular endothelium, and cardiac myocytes (Bonferroni adjusted P<0.05). cfDNA concentrations derived from erythrocyte progenitor cells, cardiac myocytes, and vascular endothelium were greater in patients with PAH with high-risk versus low-risk REVEAL scores (P≤0.02).

Conclusions: Circulating cfDNA is elevated in patients with PAH, correlates with disease severity, and predicts worse survival. Results from cfDNA methylation analyses in patients with PAH are consistent with prevailing paradigms of disease pathogenesis.

Keywords: biomarkers; cell-free nucleic acids; endothelium, vascular; methylation; monocytes; myocytes, cardiac; pulmonary arterial hypertension; risk assessment.


Figures

Figure 1.
Figure 1.. Pulmonary arterial hypertension (PAH) patient sample flow diagram.
Plasma samples selected for cfDNA methylation analysis (n=96) were obtained from patients with idiopathic (n=42), connective tissue disease-associated (n=35) and portal hypertension-associated PAH (n=19). In addition to PAH patients, plasma samples were obtained in consecutively enrolled healthy controls (n=48; mean age 57 years; 32% female) at the NIH Clinical Center Department of Transfuison Medicine. Of these healthy control samples, 16 were randomly selected to undergo additional methylation sequencing analysis. Abbreviations: WHO, World Health Organization; PH, pulmonary hypertension; cfDNA, cell-free DNA; REVEAL, Registry to Evaluate Early And Long-term PAH Disease Management; IPAH, idiopathic PAH; CTD-PAH, connective tissue disease-associated PAH; PoHTN-PAH, portal hypertension-associated PAH.
Figure 2.
Figure 2.. Concentrations of cell-free DNA (cfDNA) are elevated in pulmonary arterial hypertension (PAH) patients and correlate with REVEAL 2.0 risk scores in two separate patient cohorts.
Healthy control and PAH patient cfDNA concentrations are displayed as mean +/− SD of log10-transformed values. Patients were divided into three risk groups based on REVEAL 2.0 score: low (≤ 6), medium (7–8), and high (≥ 9). In Cohort A (n=48), analysis of variance between the healthy control group and the three risk groups of PAH patients was significant (P=0.002) as were pairwise comparisons of high-risk PAH patients with healthy controls and low-risk patients (P=0.002 for both). Four patients in Cohort A died during follow-up (black data points). In Cohort B (n=161), analysis of variance across all 4 groups was also significant (P<0.0001). Pairwise comparisons identified significantly higher cfDNA concentrations in all three PAH risk groups compared with healthy controls (P<0.0001 for all). cfDNA concentration was also significantly greater in medium (P=0.02) and high-risk PAH patients (P=0.0008) compared with low-risk patients. P-values for pairwise comparisons were adjusted for multiple comparisons. ** P<0.01; **** P<0.0001 for PAH risk group versus healthy controls. # P<0.05; ## P<0.01; ### P<0.001 for comparisons between PAH risk groups.
Figure 3.
Figure 3.. Elevated cell-free DNA (cfDNA) concentrations are associated with lower transplant-free survival in Cohort B pulmonary arterial hypertension (PAH) patients.
Kaplan-Meier analysis over a median (IQR) follow up time of 2.7 (1.0–5.2) years demonstrated significantly different transplant-free survival amongst cfDNA tertiles (log-rank test: P=0.0001). Corresponding concentrations for each cfDNA tertile are as follows: ≤ 28.99 ng/ml (blue line), 28.99 < cfDNA ≤ 61.12 ng/ml (red line), and > 61.12 ng/ml (green line). Patients were censored at the time of death or transplantation.
Figure 4.
Figure 4.. Receiver operating characteristic analyses of REVEAL 2.0 risk and REVEAL 2.0 risk with the addition of cell-free DNA (cfDNA) for predicting death or lung transplant in Cohort B.
After adjusting for both age and sex, the area under the curve (AUC) of receiver operating characteristics for REVEAL 2.0 risk categories (blue line) was similar to the performance of cfDNA tertiles (line not shown) in Cohort B (AUC of 0.72 versus 0.75; P=0.29). The predictive performance of REVEAL 2.0 risk classification significantly improved with the addition of cfDNA tertiles (red line), with the AUC increasing from 0.72 to 0.78 (P=0.02).
Figure 5.
Figure 5.. Patients with pulmonary arterial hypertension (PAH) demonstrate a distinct and pathobiologically meaningful cell-free DNA (cfDNA) injury pattern.
A, Unsupervised clustering of absolute cfDNA concentrations from 11 different cell types in a subset of Cohort B PAH patients (n=96) and healthy controls (n=16; Purple ribbon). After bisulfite sequencing, cfDNA sequence reads were analyzed against a library of 25 cell-specific DNA methylation signatures to deconvolve the cfDNA tissue of origin. The analysis was limited to the 11 cells or tissues that had quantifiable cfDNA present in the majority of patients. Those that were not substantially represented in either PAH patients or healthy controls included B cells, CD4 T cells, CD8 T cells, cortical neurons, thyroid, breast, alveolar epithelium, upper gastrointestinal tract, colon, pancreatic beta cells, pancreatic acinar cells, pancreatic duct cells, prostate, and uterus/cervix. PAH patients were grouped into low (≤ 6, n=27; Green ribbon), medium (7–8, n=25; Yellow ribbon), and high-risk (≥ 9, n=44; Red ribbon) categories based on REVEAL 2.0 risk score. Each column represents an individual patient or healthy control and each row represents a specific cell or tissue type. Therefore, the intersection of each column and row represents an individual’s absolute cfDNA concentration from a specific cell or tissue type. cfDNA is represented in copies/mL of plasma and reported in log scale from lowest (blue) to highest (red) values. B, Cell-specific cfDNA concentrations are displayed as mean +/− SD of log10-transformed values. Patients were divided into three risk groups based on REVEAL 2.0 score: low (≤ 6), medium (7–8), and high (≥ 9). Only the seven cell types that were significantly elevated in PAH patients compared with healthy controls are depicted (Bonferroni adjusted P<0.05 for all). Pairwise comparisons between PAH patients and healthy controls are illustrated with asterisks (* P<0.05; ** P<0.01; *** P<0.001; **** P<0.0001). Pairwise comparisons between PAH patients of varying risk are illustrated with pound signs (# P<0.05; ## P<0.01). Erythrocyte progenitor cells, cardiac myocytes, and vascular endothelium differentiated between PAH patients of varying REVEAL 2.0 risk. All comparisons were corrected for multiple testing.
Figure 6.
Figure 6.. Representative cell-free DNA (cfDNA) distributions by origin from a healthy control and pulmonary arterial hypertension (PAH) patients of low, medium, and high risk.
A stacked bar graph displays the proportion of cfDNA (in log10-transformed copies/mL) originating from specific cell or tissue types for a representative healthy control and 3 PAH patients of varying risk. Patients were grouped into low (≤ 6), medium (7–8), and high risk (≥ 9) categories based on REVEAL 2.0 risk score. Each cell or tissue is identified by a specific color, with the length of the stacked segment corresponding to the relative contribution of that source to the total concentration of cfDNA. For healthy control, low, medium, and high risk individuals, the other category consisted of 2, 1, 3, and 4 sources, respectively, that did not have quantifiable cfDNA present in the majority of patients.

Similar articles

Cited by

References

    1. Galie N, Channick RN, Frantz RP, Grunig E, Jing ZC, Moiseeva O, Preston IR, Pulido T, Safdar Z, Tamura Y, et al. Risk stratification and medical therapy of pulmonary arterial hypertension. Eur Respir J. 2019;53: 1801889. - PMC - PubMed
    1. Galie N, Humbert M, Vachiery JL, Gibbs S, Lang I, Torbicki A, Simonneau G, Peacock A, Vonk Noordegraaf A, Beghetti M, et al. 2015 ESC/ERS Guidelines for the diagnosis and treatment of pulmonary hypertension: The Joint Task Force for the Diagnosis and Treatment of Pulmonary Hypertension of the European Society of Cardiology (ESC) and the European Respiratory Society (ERS): Endorsed by: Association for European Paediatric and Congenital Cardiology (AEPC), International Society for Heart and Lung Transplantation (ISHLT). Eur Heart J. 2016;37:67–119. - PubMed
    1. Nagaya N, Uematsu M, Satoh T, Kyotani S, Sakamaki F, Nakanishi N, Yamagishi M, Kunieda T and Miyatake K. Serum uric acid levels correlate with the severity and the mortality of primary pulmonary hypertension. Am J Respir Crit Care Med. 1999;160:487–92. - PubMed
    1. Torbicki A, Kurzyna M, Kuca P, Fijalkowska A, Sikora J, Florczyk M, Pruszczyk P, Burakowski J and Wawrzynska L. Detectable serum cardiac troponin T as a marker of poor prognosis among patients with chronic precapillary pulmonary hypertension. Circulation. 2003;108:844–8. - PubMed
    1. Quarck R, Nawrot T, Meyns B and Delcroix M. C-reactive protein: a new predictor of adverse outcome in pulmonary arterial hypertension. J Am Coll Cardiol. 2009;53:1211–8. - PubMed

Publication types