

The influence of entropic crowding in cell monolayers
- PMID: 36004781
- PMCID: PMC9703008
- DOI: 10.1016/j.bpj.2022.08.030
The influence of entropic crowding in cell monolayers
Abstract
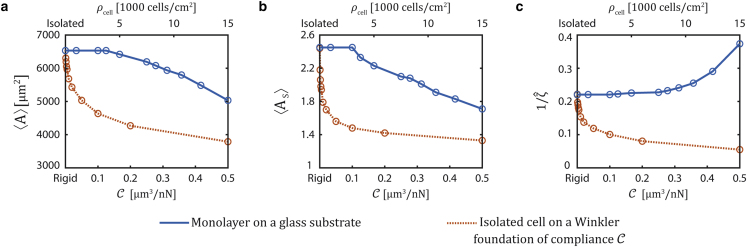
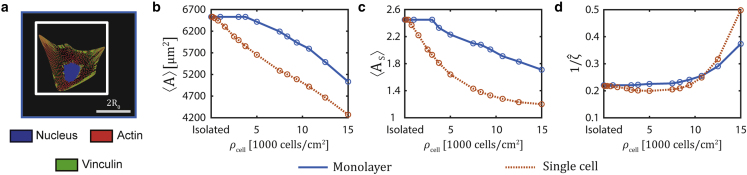
Cell-cell interaction dictates cell morphology and organization, which play a crucial role in the micro-architecture of tissues that guides their biological and mechanical functioning. Here, we investigate the effect of cell density on the responses of cells seeded on flat substrates using a novel statistical thermodynamics framework. The framework recognizes the existence of nonthermal fluctuations in cellular response and thereby naturally captures entropic interactions between cells in monolayers. In line with observations, the model predicts that cell area and elongation decrease with increasing cell seeding density-both are a direct outcome of the fluctuating nature of the cellular response that gives rise to enhanced cell-cell interactions with increasing cell crowding. The modeling framework also predicts the increase in cell alignment with increasing cell density: this cellular ordering is also due to enhanced entropic interactions and is akin to nematic ordering in liquid crystals. Our simulations provide physical insights that suggest that entropic cell-cell interactions play a crucial role in governing the responses of cell monolayers.
Copyright © 2022 Biophysical Society. Published by Elsevier Inc. All rights reserved.
Conflict of interest statement
Declaration of interests The authors declare no competing interests.
Figures


Comment in
-
Collective organization from cellular disorder.Biophys J. 2022 Nov 15;121(22):4239-4241. doi: 10.1016/j.bpj.2022.10.010. Epub 2022 Oct 8. Biophys J. 2022. PMID: 36272406 Free PMC article. No abstract available.
Similar articles
-
Contact guidance via heterogeneity of substrate elasticity.Acta Biomater. 2023 Jun;163:158-169. doi: 10.1016/j.actbio.2021.11.024. Epub 2021 Nov 20. Acta Biomater. 2023. PMID: 34808415
-
Entropic Forces Drive Cellular Contact Guidance.Biophys J. 2019 May 21;116(10):1994-2008. doi: 10.1016/j.bpj.2019.04.003. Epub 2019 Apr 10. Biophys J. 2019. PMID: 31053262 Free PMC article.
-
Density functional theory for chiral nematic liquid crystals.Phys Rev E Stat Nonlin Soft Matter Phys. 2014 Aug;90(2):020503. doi: 10.1103/PhysRevE.90.020503. Epub 2014 Aug 27. Phys Rev E Stat Nonlin Soft Matter Phys. 2014. PMID: 25215676
-
Entropic control of nanoparticle self-assembly through confinement.Nanoscale Horiz. 2022 Aug 22;7(9):1016-1028. doi: 10.1039/d2nh00156j. Nanoscale Horiz. 2022. PMID: 35762392 Review.
-
The influence of disorder on thermotropic nematic liquid crystals phase behavior.Int J Mol Sci. 2009 Sep 10;10(9):3971-4008. doi: 10.3390/ijms10093971. Int J Mol Sci. 2009. PMID: 19865529 Free PMC article. Review.
Cited by
-
Topographical influence of electrospun basement membrane mimics on formation of cellular monolayer.Sci Rep. 2023 May 24;13(1):8382. doi: 10.1038/s41598-023-34934-x. Sci Rep. 2023. PMID: 37225757 Free PMC article.
-
Quantitative characterization of non-specific interaction of two globular proteins with Dextran T70 in a binary mixture.Eur Biophys J. 2024 Nov;53(7-8):465-472. doi: 10.1007/s00249-024-01727-7. Epub 2024 Oct 25. Eur Biophys J. 2024. PMID: 39455448
-
Collective organization from cellular disorder.Biophys J. 2022 Nov 15;121(22):4239-4241. doi: 10.1016/j.bpj.2022.10.010. Epub 2022 Oct 8. Biophys J. 2022. PMID: 36272406 Free PMC article. No abstract available.
References
-
- Yeung T., Georges P.C., et al. Janmey P.A. Effects of substrate stiffness on cell morphology, cytoskeletal structure, and adhesion. Cell Motil Cytoskeleton. 2005;60:24–34. - PubMed
-
- Prager-Khoutorsky M., Lichtenstein A., et al. Bershadsky A.D. Fibroblast polarization is a matrix-rigidity-dependent process controlled by focal adhesion mechanosensing. Nat. Cell Biol. 2011;13:1457–1465. - PubMed
-
- Discher D.E., Janmey P., Wang Y.L. Tissue cells feel and respond to the stiffness of their substrate. Science. 2005;310:1139–1143. - PubMed
Publication types
MeSH terms
LinkOut - more resources
Full Text Sources
