

Entamoeba histolytica HM-1: IMSS gene expression profiling identifies key hub genes, potential biomarkers, and pathways in Amoebiasis infection: a systematic network meta-analysis
- PMID: 36004808
- PMCID: PMC9595035
- DOI: 10.1042/BSR20220191
Entamoeba histolytica HM-1: IMSS gene expression profiling identifies key hub genes, potential biomarkers, and pathways in Amoebiasis infection: a systematic network meta-analysis
Abstract
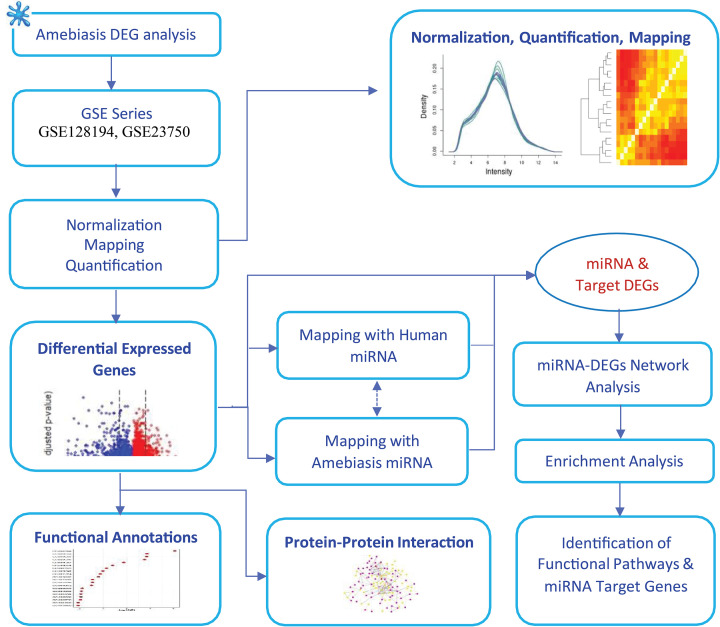
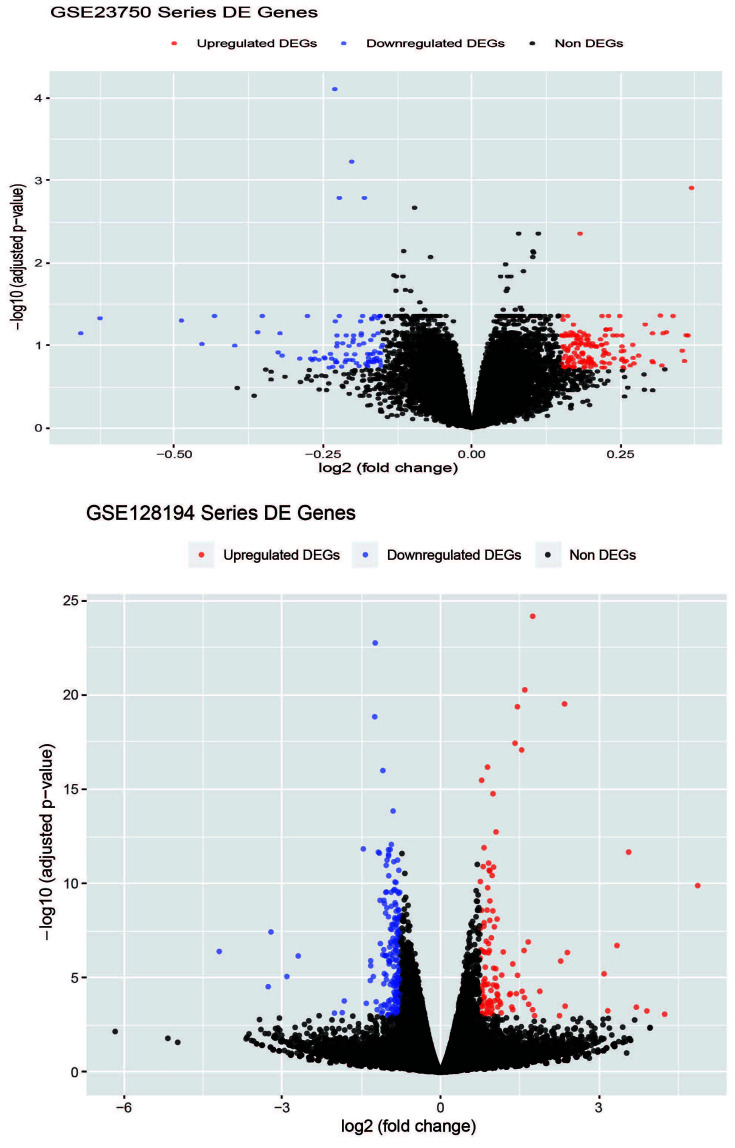
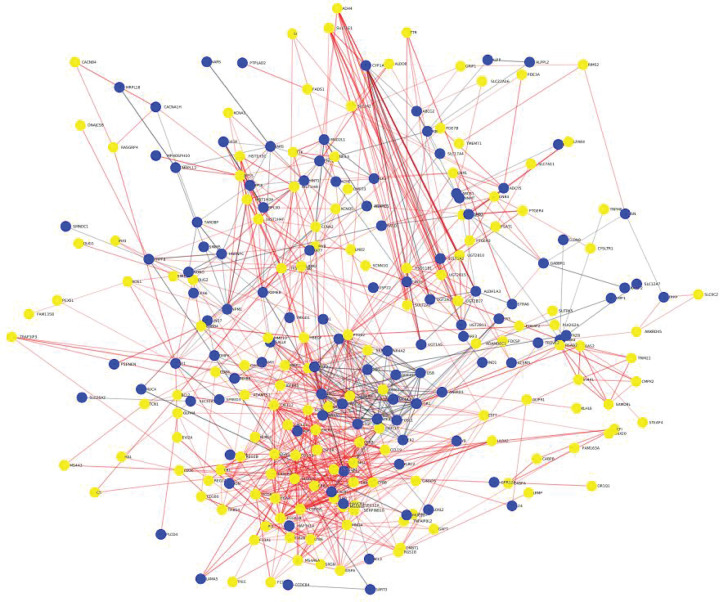
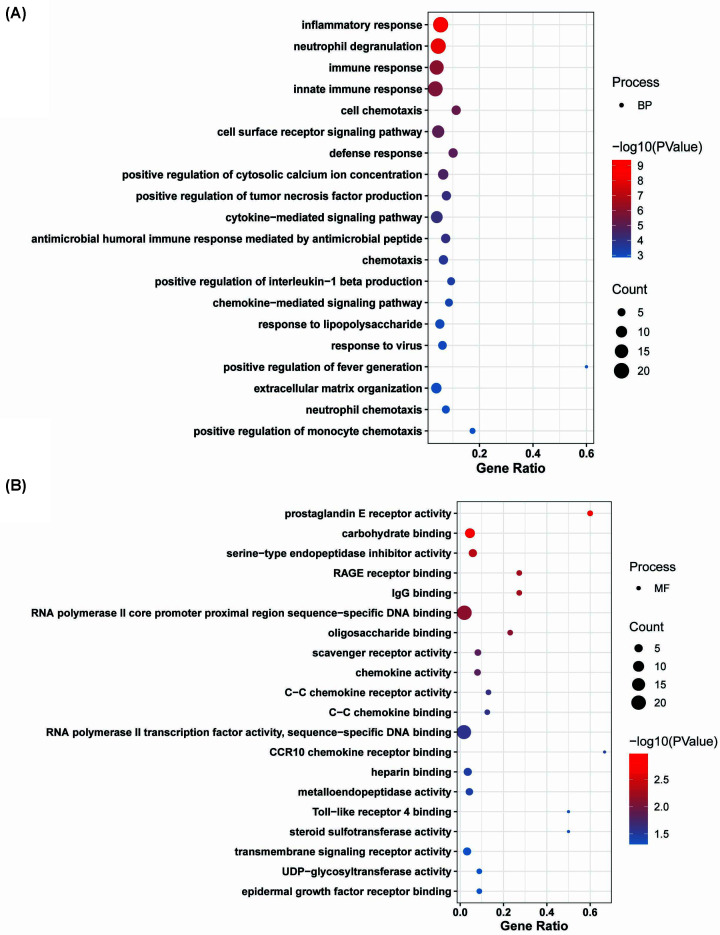
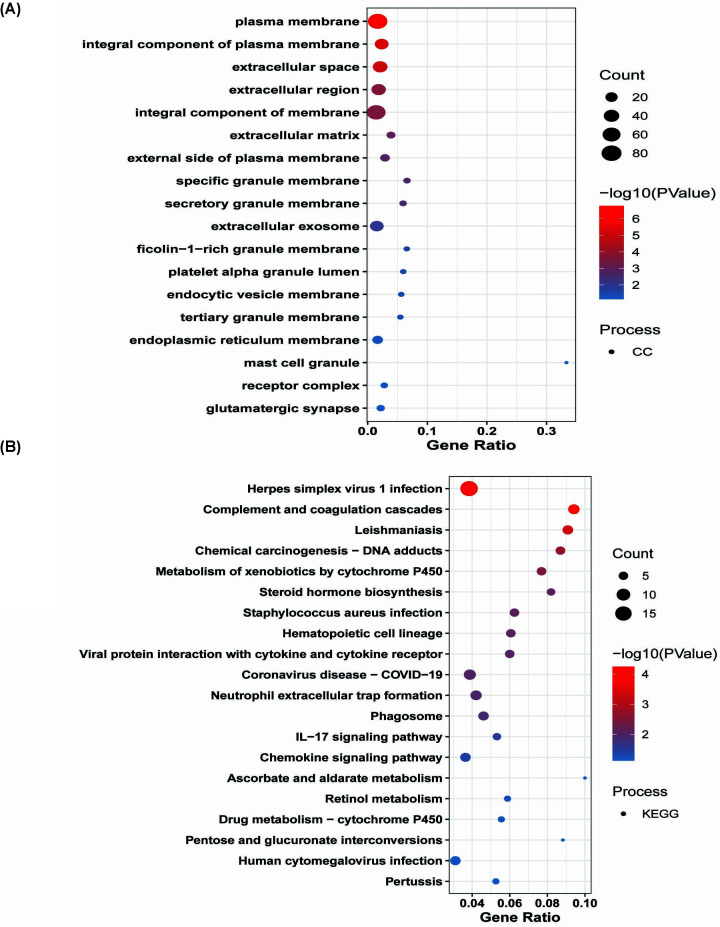
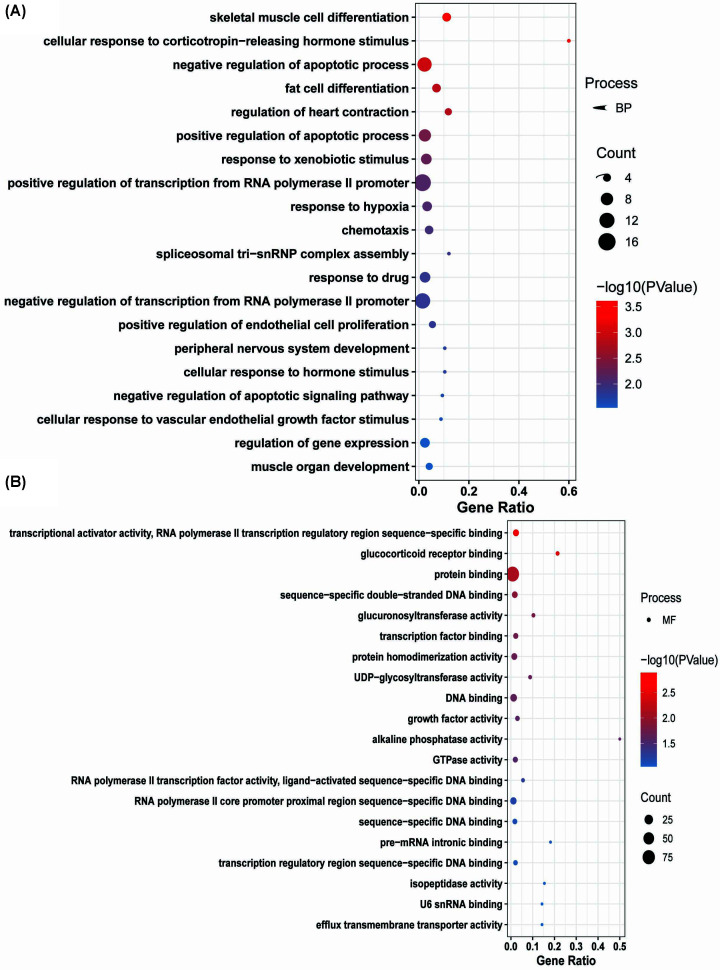
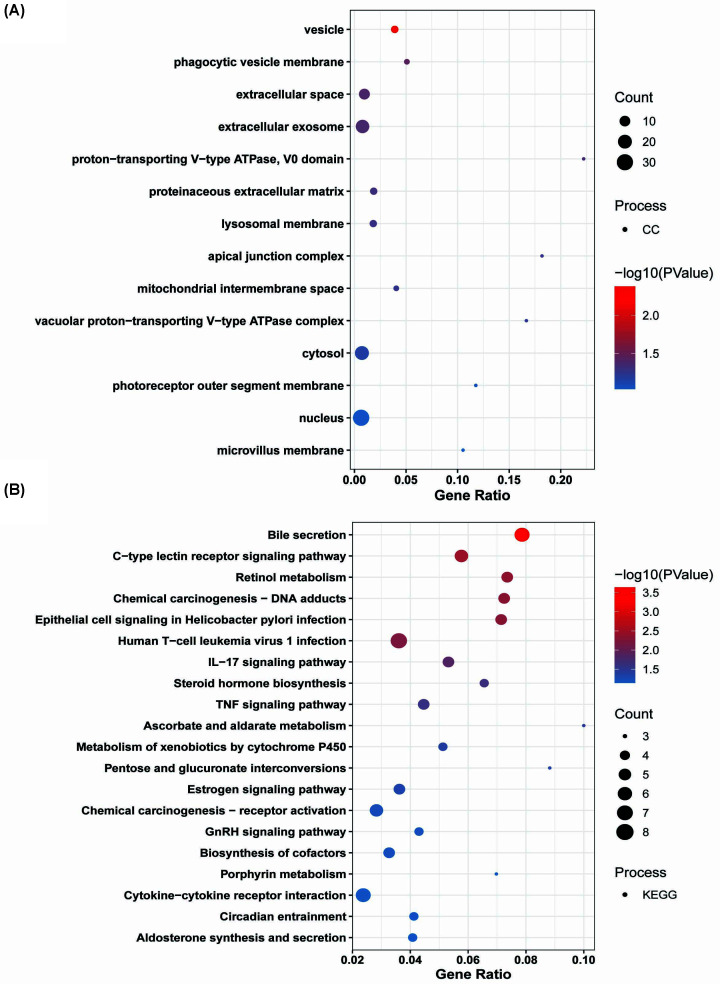
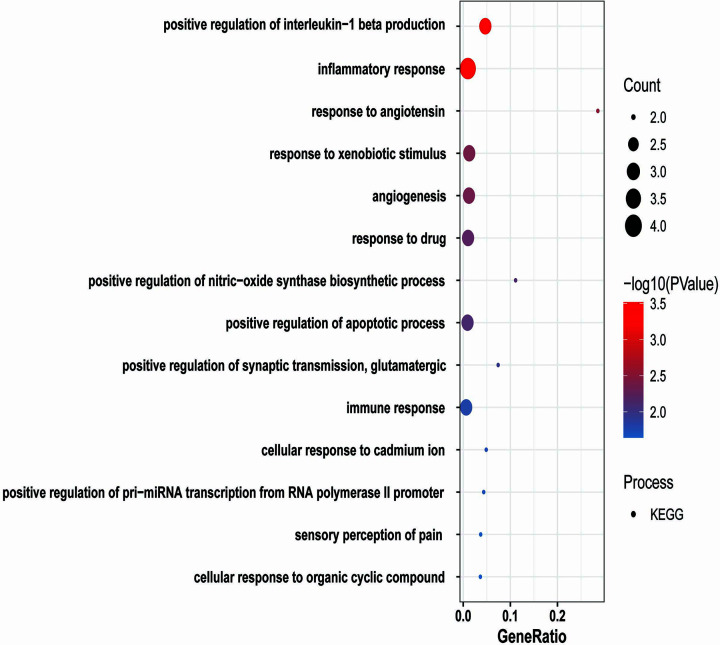
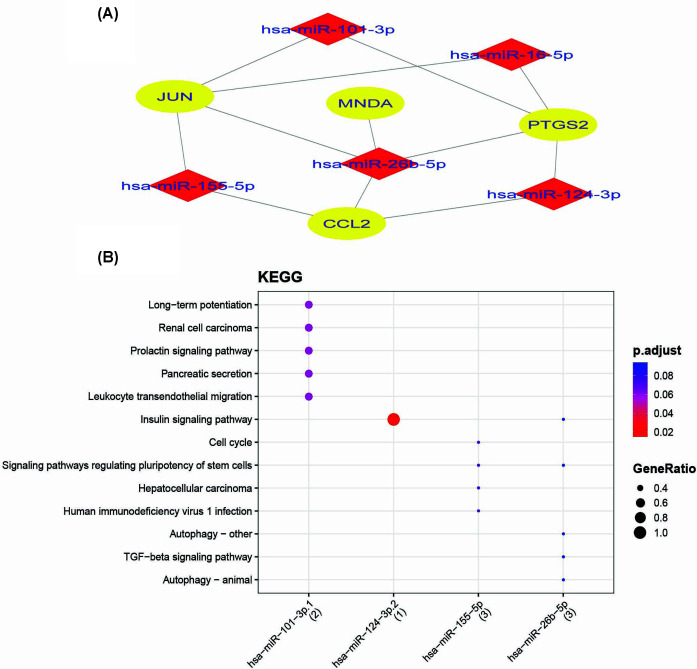
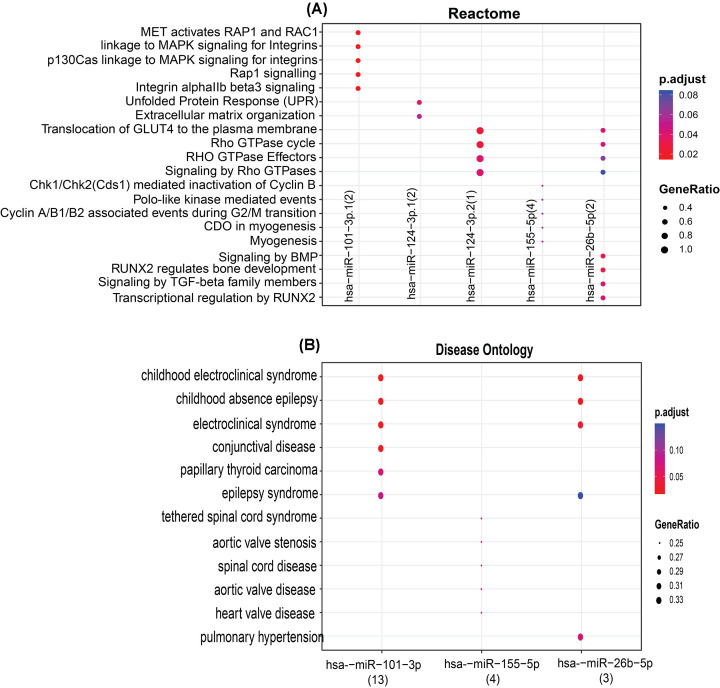
Entamoeba histolytica (E. histolytica) is an anaerobic parasite that causes Amoebiasis in the intestine or extraintestinal, with immunology, genetics, and environmental variables all playing a part in the disease's development, but its molecular mechanism is unknown. One of the primary obstacles in understanding the etiology of Amoebiasis will be identifying the genetics profiling that controls the Amoebiasis network. By examining the gene expression profile of Amoebiasis and comparing it with healthy controls, we could identify differentially expressed genes (DEGs). DEGs were used to build the Amoebiasis protein interaction network and calculated its network topological properties. We discovered nine key hub genes (KHGs): JUN, PTGS2, FCGR3A, MNDA, CYBB, EGR1, CCL2, TLR8, and LRRK2 genes. The genes JUN and EGR1 were transcriptional factors (TFs) and up-regulated, others down-regulated. hsa-miR-155-5p, hsa-miR-101-3p, hsa-miR-124-3p, hsa-miR-26b-5p, and hsa-miR-16-5p are also among the essential miRNAs that have been demonstrated to be targeted by KHGs. These KHGs were primarily enriched in the IL-17 signaling pathway, TNF signaling pathway, NOD-like receptor signaling pathway, and Toll-like receptor signaling pathway. miRNAs were grouped in various pathways, focusing on the TGF-β signaling pathway, human immunodeficiency virus 1 infection, insulin signaling pathway, signaling pathways regulating pluripotency of stem cells, etc. Amoebiasis KHGs (JUN, PTGS2, CCL2, and MNDA) and their associated miRNAs are the primary targets for therapeutic methods and possible biomarkers. Furthermore, we identified drugs for genes JUN, PTGS2, FCGR3A, CCL2, and LRRK2. KHGs, on the other hand, required experimental validation to prove their efficacy.
Keywords: Amoebiasis infection; Differentially expressed genes (DEGs); Gene-interaction network.
© 2022 The Author(s).
Conflict of interest statement
The authors declare that there are no competing interests associated with the manuscript.
Figures
Similar articles
-
Deciphering Shared Gene Signatures and Immune Infiltration Characteristics Between Gestational Diabetes Mellitus and Preeclampsia by Integrated Bioinformatics Analysis and Machine Learning.Reprod Sci. 2025 Jun;32(6):1886-1904. doi: 10.1007/s43032-025-01847-1. Epub 2025 May 15. Reprod Sci. 2025. PMID: 40374866
-
Exploring virulence and stress response in Entamoeba histolytica: insights from clinical strains.Microbiol Spectr. 2025 Jul;13(7):e0050625. doi: 10.1128/spectrum.00506-25. Epub 2025 Jun 9. Microbiol Spectr. 2025. PMID: 40488464 Free PMC article.
-
MicroRNAs in oral fluids (saliva and gingival crevicular fluid) as biomarkers in orthodontics: systematic review and integrated bioinformatic analysis.Prog Orthod. 2021 Oct 11;22(1):31. doi: 10.1186/s40510-021-00377-1. Prog Orthod. 2021. PMID: 34632546 Free PMC article.
-
Potential liquid biopsy markers of exosomal microRNAs in renal interstitial fibrosis blood and urine.Indian J Pathol Microbiol. 2025 Apr 1;68(2):279-286. doi: 10.4103/ijpm.ijpm_265_24. Epub 2024 Oct 17. Indian J Pathol Microbiol. 2025. PMID: 39787458
-
Systemic pharmacological treatments for chronic plaque psoriasis: a network meta-analysis.Cochrane Database Syst Rev. 2017 Dec 22;12(12):CD011535. doi: 10.1002/14651858.CD011535.pub2. Cochrane Database Syst Rev. 2017. Update in: Cochrane Database Syst Rev. 2020 Jan 9;1:CD011535. doi: 10.1002/14651858.CD011535.pub3. PMID: 29271481 Free PMC article. Updated.
Cited by
-
Regulatory Functions of Hypoxia in Host-Parasite Interactions: A Focus on Enteric, Tissue, and Blood Protozoa.Microorganisms. 2023 Jun 16;11(6):1598. doi: 10.3390/microorganisms11061598. Microorganisms. 2023. PMID: 37375100 Free PMC article. Review.
-
A bioinformatics approach to systematically analyze the molecular patterns of monkeypox virus-host cell interactions.Heliyon. 2024 Apr 29;10(9):e30483. doi: 10.1016/j.heliyon.2024.e30483. eCollection 2024 May 15. Heliyon. 2024. PMID: 38737277 Free PMC article.
-
Identification of key regulators in pancreatic ductal adenocarcinoma using network theoretical approach.PLoS One. 2025 Jan 27;20(1):e0313738. doi: 10.1371/journal.pone.0313738. eCollection 2025. PLoS One. 2025. PMID: 39869563 Free PMC article.
-
Combinatorial Network of Transcriptional and miRNA Regulation in Colorectal Cancer.Int J Mol Sci. 2023 Mar 10;24(6):5356. doi: 10.3390/ijms24065356. Int J Mol Sci. 2023. PMID: 36982429 Free PMC article.
References
-
- Carrero J.C., Reyes-Lopez M., Serrano-Luna J., Shibayama M., Unzueta J., Leon-Sicairos N.et al. . (2020) Intestinal Amoebiasis: 160 years of its first detection and still remains as a health problem in developing countries. Int. J. Med. Microbiol. 310, 151358 10.1016/j.ijmm.2019.151358 - DOI - PubMed
-
- James W.M. and Getz L. (1928) Human amoebiasis due to infection with Entamoeba Histolytica: a description of the photographs. Ann. Tropical Med. Parasitol. 22, 201–258 10.1080/00034983.1928.11684573 - DOI
Publication types
MeSH terms
Substances
LinkOut - more resources
Full Text Sources
Medical
Research Materials
Miscellaneous