Review
. 2022 Aug 2;12(8):590.
doi: 10.3390/bios12080590.

Miniaturized Raman Instruments for SERS-Based Point-of-Care Testing on Respiratory Viruses

Affiliations
Review

Miniaturized Raman Instruments for SERS-Based Point-of-Care Testing on Respiratory Viruses

Ahmed Ali et al. Biosensors (Basel). .

Abstract

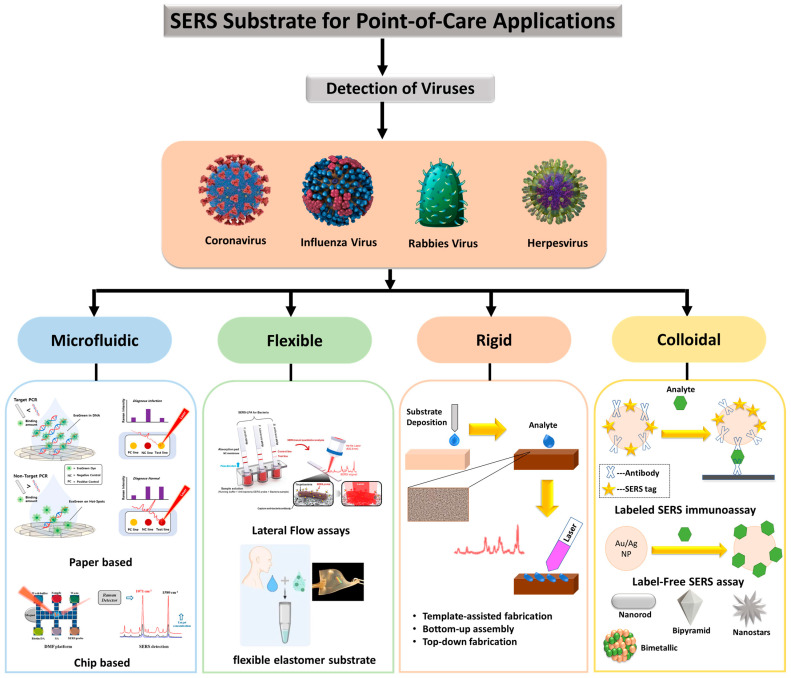
As surface-enhanced Raman scattering (SERS) has been used to diagnose several respiratory viruses (e.g., influenza A virus subtypes such as H1N1 and the new coronavirus SARS-CoV-2), SERS is gaining popularity as a method for diagnosing viruses at the point-of-care. Although the prior and quick diagnosis of respiratory viruses is critical in the outbreak of infectious disease, ELISA, PCR, and RT-PCR have been used to detect respiratory viruses for pandemic control that are limited for point-of-care testing. SERS provides quantitative data with high specificity and sensitivity in a real-time, label-free, and multiplex manner recognizing molecular fingerprints. Recently, the design of Raman spectroscopy system was simplified from a complicated design to a small and easily accessible form that enables point-of-care testing. We review the optical design (e.g., laser wavelength/power and detectors) of commercialized and customized handheld Raman instruments. As respiratory viruses have prominent risk on the pandemic, we review the applications of handheld Raman devices for detecting respiratory viruses. By instrumentation and commercialization advancements, the advent of the portable SERS device creates a fast, accurate, practical, and cost-effective analytical method for virus detection, and would continue to attract more attention in point-of-care testing.

Keywords: Raman scattering; pandemic; point-of-care testing device; respiratory viruses; surface-enhanced Raman spectroscopy.


Conflict of interest statement

The authors declare no conflict of interest.

Figures

Figure 1
Figure 1
Schematic of Raman scattering. (a) Raman scattering is classified into Stokes and anti-Stokes Raman scattering based on the vibrational energy changes. Relative to the incident energy, vibrational energy of the scattered light is lower in the case of Stokes Raman scattering, higher in the case of anti-Stokes Raman scattering, and constant for Rayleigh scattering. (b) The scattering of photons by irradiated molecules is predominantly elastic (Rayleigh scattering), accounting for approximately 99.9% of the scattered light. The remaining 0.1% of the scattering is attributed to an inelastic Raman scattering.
Figure 2
Figure 2
(a) A schematic comparison of the Raman and SERS phenomena. (b) SERS electromagnetic and chemical enhancements’ schematic.
Figure 3
Figure 3
The number of articles published each year employs a handheld Raman equipment to identify the substance.
Figure 4
Figure 4
List of the most important factors to consider when performing SERS measurements at the point of care.
Figure 5
Figure 5
Features of Raman spectroscopy. (a) Schematic representation of the Raman shift from light scattering. It can be observed that an incident monochromatic laser with a wavenumber of 18,797 cm−1 is scattered at a wavenumber of 15,385 cm−1. The resulting wavenumber change of 3400 cm−1 is due to the vibrational energy changes of the molecules. (b) Effect of long-pass and band-pass filters on generated signals. Recorded signals from light scattering are generated by anti-Stokes Raman scattering, Stokes Raman scattering, and Rayleigh scattering. Rejection filters are required to eliminate Rayleigh signals. They work by allowing and attenuating signals at specified frequencies to measure Raman spectra. Collection geometries in Raman spectroscopy: (c) Backscattered geometry, (d) Transmission geometry, and (e) Right-angle geometry. Backscattered and Transmission geometries require Rayleigh rejection filters to eliminate the noise resulting from Rayleigh scattering and back-reflected excitation light. Unlike the former two geometries, the configuration of right-angle geometry yields little noise, and, hence, rejection filters are not required.
Figure 6
Figure 6
Portable cost-effective Raman spectrometer models. (a) Schematic representation of an inexpensive Raman spectrometer (left), Components (middle): (i) Laser diode, (ii) Focusing lens, (iii) Beam splitter, (iv) Beam block; to prevent interference from the reflected laser and room light, (v) Long-pass filter, (vi) Focusing lens, (vii) Spectrometer, and (viii) RS232 to USB for GUI device, Exterior view (right). Reproduced with permission from ref. [72]. Copyright 2021 American Chemical Society. (b) Cellphone-based Raman spectrometer constructed from a diffraction grating and cellphone-camera system for in situ detection. Schematic of the spectrometer setup (left), top and front view of the system with the parts labeled (right), and the expenditure of the components and materials used (below). Reproduced with permission from ref. [73]. Copyright 2021 American Institute of Physics (AIP). (c) A low-cost, easy-to-handle, Raman spectrometer built with commercial electronics and optics, and 3D printing. A computer-aided design of the 3D printed Raman Spectrometer (left) and the corresponding setup (right). Reproduced under the Creative Common Attribution 4.0 License (CC BY 4.0) from ref. [74]. Copyright 2018, The Authors, published by CERN.
Figure 7
Figure 7
Illustration of many types of point-of-care SERS platforms that have been described, as well as the various types of viruses that have been identified for various applications. Paper-based SERS substrate cartoons reproduced with permission from ref. [93]. Copyright 2021 Elsevier. Chip-based SERS substrate cartoons reproduced with permission from ref. [94]. Copyright 2018 American Chemical Society. Lateral flow assay SERS substrate cartoons reproduced with permission from ref. [95]. Copyright 2016 John Wiley & Sons, Inc. Flexible elastomer substrate cartoons reproduced with permission from ref. [96]. Copyright 2022 American Chemical Society.
Figure 8
Figure 8
In order to screen the COVID-19 patients, diagnostic testing at point of care could be employed. The screening could happen at any time, from the incubation stage to the symptomatic stage. At various stages, various measures were implemented.
Figure 9
Figure 9
(a) Schematic of the dual-layer Raman reporter molecule 5,5′-dithiobis(2-nitrobenzoic acid (DTNB) modified SiO2-Ag Nanoparticles via LFIA. (b) SARS-CoV-2 S-protein-modified SiO2-Ag SERS probes preparation. (c) The SERS-LFIA strip’s operating concept for simultaneous high-sensitivity anti-SARS-CoV-2 IgM/IgG identification. Reproduced with permission from ref. [130]. Copyright 2021 Elsevier.
Figure 10
Figure 10
A flow-diagram of the SERS-based method for detecting COVID-positive patients utilizing volatile organic molecules in their breath (BVOCs). Reproduced with permission from ref. [131]. Copyright 2022 American Chemical Society.
Figure 11
Figure 11
Schematic representation of the SERS-based LFA. (a) When the A(H1N1) was present in the sample solution, the SERS-virus complexes were formed and captured by the test line anti-bodies; excess SERS nanoprobes continued to flow and were captured by antibodies in the control line. In this scenario, the buildup of AuNPs causes both the control and test lines to turn red (left, positive). If the fluid contains no viruses, just the control line goes reddish (negative, right). (b) The associated SERS-virus nanoprobe complexes produced a SERS spectrum (top), but no signal was produced in the absence of the virus (bottom). Reproduced with permission from ref. [95]. Copyright 2016 John Wiley & Sons, Inc.
Figure 12
Figure 12
Illustration of an avian virus detection magnetic immunoassay based on surface-enhanced Raman scattering (SERS). Reproduced with permission from ref. [150]. Copyright 2017 Elsevier.

Similar articles

Cited by

References

    1. Singh R. CV raman and the discovery of the raman effect. Phys. Perspect. 2002;4:399–420. doi: 10.1007/s000160200002. - DOI
    1. Long D.A. Early history of the raman effect. Int. Rev. Phys. Chem. 1988;7:317–349. doi: 10.1080/01442358809353216. - DOI
    1. Adar F., Delhaye M., DaSilva E. Evolution of instrumentation for detection of the raman effect as driven by available technologies and by developing applications. J. Chem. Educ. 2007;84:50. doi: 10.1021/ed084p50. - DOI
    1. Sweedler J.V. Charge transfer device detectors and their applications to chemical analysis. Crit. Rev. Anal. Chem. 1993;24:59–98. doi: 10.1080/10408349308048819. - DOI
    1. Eberhardt K., Stiebing C., Matthäus C., Schmitt M., Popp J. Advantages and limitations of raman spectroscopy for molecular diagnostics: An update. Expert Rev. Mol. Diagn. 2015;15:773–787. doi: 10.1586/14737159.2015.1036744. - DOI - PubMed