. 2022 Aug 3;12(8):593.
doi: 10.3390/bios12080593.

Determination of rSpike Protein by Specific Antibodies with Screen-Printed Carbon Electrode Modified by Electrodeposited Gold Nanostructures

Affiliations

Determination of rSpike Protein by Specific Antibodies with Screen-Printed Carbon Electrode Modified by Electrodeposited Gold Nanostructures

Maryia Drobysh et al. Biosensors (Basel). .

Abstract

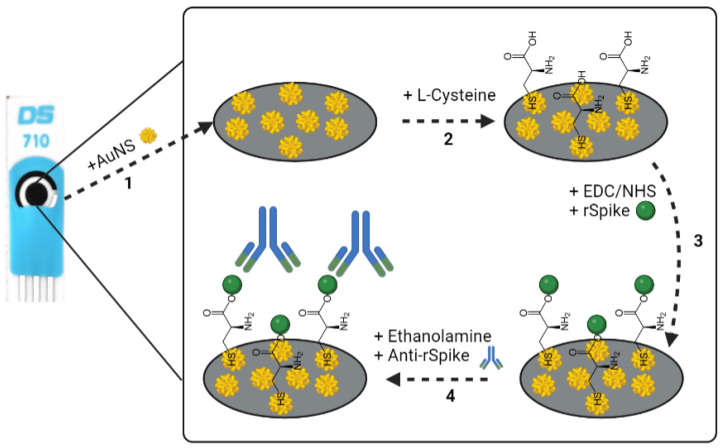
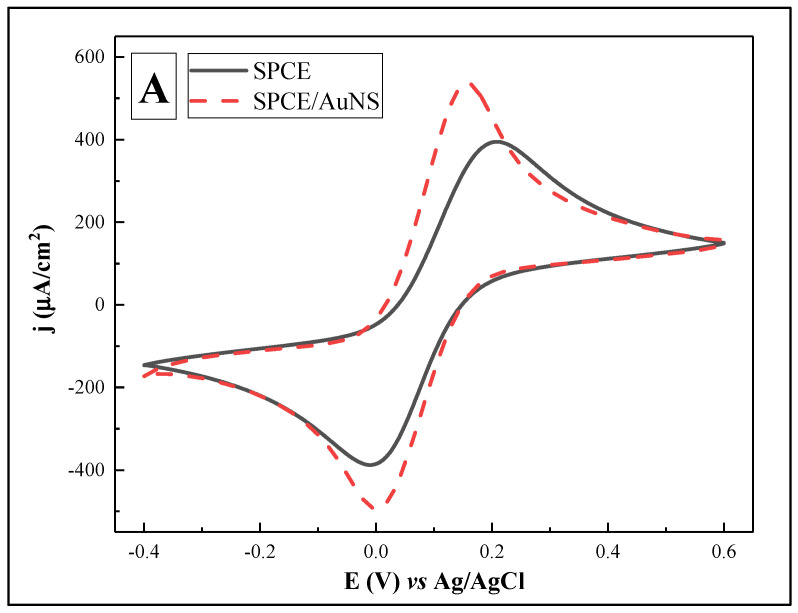
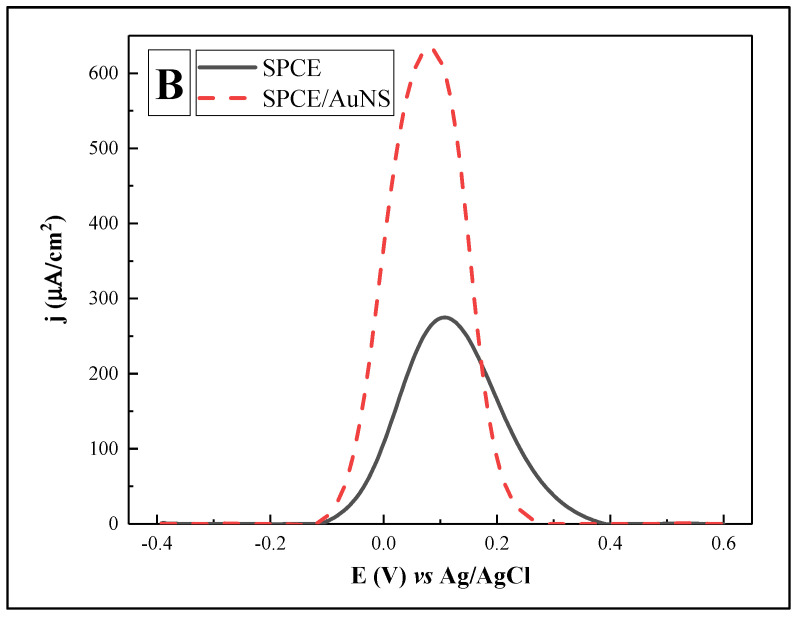
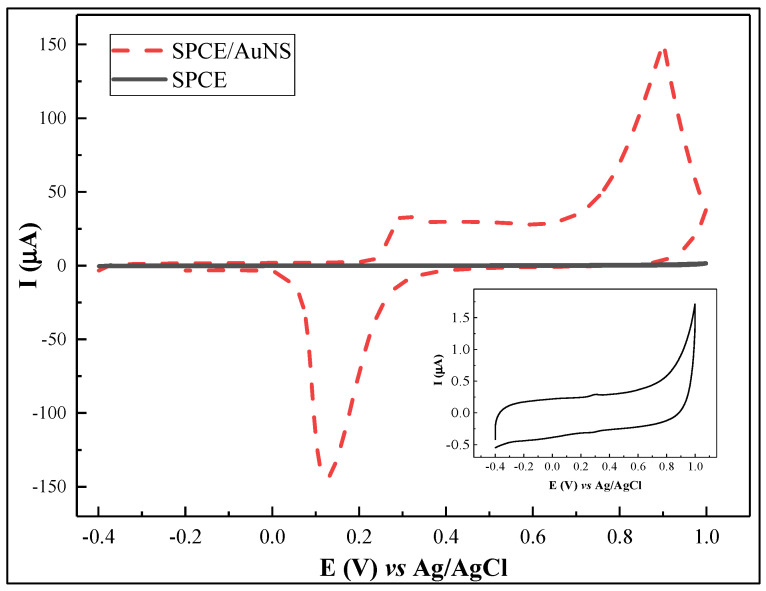
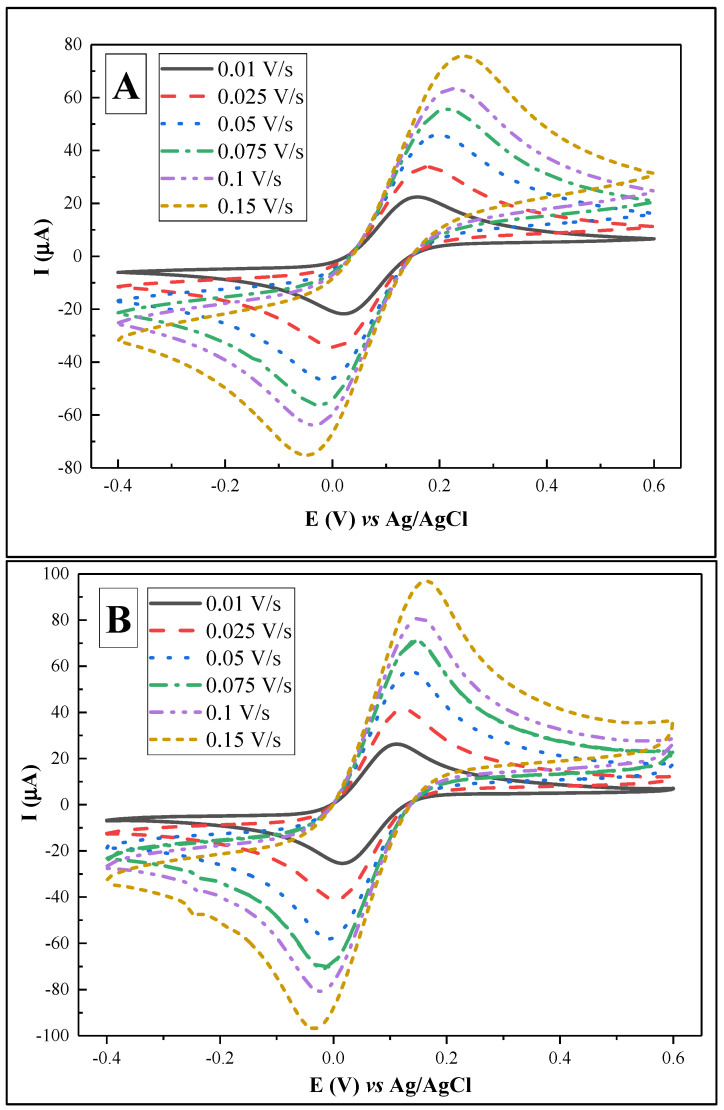
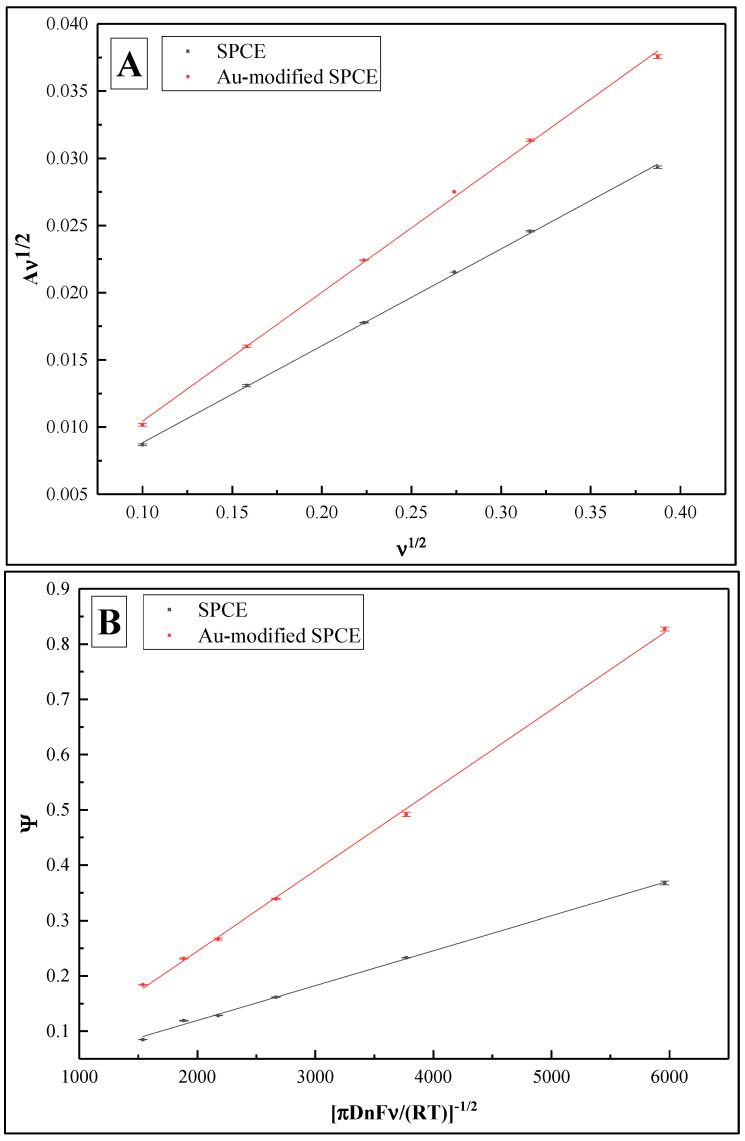
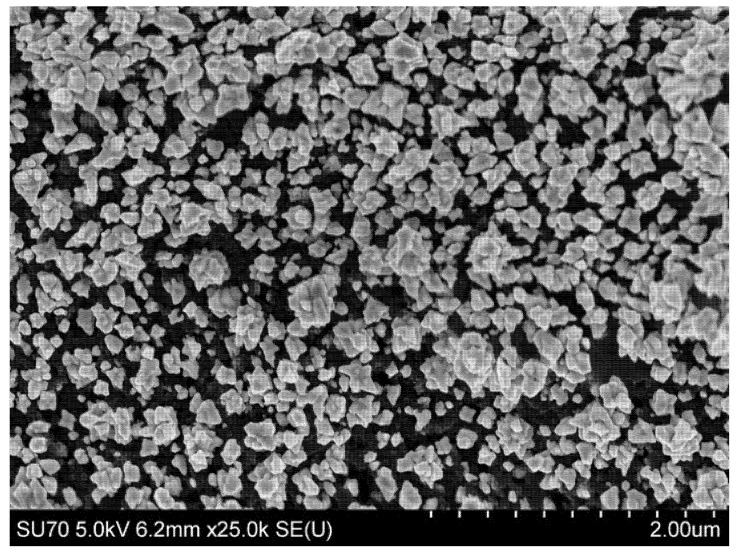
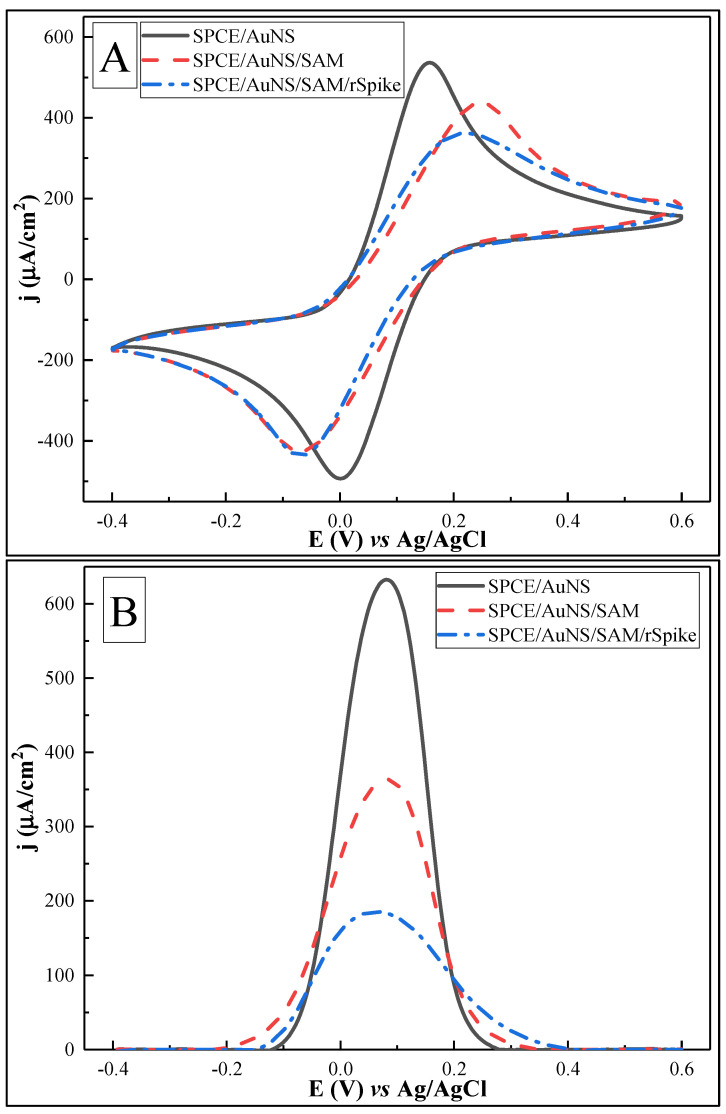
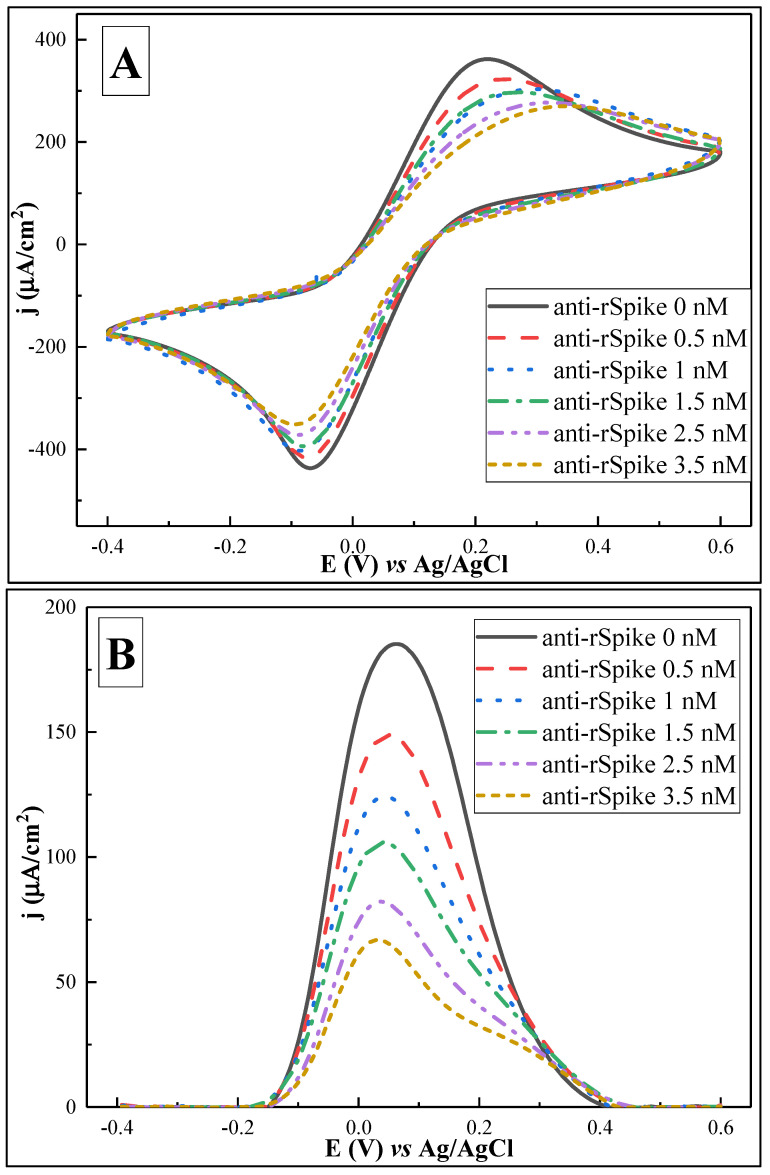
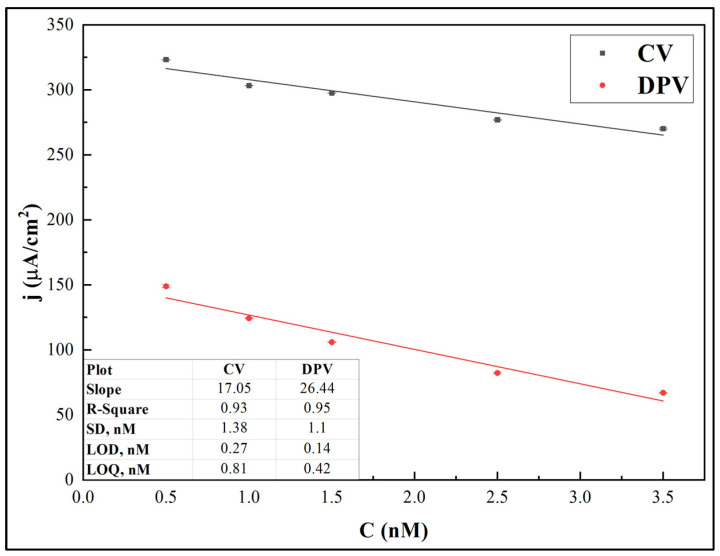
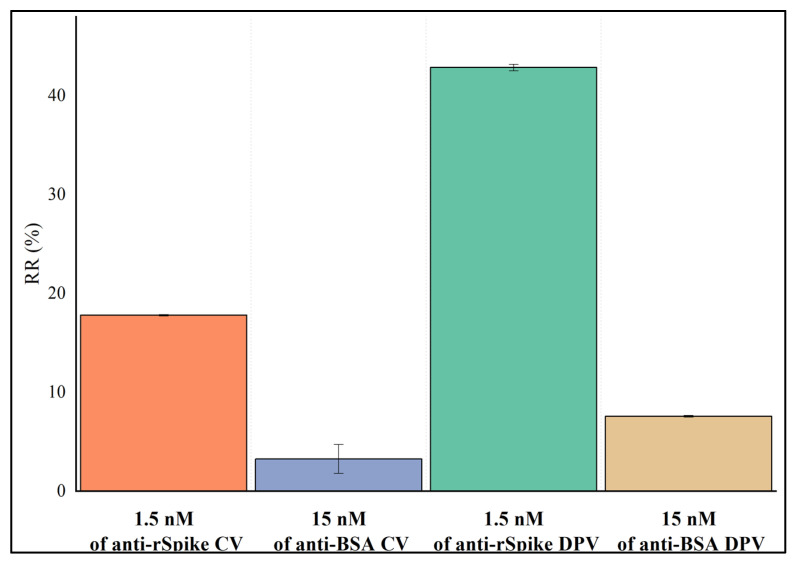
In this research, we assessed the applicability of electrochemical sensing techniques for detecting specific antibodies against severe acute respiratory syndrome coronavirus 2 (SARS-CoV-2) spike proteins in the blood serum of patient samples following coronavirus disease 2019 (COVID-19). Herein, screen-printed carbon electrodes (SPCE) with electrodeposited gold nanostructures (AuNS) were modified with L-Cysteine for further covalent immobilization of recombinant SARS-CoV-2 spike proteins (rSpike). The affinity interactions of the rSpike protein with specific antibodies against this protein (anti-rSpike) were assessed using cyclic voltammetry (CV) and differential pulse voltammetry (DPV) methods. It was revealed that the SPCE electroactive surface area increased from 1.49 ± 0.02 cm2 to 1.82 ± 0.01 cm2 when AuNS were electrodeposited, and the value of the heterogeneous electron transfer rate constant (k0) changed from 6.30 × 10⁻⁵ to 14.56 × 10⁻⁵. The performance of the developed electrochemical immunosensor was evaluated by calculating the limit of detection and limit of quantification, giving values of 0.27 nM and 0.81 nM for CV and 0.14 nM and 0.42 nM for DPV. Furthermore, a specificity test was performed with a solution of antibodies against bovine serum albumin as the control aliquot, which was used to assess nonspecific binding, and this evaluation revealed that the developed rSpike-based sensor exhibits low nonspecific binding towards anti-rSpike antibodies.

Keywords: COVID-19; SARS-CoV-2 virus; antigen–antibody complex; cyclic voltammetry (CV); differential pulse voltammetry (DPV); electrochemical immunosensor; electrochemical impedance spectroscopy (EIS); gold nanostructures (AuNS); self-assembled monolayer (SAM); spike protein (Spike).


Conflict of interest statement

The authors declare no conflict of interest.

Figures

Figure 1
Figure 1
Schematic representation of experimental stages occurring on the SPCE. (1): The formation of SPCE/AuNS by electrodeposition; (2): SPCE/AuNS/SAM formation; (3): the activation of the SPCE/AuNS/SAM by EDC-NHS mixture following SPCE/AuNS/SAM/rSpike formation; (4): ethanolamine blocking of remaining active functional groups and SPCE/AuNS/SAM/rSpike/anti-rSpike immunocomplex formation via the interaction between immobilized rSpike protein and the anti-rSpike antibodies present in the aliquot.
Figure 2
Figure 2
Cyclic voltammograms (A) and differential pulse voltammograms (B) for SPCE (—) and SPCE/AuNS (- - -). Potential range was from −0.4 to +0.6 V, with a CV scan rate of 0.05 V/s, DPV step size of 0.004 V, pulse height of 0.05 V, pulse period of 100 ms, and pulse width of 50 ms, in 10 mM PBS, pH 7.4, containing 2 mM [Fe(CN6)]3−/4−. Signal normalized to the geometrical area of the working electrode (0.126 cm2).
Figure 2
Figure 2
Cyclic voltammograms (A) and differential pulse voltammograms (B) for SPCE (—) and SPCE/AuNS (- - -). Potential range was from −0.4 to +0.6 V, with a CV scan rate of 0.05 V/s, DPV step size of 0.004 V, pulse height of 0.05 V, pulse period of 100 ms, and pulse width of 50 ms, in 10 mM PBS, pH 7.4, containing 2 mM [Fe(CN6)]3−/4−. Signal normalized to the geometrical area of the working electrode (0.126 cm2).
Figure 3
Figure 3
Cyclic voltammogram of SPCE/AuNS in 10 mM H2SO4. Inset: cyclic voltammogram of SPCE. Potential scan range was from −0.4 to +1.0 V vs. Ag/AgCl, at a scan rate of 0.1 V/s.
Figure 4
Figure 4
Cyclic voltammograms for SPCE (A) and SPCE/AuNS (B) at scan rates of 0.01, 0.025, 0.05, 0.075, 0.1, and 0.15 V/s in PBS, pH 7.4, containing 2 mM [Fe(CN6)]3−/4−.
Figure 5
Figure 5
(A) Plot of Aν1/2 vs. ν1/2 showing calculated electrochemically active surface areas of SPCE and SPCE/AuNS as slopes. (B) Plot of Ψ vs. [πDnFν/(RT)]−1/2 showing calculated k0 values of SPCE and SPCE/AuNS as slopes.
Figure 6
Figure 6
SEM micrograph of SPCE/AuNS.
Figure 7
Figure 7
Cyclic voltammograms (A) and differential pulse voltammograms (B) of SPCE/AuNS (—), after SPCE/AuNS/SAM formation (- - -), and for SPCE/AuNS/SAM/rSpike protein immobilization (-·-). Potential range was from −0.4 to +0.6 V, with a CV scan rate of 0.05 V/s, DPV step size of 0.004 V, pulse height of 0.05 V, pulse period of 100 ms, and pulse width of 50 ms, in 10 mM PBS, pH 7.4, containing 2 mM [Fe(CN6)]3−/4−. Signal normalized to the geometrical area of the working electrode (0.126 cm2).
Figure 8
Figure 8
Cyclic voltammograms (A) and differential pulse voltammograms (B) after interaction with anti-rSpike antibodies of different concentrations (0–3.5 nM). Potential range was from −0.4 to +0.6 V, with a CV scan rate of 0.05 V/s, DPV step size of 0.004 V, pulse height of 0.05 V, pulse period of 100 ms, and pulse width of 50 ms, in 10 mM PBS, pH 7.4, containing 2 mM [Fe(CN6)]3−/4−. Signal normalised to the geometrical area of the working electrode (0.126 cm2). Data are represented as means of three independent experiments.
Figure 9
Figure 9
Calibration curves for jpa and jp obtained from CV and DPV peak values, respectively, vs. anti-rSpike antibody concentration. Error bars are calculated as a percentage of standard error.
Figure 10
Figure 10
Comparison of the relative responses after 10 min of incubation with 1.5 nM anti-rSpike and 15 nM anti-BSA, for DPV and CV methods. Error bars are calculated as a percentage standard error.

Similar articles

Cited by

References

    1. Hu B., Guo H., Zhou P., Shi Z.-L. Characteristics of SARS-CoV-2 and COVID-19. Nat. Rev. Microbiol. 2021;19:141–154. doi: 10.1038/s41579-020-00459-7. - DOI - PMC - PubMed
    1. Yadav A., Verma D., Kumar A., Kumar P., Solanki P. The perspectives of biomarker-based electrochemical immunosensors, artificial intelligence and the Internet of Medical Things toward COVID-19 diagnosis and management. Mater. Today Chem. 2021;20:100443. doi: 10.1016/j.mtchem.2021.100443. - DOI - PMC - PubMed
    1. Ramanavicius S., Ramanavicius A. Progress and Insights in the Application of MXenes as New 2D Nano-Materials Suitable for Biosensors and Biofuel Cell Design. Int. J. Mol. Sci. 2020;21:9224. doi: 10.3390/ijms21239224. - DOI - PMC - PubMed
    1. Ramanavicius S., Ramanavicius A. Conducting Polymers in the Design of Biosensors and Biofuel Cells. Polymers. 2021;13:49. doi: 10.3390/polym13010049. - DOI - PMC - PubMed
    1. Ramanavicius S., Jagminas A., Ramanavicius A. Advances in Molecularly Imprinted Polymers Based Affinity Sensors (Review) Polymers. 2021;13:974. doi: 10.3390/polym13060974. - DOI - PMC - PubMed