

Electrochemical Aptasensor for the Detection of the Key Virulence Factor YadA of Yersinia enterocolitica
- PMID: 36005012
- PMCID: PMC9405658
- DOI: 10.3390/bios12080614
Electrochemical Aptasensor for the Detection of the Key Virulence Factor YadA of Yersinia enterocolitica
Abstract
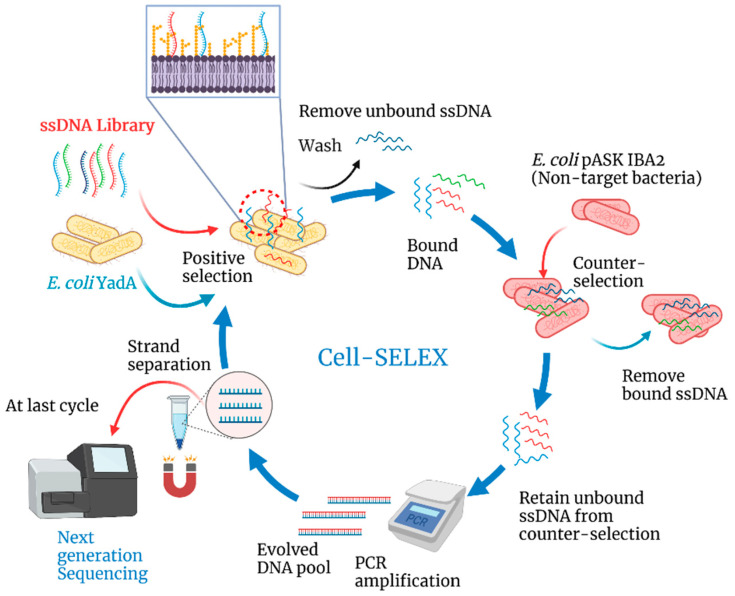
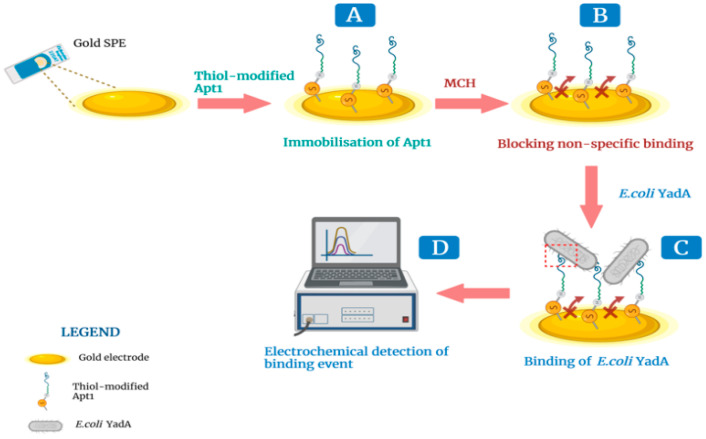
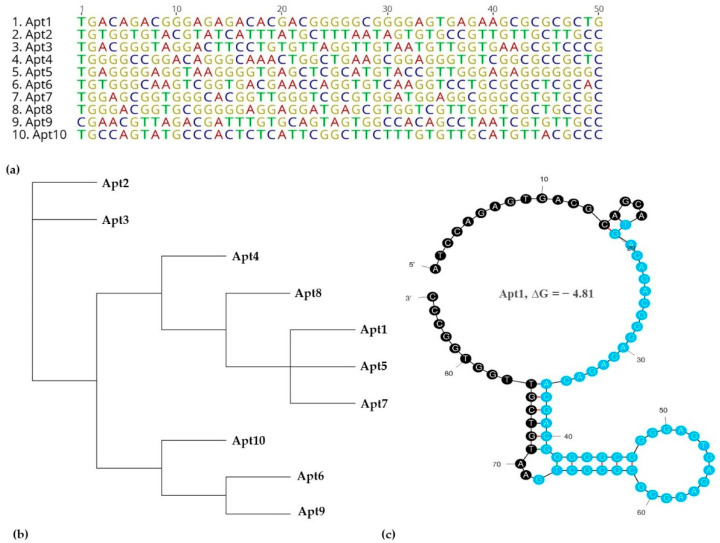
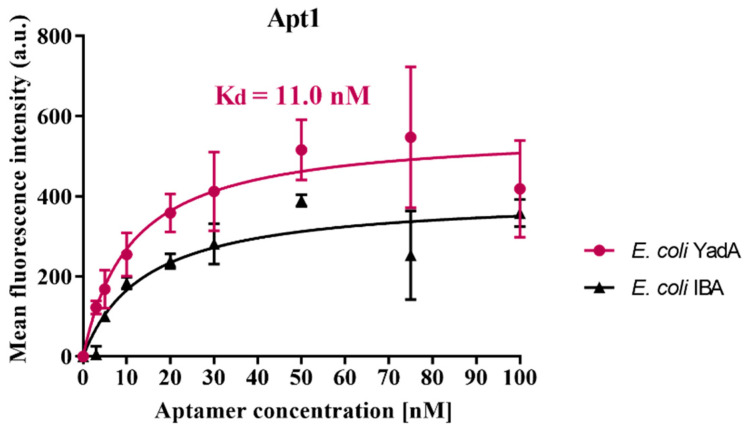
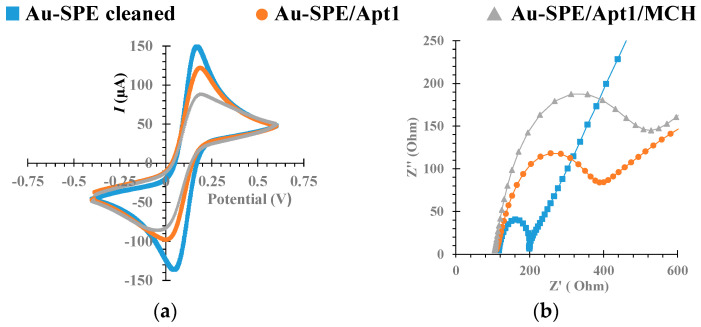
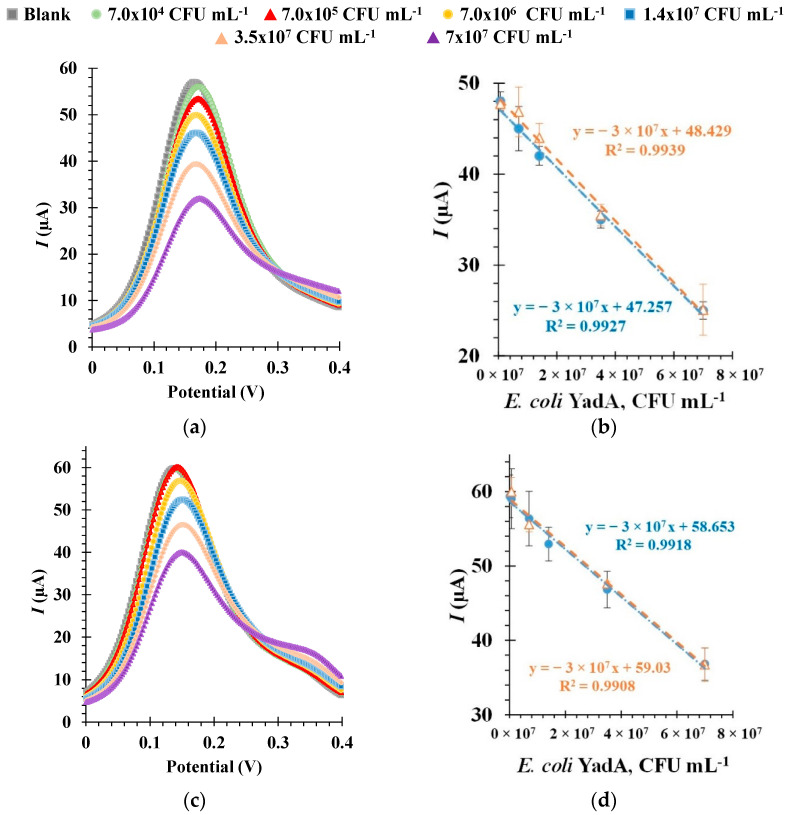
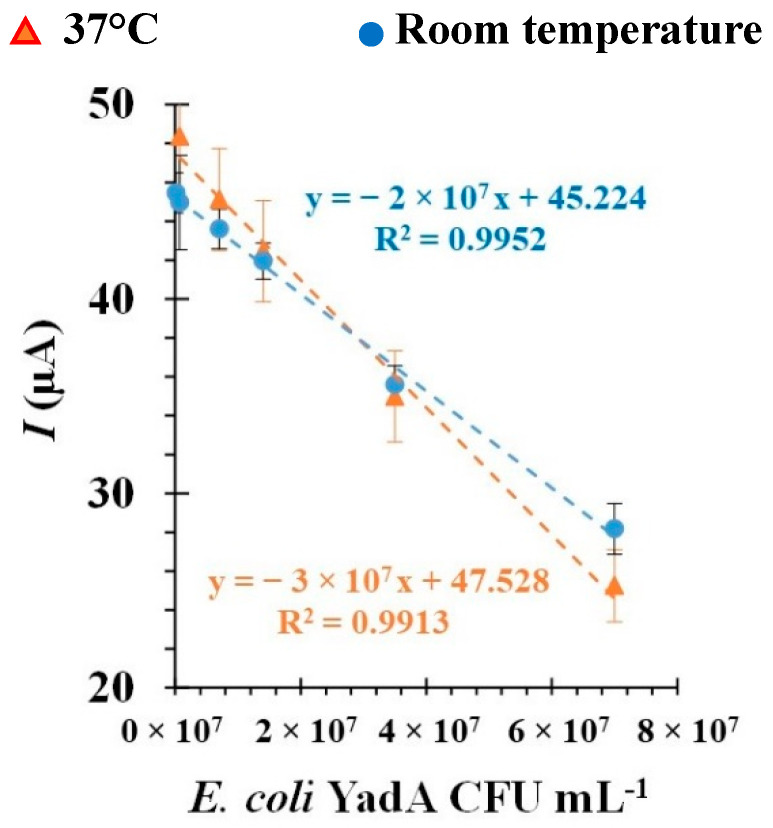
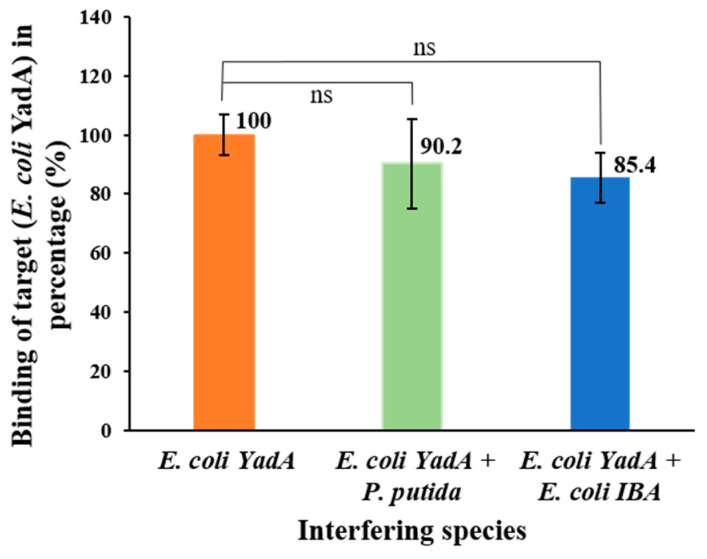
New point-of-care (POC) diagnosis of bacterial infections are imperative to overcome the deficiencies of conventional methods, such as culture and molecular methods. In this study, we identified new aptamers that bind to the virulence factor Yersinia adhesin A (YadA) of Yersinia enterocolitica using cell-systematic evolution of ligands by exponential enrichment (cell-SELEX). Escherichia coli expressing YadA on the cell surface was used as a target cell. After eight cycles of selection, the final aptamer pool was sequenced by high throughput sequencing using the Illumina Novaseq platform. The sequencing data, analyzed using the Geneious software, was aligned, filtered and demultiplexed to obtain the key nucleotides possibly involved in the target binding. The most promising aptamer candidate, Apt1, bound specifically to YadA with a dissociation constant (Kd) of 11 nM. Apt1 was used to develop a simple electrochemical biosensor with a two-step, label-free design towards the detection of YadA. The sensor surface modifications and its ability to bind successfully and stably to YadA were confirmed by cyclic voltammetry, impedance spectroscopy and square wave voltammetry. The biosensor enabled the detection of YadA in a linear range between 7.0 × 10⁴ and 7.0 × 10⁷ CFU mL−1 and showed a square correlation coefficient >0.99. The standard deviation and the limit of detection was ~2.5% and 7.0 × 10⁴ CFU mL−1, respectively. Overall, the results suggest that this novel biosensor incorporating Apt1 can potentially be used as a sensitive POC detection system to aid the diagnosis of Y. enterocolitica infections. Furthermore, this simple yet innovative approach could be replicated to select aptamers for other (bacterial) targets and to develop the corresponding biosensors for their detection.
Keywords: Y. enterocolitica; YadA; adhesin; aptamer; biosensor; cell-SELEX; cyclic voltammetry; impedance spectroscopy; square wave voltammetry.
Conflict of interest statement
The authors declare no conflict of interest.
Figures
Similar articles
-
Aptasensor for the Detection of Moraxella catarrhalis Adhesin UspA2.Bioengineering (Basel). 2023 Jan 31;10(2):178. doi: 10.3390/bioengineering10020178. Bioengineering (Basel). 2023. PMID: 36829672 Free PMC article.
-
Contribution of trimeric autotransporter C-terminal domains of oligomeric coiled-coil adhesin (Oca) family members YadA, UspA1, EibA, and Hia to translocation of the YadA passenger domain and virulence of Yersinia enterocolitica.J Bacteriol. 2008 Jul;190(14):5031-43. doi: 10.1128/JB.00161-08. Epub 2008 May 16. J Bacteriol. 2008. PMID: 18487327 Free PMC article.
-
Yersinia adhesin A (YadA)--beauty & beast.Int J Med Microbiol. 2015 Feb;305(2):252-8. doi: 10.1016/j.ijmm.2014.12.008. Epub 2014 Dec 24. Int J Med Microbiol. 2015. PMID: 25604505 Review.
-
Oligomeric coiled-coil adhesin YadA is a double-edged sword.PLoS One. 2010 Dec 8;5(12):e15159. doi: 10.1371/journal.pone.0015159. PLoS One. 2010. PMID: 21170337 Free PMC article.
-
Interactions between Yersinia enterocolitica and the host with special reference to virulence plasmid encoded adhesion and humoral immunity.Dan Med Bull. 1992 Apr;39(2):155-72. Dan Med Bull. 1992. PMID: 1611921 Review.
Cited by
-
Computational Frontiers in Aptamer-Based Nanomedicine for Precision Therapeutics: A Comprehensive Review.ACS Omega. 2024 Jun 10;9(25):26838-26862. doi: 10.1021/acsomega.4c02466. eCollection 2024 Jun 25. ACS Omega. 2024. PMID: 38947800 Free PMC article. Review.
-
Trends in Development of Aptamer-Based Biosensor Technology for Detection of Bacteria.Adv Biochem Eng Biotechnol. 2024;187:339-380. doi: 10.1007/10_2024_251. Adv Biochem Eng Biotechnol. 2024. PMID: 38409265 Review.
-
Advances in aptamer-based biosensors for monitoring foodborne pathogens.J Food Sci Technol. 2024 Jul;61(7):1252-1271. doi: 10.1007/s13197-023-05889-8. Epub 2023 Nov 13. J Food Sci Technol. 2024. PMID: 38910921 Free PMC article. Review.
-
Aptasensor for the Detection of Moraxella catarrhalis Adhesin UspA2.Bioengineering (Basel). 2023 Jan 31;10(2):178. doi: 10.3390/bioengineering10020178. Bioengineering (Basel). 2023. PMID: 36829672 Free PMC article.
-
Aptamer-Based Point-of-Care Devices: Emerging Technologies and Integration of Computational Methods.Biosensors (Basel). 2023 May 22;13(5):569. doi: 10.3390/bios13050569. Biosensors (Basel). 2023. PMID: 37232930 Free PMC article. Review.
References
MeSH terms
Substances
Grants and funding
LinkOut - more resources
Full Text Sources
Research Materials
Miscellaneous
