

Biomechanical Sensing Using Gas Bubbles Oscillations in Liquids and Adjacent Technologies: Theory and Practical Applications
- PMID: 36005019
- PMCID: PMC9406219
- DOI: 10.3390/bios12080624
Biomechanical Sensing Using Gas Bubbles Oscillations in Liquids and Adjacent Technologies: Theory and Practical Applications
Abstract
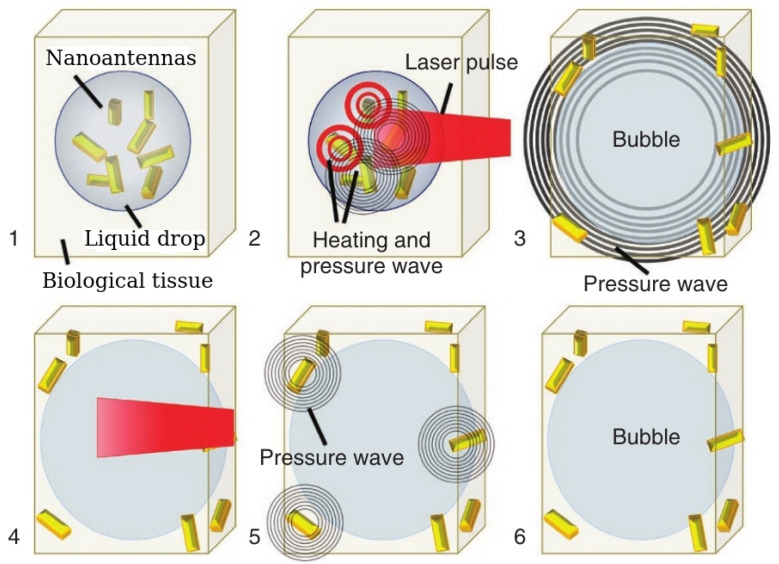
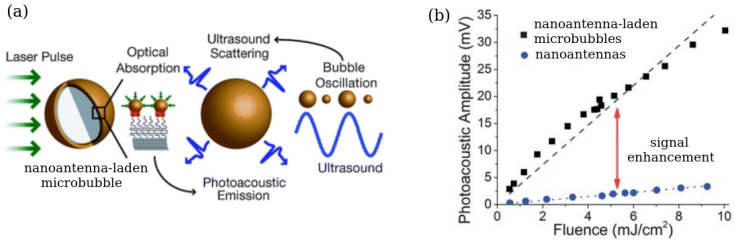
Gas bubbles present in liquids underpin many natural phenomena and human-developed technologies that improve the quality of life. Since all living organisms are predominantly made of water, they may also contain bubbles-introduced both naturally and artificially-that can serve as biomechanical sensors operating in hard-to-reach places inside a living body and emitting signals that can be detected by common equipment used in ultrasound and photoacoustic imaging procedures. This kind of biosensor is the focus of the present article, where we critically review the emergent sensing technologies based on acoustically driven oscillations of bubbles in liquids and bodily fluids. This review is intended for a broad biosensing community and transdisciplinary researchers translating novel ideas from theory to experiment and then to practice. To this end, all discussions in this review are written in a language that is accessible to non-experts in specific fields of acoustics, fluid dynamics and acousto-optics.
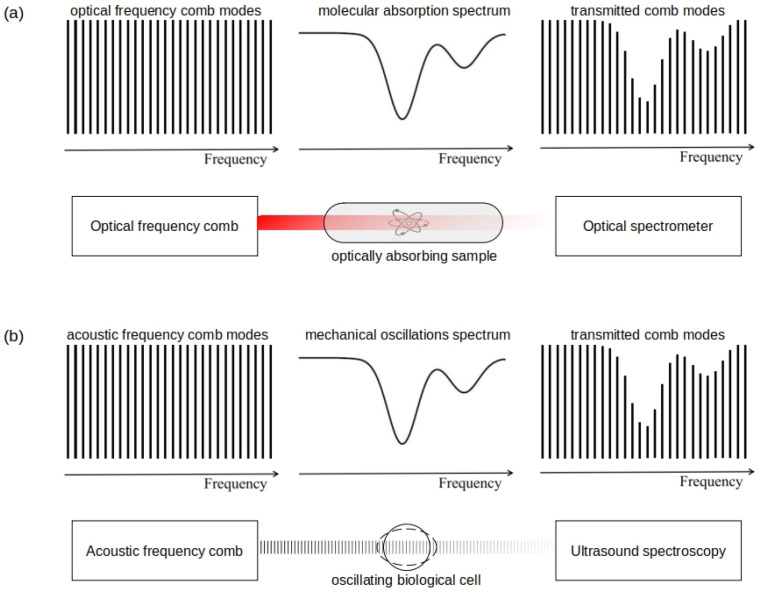
Keywords: acoustic frequency combs; acousto-optics; artificial intelligence; biomechanics; biosensing; bubbles; cellular viscoelasticity; nonlinear acoustics; physics-informed neural networks; vibrations.
Conflict of interest statement
The authors declare no conflict of interest.
Figures
Similar articles
-
Acoustic, Phononic, Brillouin Light Scattering and Faraday Wave-Based Frequency Combs: Physical Foundations and Applications.Sensors (Basel). 2022 May 22;22(10):3921. doi: 10.3390/s22103921. Sensors (Basel). 2022. PMID: 35632330 Free PMC article. Review.
-
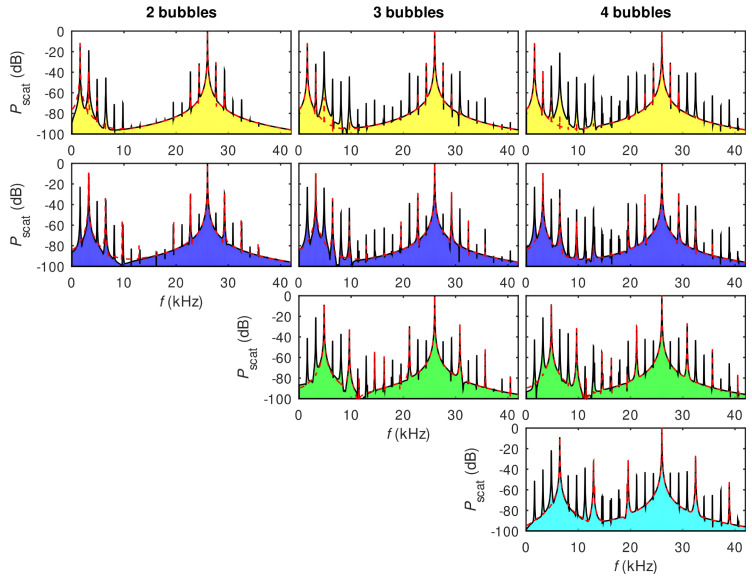
Spectrally wide acoustic frequency combs generated using oscillations of polydisperse gas bubble clusters in liquids.Phys Rev E. 2021 Sep;104(3-2):035104. doi: 10.1103/PhysRevE.104.035104. Phys Rev E. 2021. PMID: 34654181
-
Dynamics of gas bubbles in viscoelastic fluids. II. Nonlinear viscoelasticity.J Acoust Soc Am. 2000 Oct;108(4):1640-50. doi: 10.1121/1.1289361. J Acoust Soc Am. 2000. PMID: 11051492
-
New technique for emboli detection and discrimination based on nonlinear characteristics of gas bubbles.Ultrasound Med Biol. 2001 Jun;27(6):801-8. doi: 10.1016/s0301-5629(01)00384-2. Ultrasound Med Biol. 2001. PMID: 11516540
-
Manipulation of biological objects using acoustic bubbles: a review.Integr Comp Biol. 2014 Dec;54(6):959-68. doi: 10.1093/icb/icu091. Epub 2014 Jun 23. Integr Comp Biol. 2014. PMID: 24961435 Review.
Cited by
-
Coupling the thermal acoustic modes of a bubble to an optomechanical sensor.Microsyst Nanoeng. 2024 Dec 26;10(1):204. doi: 10.1038/s41378-024-00804-3. Microsyst Nanoeng. 2024. PMID: 39722080 Free PMC article.
References
-
- Brennen C.E. Cavitation and Bubble Dynamics. Oxford University Press; New York, NY, USA: 1995.
-
- Lauterborn W., Kurz T. Physics of bubble oscillations. Rep. Prog. Phys. 2010;73:106501. doi: 10.1088/0034-4885/73/10/106501. - DOI
-
- Minnaert M. On musical air-bubbles and the sound of running water. Phil. Mag. 1933;16:235–248. doi: 10.1080/14786443309462277. - DOI
-
- Leighton T.G., Walton A.J. An experimental study of the sound emitted from gas bubbles in a liquid. Eur. J. Phys. 1987;8:98–104. doi: 10.1088/0143-0807/8/2/005. - DOI
Publication types
MeSH terms
Grants and funding
LinkOut - more resources
Full Text Sources
