Review
. 2022 Aug 14;12(8):639.
doi: 10.3390/bios12080639.

Liquid Crystal Biosensors: Principles, Structure and Applications

Affiliations
Review

Liquid Crystal Biosensors: Principles, Structure and Applications

Haonan Wang et al. Biosensors (Basel). .

Abstract

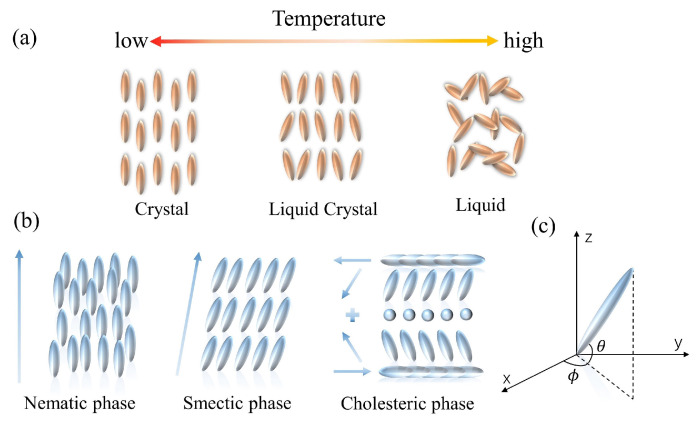
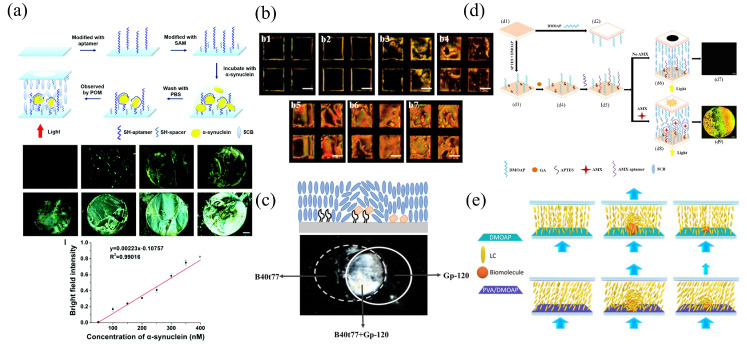
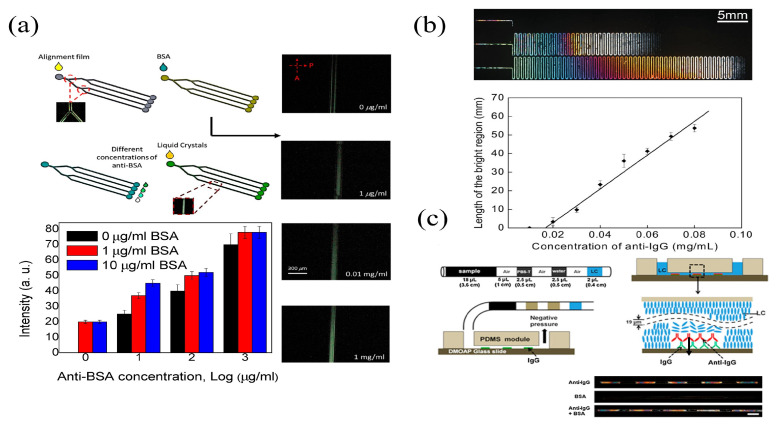
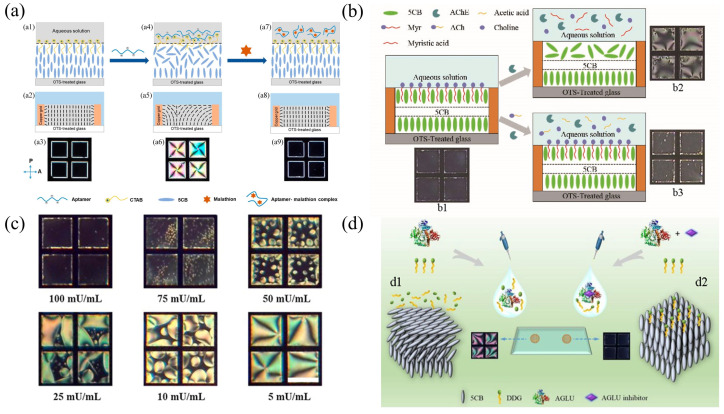
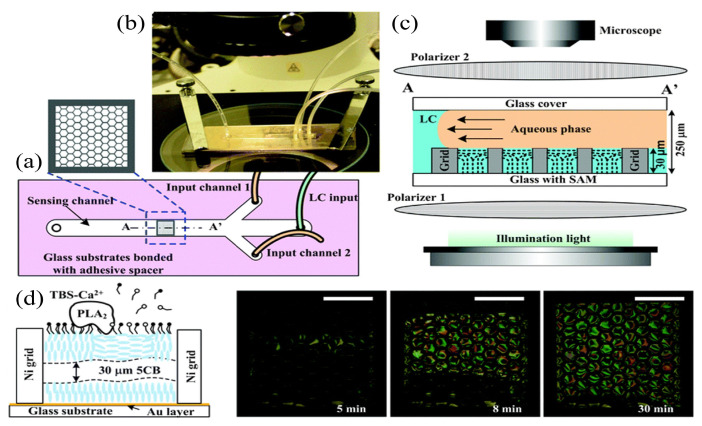
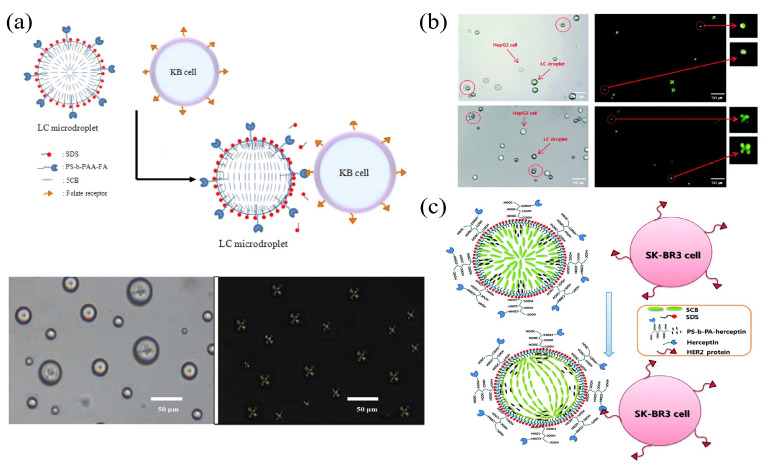
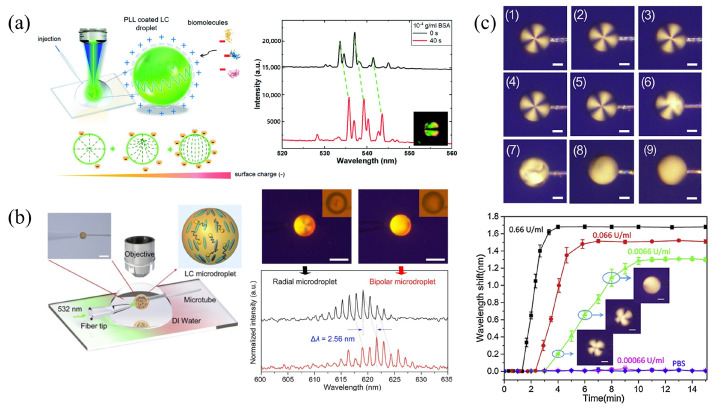
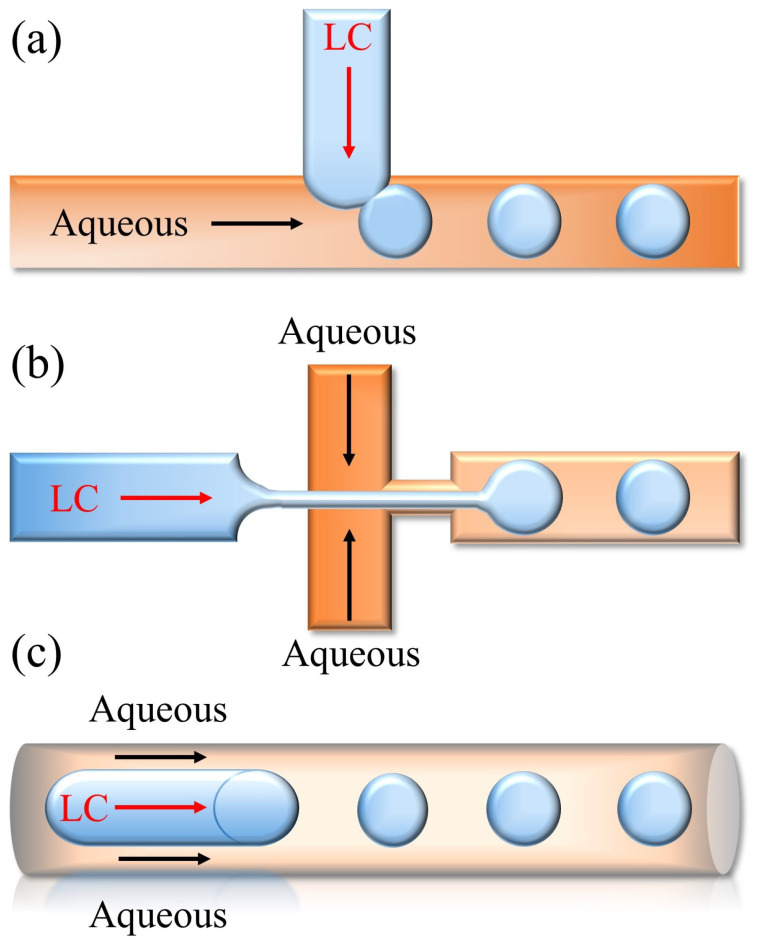
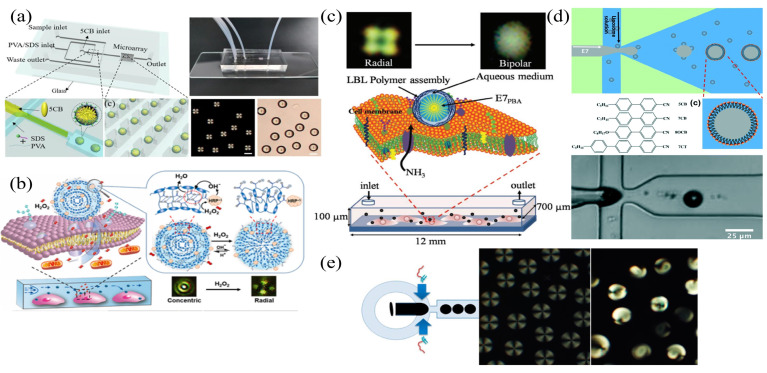
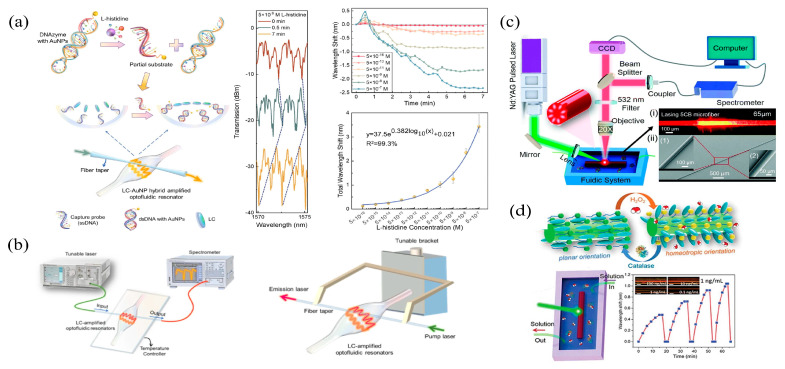
Liquid crystals (LCs) have been widely used as sensitive elements to construct LC biosensors based on the principle that specific bonding events between biomolecules can affect the orientation of LC molecules. On the basis of the sensing interface of LC molecules, LC biosensors can be classified into three types: LC-solid interface sensing platforms, LC-aqueous interface sensing platforms, and LC-droplet interface sensing platforms. In addition, as a signal amplification method, the combination of LCs and whispering gallery mode (WGM) optical microcavities can provide higher detection sensitivity due to the extremely high quality factor and the small mode volume of the WGM optical microcavity, which enhances the interaction between the light field and biotargets. In this review, we present an overview of the basic principles, the structure, and the applications of LC biosensors. We discuss the important properties of LC and the principle of LC biosensors. The different geometries of LCs in the biosensing systems as well as their applications in the biological detection are then described. The fabrication and the application of the LC-based WGM microcavity optofluidic sensor in the biological detection are also introduced. Finally, challenges and potential research opportunities in the development of LC-based biosensors are discussed.

Keywords: LC-based biosensors; liquid crystals; microfluidics; optofluidic; whispering gallery mode.


Conflict of interest statement

The authors declare no conflict of interest.

Figures

Figure 1
Figure 1
Schematic of the properties of LC molecules. (a) The arrangement of thermotropic LC molecules. (b) The variation of thermotropic LC molecules with temperature. (c) Illustration of LC directors in the Cartesian coordinate.
Figure 2
Figure 2
(a) Illustrations of the LC biosensor for the detection of α-syn and optical images of LC cells at different concentrations of α-syn [72]; reproduced with permission from Royal Society of Chemistry. (b) POM images of LC aptasensor cells with tetracycline at various concentrations of: (b1) 0.1 pM; (b2) 0.5 pM; (b3) 5 pM; (b4) 10 pM; (b5) 100 pM; (b6) 250 pM; (b7) 500 pM [74]; reproduced with permission from Elsevier. (c) POM images of the LC aptamer sensor [75]; copyright with permission from Abbasi et al. (d) Schematic illustration of the LC sensing strategy for detecting AMX (d1) Cleaned the bottom glass slide; (d2) upper glass slide; (d3) build self-assembled monolayer; (d4) grafting of GA onto APTES/DMOAP-modified glass substrate; (d5) immobilization of the AMX aptamer; (d6) absence of AMX results in LCs orienting homeotropically; (d7) POM image of the LC cell in the absence of AMX; (d8) binding of AMX to AMX aptamers disrupts the orientation of LCs; (d9) POM image of the LC cell in the presence of AMX [77]; copyright with permission from Nguyen et al. (e) Illustration of the DMOAP-coated and the PVA/DMOAP-coated substrates used to achieve the tilted state of the LCs [78]; copyright with permission from Chang et al.
Figure 3
Figure 3
(a) Schematic of multi-microfluidic LC immunoassays with optical images of POM at different concentrations of BSA and intensities of LC microfluidic chips with BSA at concentrations of 0, 1, and 10 μg mL1 [91]; reproduced with permission from Fan et al. (b) POM images of the IgG modified LC–solid interface microfluidic platform, and the linear characterization between the length of bright region and the IgG antibody concentration [92]; reproduced with permission from Wiley. (c) Diagram of the microfluidic LC sensor for automated immunoassays [93]; reproduced with permission from Elsevier.
Figure 4
Figure 4
(a) Schematic of LC sensor device for malathion detection [97]; copyright with permission from Nguyen et al. (b) Diagram of the LC sensor configuration for the detection of acetylcholine (b1) Dark appearance associated with homeotropic orientation caused by Myr layer formation; (b2) enzymatic hydrolysis of Myr layer by AChE causes a bright appearance associated with a plane orientation; (b3) the competitive enzymatic hydrolysis of Myr and ACh by AChE is associated with homeotropic orientation and dark appearance [98]; reproduced with permission from Elsevier. (c) Optical images of LC sensor in the presence of various hydrogen peroxide concentrations [99]; reproduced with permission from Elsevier. (d) Schematic representation of LC-based AGLU analysis to detect antidiabetic drugs [100]; reproduced with permission from Elsevier.
Figure 5
Figure 5
Setup of LC microfluidic biosensing system. (a) Top view diagram of the system, with hexagonal squares supporting the grid structure. (b) Physical picture of the system. (c) System was situated between two crossed polarizers with the shear force of the water to form the LC–aqueous interface. (d) The SAM was hydrolyzed in the presence of Ca2+, and the 5CB film in the central grid of the sensing channel was observed with transition (from dark to bright) in the optical image [102]; reproduced with permission from Royal Society of Chemistry.
Figure 6
Figure 6
(a) Illustration of the configuration transition and POM images of LC droplets containing PS-b-PAA-FA with KB cancer cells [108]; reproduced with permission from American Chemical Society. (b) Optical and polarization images of HepG2 cells in contact with β-galactose-(PS-b-PA-G) anchored LC droplets [109]; reproduced with permission from Royal Society of Chemistry. (c) Illustration of herceptin–HER2-interaction-induced configuration transition in LC droplets [110]; reproduced with permission from Royal Society of Chemistry.
Figure 7
Figure 7
(a) Illustration of the experimental setup and the shift of the laser wavelength due to different concentrations of BSA [113]; reproduced with permission from Royal Society of Chemistry. (b) Schematic representation of the lasing experimental setup and wavelength shift of LC droplets with configuration transition from bipolar to radial [114]; reproduced with permission from Elsevier. (c) POM images of LC droplets in different concentrations of Myr and spectral responses at different concentrations of AChE [115]; reproduced with permission from Elsevier.
Figure 8
Figure 8
LC droplets generation strategies: (a) T-junction structure; (b) flow-focusing structure; (c) co-flowing structure.
Figure 9
Figure 9
(a) Schematic of the LC droplet device for the determination of bile acids [121]; reproduced with permission from Elsevier. (b) Principle of configuration transformation of LCEM-HRP immobilized on the cell membrane based on H2O2 reduction reaction [123]; reproduced with permission from Wiley. (c) Diagram of PE7PBA immobilized on cultured cells in a microfluidic channel and POM images of the transition from radial to bipolar [124]; reproduced with permission from Wiley. (d) Production of lipid-coated LC droplets for the detection of SMP43 according to the principle of the configuration transition in LC droplets caused by the disruption of the lipid membrane layer [125]; reproduced with permission from Royal Society of Chemistry. (e) LC glucose sensors were prepared by covalently bonding GOx to PAA-b-LCP functionalized LC droplets with PAA chains, and the pH change induced by GOx-catalyzed glucose oxidation underwent a radial to bipolar configuration transition through a change in the PAA chains [126]; reproduced with permission from American Chemical Society.
Figure 10
Figure 10
(a) Diagram of the DNAzyme optofluidic biosensor for L-histidine detection and the spectral response of the LC–AuNPs biosensor at different concentrations of L-histidine [134]; reproduced with permission from Elsevier. (b) Schematic of the optofluidic LC biosensor for protein assay detection [135]; reproduced with permission from Springer. (c) Illustration of the experimental setup for monitoring the concentration of lipase using the LC microfiber biosensor [136]; reproduced with permission from Royal Society of Chemistry. (d) Principle of the orientation transition of LCs, and the time response curve for the shift of WGM wavelength under various catalase concentrations [137]; reproduced with permission from Taylor & Francis.

Similar articles

Cited by

References

    1. Kalita P., Shukla S.S., Singh R.K., Bhattacharjee A. Potential liquid crystal-based biosensor depending on the interaction between liquid crystals and proteins. Spectrochim. Acta Part A Mol. Biomol. Spectrosc. 2021;254:119634. doi: 10.1016/j.saa.2021.119634. - DOI - PubMed
    1. Oh-e M., Zheng D.Y. Newly discovered dimensional effects of electrodes on liquid crystal THz phase shifters enable novel switching between in-plane and out-of-plane. Sci. Rep. 2022;12:5482. doi: 10.1038/s41598-022-07832-x. - DOI - PMC - PubMed
    1. Prévôt M.E., Nemati A., Cull T.R., Hegmann E., Hegmann T. A zero-power optical, ppt-to ppm-level toxic gas and vapor sensor with image, text, and analytical capabilities. Adv. Mater. Technol. 2020;5:2000058. doi: 10.1002/admt.202000058. - DOI
    1. Tefelska M.M., Woliński T.R., Ertman S., Mileńko K., ączkowski R., Siarkowska A., Domański A.W. Electric field sensing with photonic liquid crystal fibers based on micro-electrodes systems. J. Light. Technol. 2015;33:2405–2411. doi: 10.1109/JLT.2014.2379691. - DOI
    1. Zheng Z.G., Yuan C.L., Hu W., Bisoyi H.K., Tang M.J., Liu Z., Sun P.Z., Yang W.Q., Wang X.Q., Shen D., et al. Light-patterned crystallographic direction of a self-organized 3d soft photonic crystal. Adv. Mater. 2017;29:1703165. doi: 10.1002/adma.201703165. - DOI - PubMed

MeSH terms

LinkOut - more resources