Review
. 2022 Aug 17;12(8):646.
doi: 10.3390/bios12080646.

Reactive Species-Activatable AIEgens for Biomedical Applications

Affiliations
Review

Reactive Species-Activatable AIEgens for Biomedical Applications

Xiaoying Kang et al. Biosensors (Basel). .

Abstract

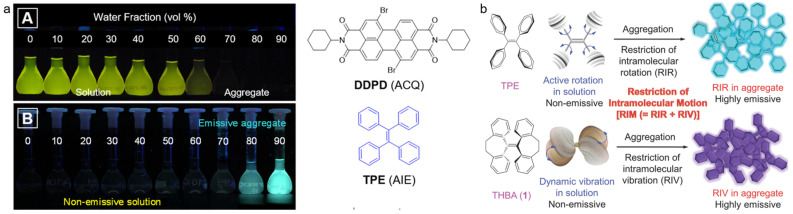
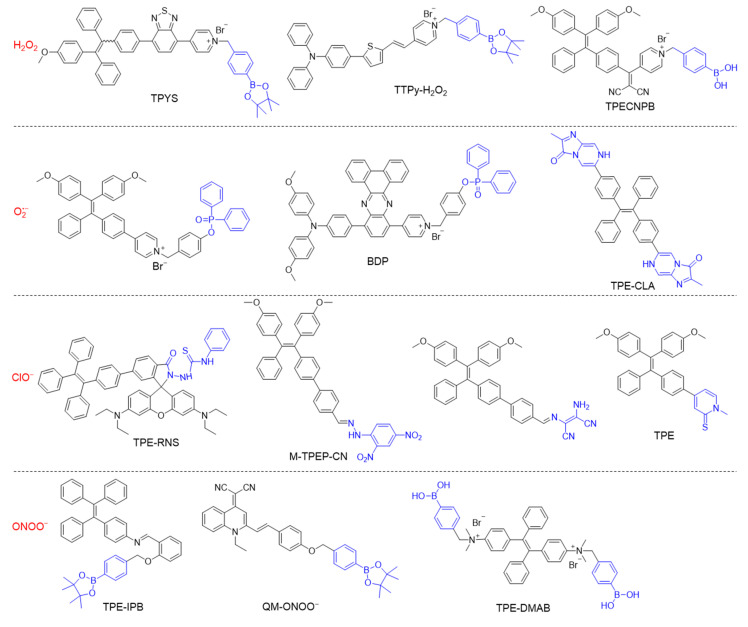
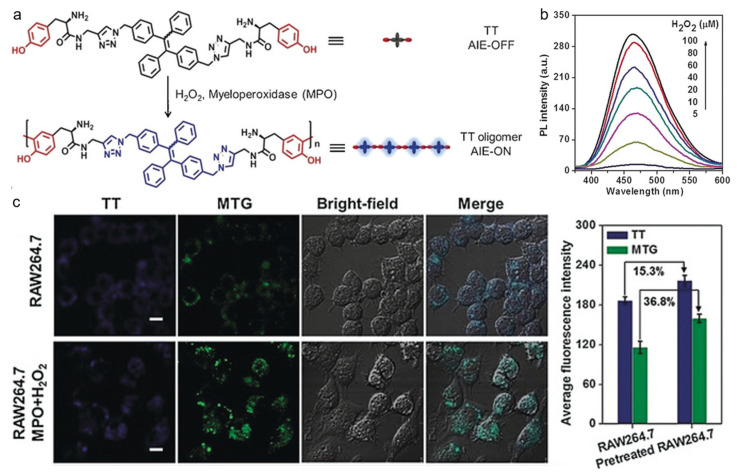
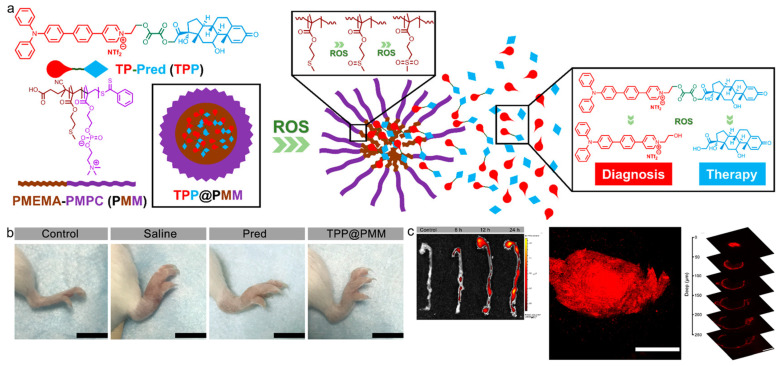
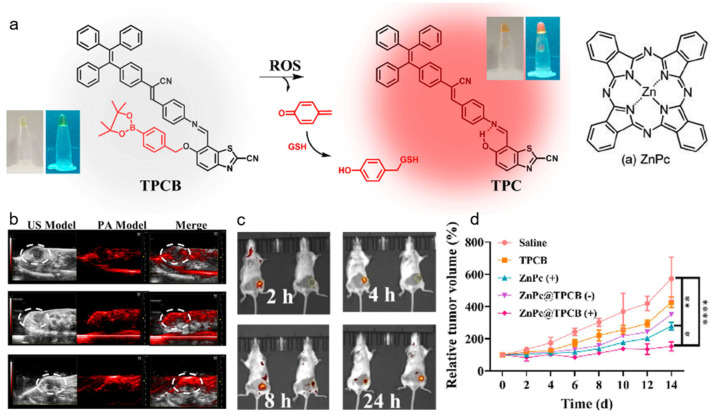
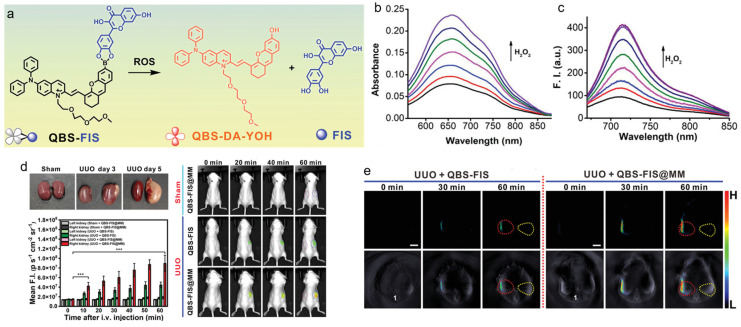
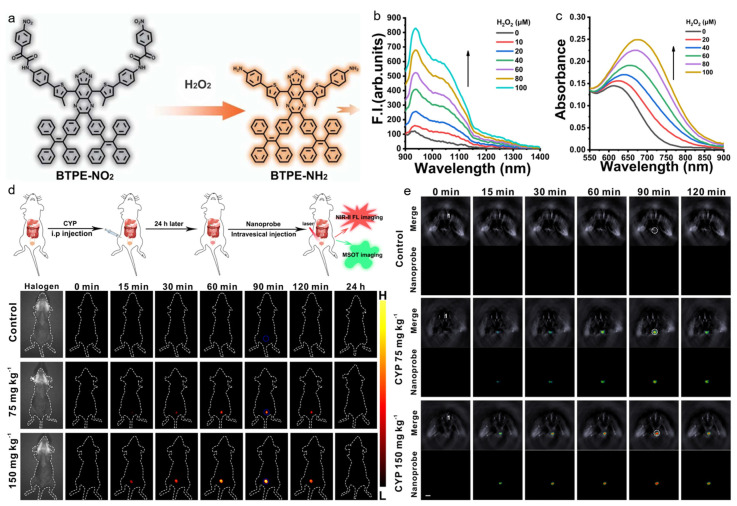
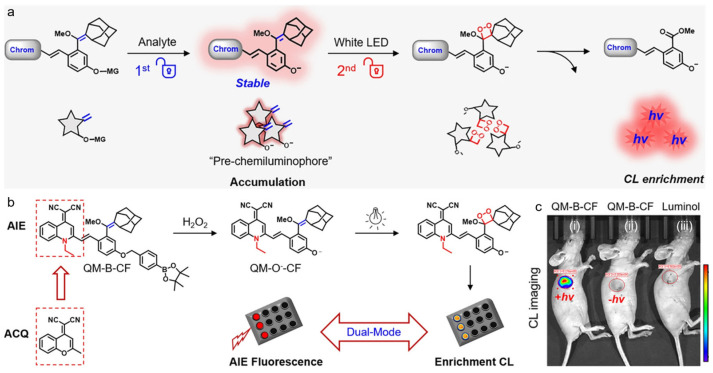
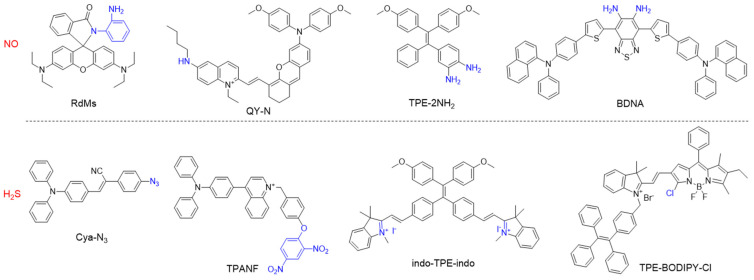
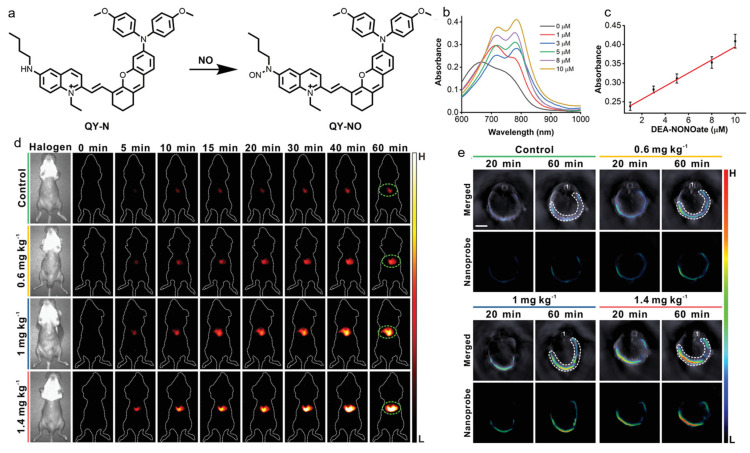
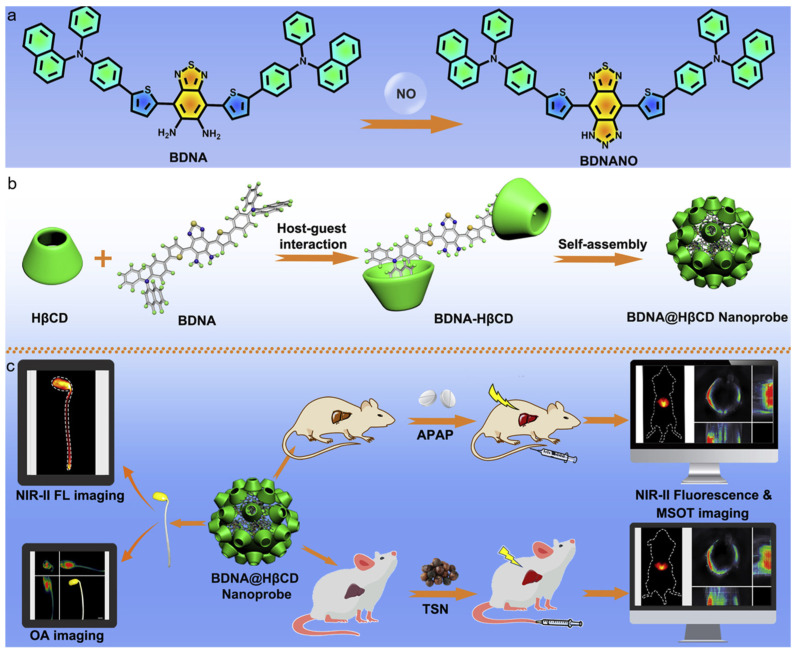
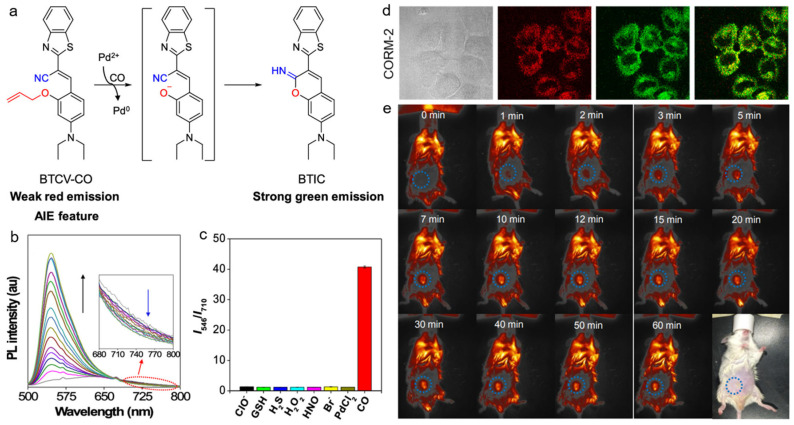
Precision medicine requires highly sensitive and specific diagnostic strategies with high spatiotemporal resolution. Accurate detection and monitoring of endogenously generated biomarkers at the very early disease stage is of extensive importance for precise diagnosis and treatment. Aggregation-induced emission luminogens (AIEgens) have emerged as a new type of excellent optical agents, which show great promise for numerous biomedical applications. In this review, we highlight the recent advances of AIE-based probes for detecting reactive species (including reactive oxygen species (ROS), reactive nitrogen species (RNS), reactive sulfur species (RSS), and reactive carbonyl species (RCS)) and related biomedical applications. The molecular design strategies for increasing the sensitivity, tuning the response wavelength, and realizing afterglow imaging are summarized, and theranostic applications in reactive species-related major diseases such as cancer, inflammation, and vascular diseases are reviewed. The challenges and outlooks for the reactive species-activatable AIE systems for disease diagnostics and therapeutics are also discussed. This review aims to offer guidance for designing AIE-based specifically activatable optical agents for biomedical applications, as well as providing a comprehensive understanding about the structure-property application relationships. We hope it will inspire more interesting researches about reactive species-activatable probes and advance clinical translations.

Keywords: activatable probe; afterglow; aggregation-induced emission; bioimaging; fluorescence; photoacoustic; reactive oxygen nitrogen species; theranostics.


Conflict of interest statement

The authors declare no conflict of interest.

Figures

Figure 1
Figure 1
(a) Photographs of ACQ and AIE molecules in the mixture of water/THF with different water fractions under 365 nm of UV light irradiation (reproduced with the permission from Ref. [40]. Copyright 2018, American Chemical Society); (b) schematic illustration of RIM mechanism, including restriction of intramolecular rotation and restriction of intramolecular vibration. (Reproduced with the permission from Ref. [39]. Copyright 2014, WILEY-VCH Verlag GmbH & Co. KGaA, Weinheim).
Figure 2
Figure 2
Chemical structures of different types of RONS-responsive molecules.
Figure 3
Figure 3
(a) Peroxidase-catalyzed polymerization in the presence of H2O2; (b) PL spectra of TT with the treatment of different concentrations of H2O2; (c) CLSM images and corresponding fluorescence intensity of RAW264.7 cells pretreated without and with MPO and H2O2 incubating with TT. Scale bars: 20 µm. (Reproduced with the permission from Ref. [113]. Copyright 2018, Wiley-VCH Verlag GmbH & Co. KgaA, Weinheim).
Figure 4
Figure 4
(a) Schematic of the theranostic nanoplatform with serial ROS response; (b) photographs of the hind limbs from arthritic mice with different treatments; (c) two-photon fluorescence imaging of aortas, atherosclerotic plaques, and plaques. Scale bars: 200 μm. (Reproduced with the permission from Ref. [114]. Copyright 2020, American Chemical Society).
Figure 5
Figure 5
(a) Chemical structure and the ROS-activatable process of TPCB probe; (b) in vivo ultrasound and PA and (c) fluorescence imaging of 4T1 tumor-bearing mice after injecting the nanoprobe; (d) tumor growth curves of 4T1 tumor-bearing mice with different treatments. * p < 0.05, ** p < 0.01, **** p < 0.001. (Reproduced with the permission from Ref. [120]. Copyright 2021, American Chemical Society).
Figure 6
Figure 6
(a) Chemical structure and ROS response of the theranostic probe; (b) absorption and (c) PL spectra of QBS-FIS with the treatment of different concentrations of H2O2; (d) fluorescence and (e) PA imaging of the sham-surgery and unilateral ureteral obstruction (UUO) mice with different treatments. *** p ≤ 0.001. (Reproduced with the permission from Ref. [121]. Copyright 2021, Wiley-VCH GmbH).
Figure 7
Figure 7
(a) The AIE probe for H2O2 detection; (b) PL and (c) absorption spectra of BTPE-NO2 with the treatment of different concentrations of H2O2; (d) NIR-II fluorescence and (e) PA imaging of interstitial cystitis mice with different treatments at designed time points after administration. (Reproduced with the permission from Ref. [127]. Copyright 2021, The Authors).
Figure 8
Figure 8
(a) Schematic of the dual-lock probe triggered sequentially by analyte and light for CL imaging; (b) the reaction processes of AIE-based dual-lock probe QM-B-CF; (c) in vivo imaging of 4T1 xenograft tumor-bearing mice after intratumor injection of QM-B-CF or luminol. (Reproduced with the permission from Ref. [134]. Copyright 2020, Wiley-VCH Verlag GmbH & Co. KGaA, Weinheim).
Figure 9
Figure 9
(a) Schematic illustration of TPETP-AA-RhocRGD for self-reporting 1O2 detection; (b) photoluminescence of TPETP in DMSO/water mixture with different water fractions; (c) photoluminescence spectra of the probe under light irradiation at different time points; (d,e) CLSM images of MDA-MB-231 cells incubated with the probe under light irradiation at different time points as indicated. (Reproduced with the permission from Ref. [138]. Copyright 2016, The Royal Society of Chemistry).
Figure 10
Figure 10
(a) Chemical structure of BDP and the O2•−-activatable process; (b) CLSM imaging of HepG2 cells with different treatments (reproduced with the permission from Ref. [141]. Copyright 2018, The Royal Society of Chemistry); (c) chemical structure and the O2•−-response mechanism; (d) in vivo CL images and corresponding imaging intensity of LPS-induced inflammation in mice. *** p < 0.001. (Reproduced with the permission from Ref. [142]. Copyright 2017, American Chemical Society).
Figure 11
Figure 11
(a) TPE-IPB probe for ONOO detection with turn-on fluorescence; (b) PL spectra of TPE-IPB with the treatment of different concentrations of ONOO; (c) in vivo fluorescence images and the corresponding fluorescence intensity of the mice infected with MRSA at left and E. coli at right before and after vancomycin and penicillin treatment. ** p < 0.01, in comparison between MRSA-infected foci before and after vancomycin treatment for 14 d; ## p < 0.01, in comparison between E. coli-infected foci before and after penicillin treatment for 14 d. (Reproduced with the permission from Ref. [146]. Copyright 2016, Wiley-VCH Verlag GmbH & Co. KGaA, Weinheim).
Figure 12
Figure 12
(a) Chemical structures and working mechanism of the ONOO and pH dual-response afterglow luminescence; (b) selectivity of the nanoprobe with various ROS treatments; afterglow intensity of the nanoprobe (c) in different spectral regions and (d) different pH environments; (e) fluorescence and afterglow images of the acute inflammation after injecting the preirradiated nanoprobe at different time points; (f) fluorescence and afterglow images of the mouse with allergic left ear and inflammatory right ear; (g) fluorescence and afterglow images of the 4T1 tumor-bearing mice at different time points after receiving PDT with hypericin or cisplatin treatment and (h) corresponding afterglow intensity. * p < 0.05, ** p < 0.01. (Reproduced with the permission from Ref. [147]. Copyright 2022, American Chemical Society).
Figure 13
Figure 13
Chemical structures of different types of gasotransmitter-responsive molecular probes.
Figure 14
Figure 14
(a) The response of QY-N towards NO; (b) absorption spectra and (c) intensity at 780 nm of QY-N with the treatment of different concentrations of DEA·NONOate; (d) NIR-II fluorescence and (e) PA imaging of liver injury mice intravenously injected with the nanoprobe QY-N at different time points. (Reproduced with the permission from Ref. [164]. Copyright 2021, Wiley-VCH GmbH).
Figure 15
Figure 15
(a) The mechanism of BDNA for NO detection; (b) the formation of host–guest supramolecular complex BNDA–HβCD and the nanoprobe; (c) the BNDA@HβCD nanoprobe for in vivo NIR-II fluorescence and PA imaging of liver injury and detecting NO in soybean sprouts. (Reproduced with the permission from Ref. [165]. Copyright 2021, The Authors).
Figure 16
Figure 16
(a) The mechanism of AIE-based probe for CO detection; (b) PL spectra of BTCV-CO probe incubated with different concentrations of CORM-2; (c) PL intensity ratios (I546/I710) of BTCV-CO with the treatment of various biomolecules; (d) CL images of MCF-7 cells incubated with the probe; (e) in vivo fluorescence imaging of CO with the probe. (Reproduced with the permission from Ref. [169]. Copyright 2019, American Chemical Society).
Figure 17
Figure 17
(a) The proposed reaction process of TPP-PDCV for detecting H2S; (b) the AIE probe for H2S detection with turn-on fluorescence; (c) PL spectra and (d) the corresponding PL intensity ratio of the AIE probe treated with different concentrations of H2S; Fluorescence imaging of (e) HeLa cells and (f) zebrafish larvae treated with different concentrations of H2S. (Reproduced with the permission from Ref. [171]. Copyright 2016, The Royal Society of Chemistry and the Chinese Chemical Society).

Similar articles

Cited by

References

    1. Park S.M., Aalipour A., Vermesh O., Yu J.H., Gambhir S.S. Towards clinically translatable in vivo nanodiagnostics. Nat. Rev. Mater. 2017;2:17014. doi: 10.1038/natrevmats.2017.14. - DOI - PMC - PubMed
    1. Letai A. Functional precision cancer medicine–moving beyond pure genomics. Nat. Med. 2016;23:1028–1035. doi: 10.1038/nm.4389. - DOI - PubMed
    1. Ashley E.A. Towards precision medicine. Nat. Rev. Genet. 2016;17:507–522. doi: 10.1038/nrg.2016.86. - DOI - PubMed
    1. Weissleder R. Scaling down imaging: Molecular mapping of cancer in mice. Nat. Rev. Cancer. 2012;2:11–18. doi: 10.1038/nrc701. - DOI - PubMed
    1. Willmann J.K., Bruggen N.V., Dinkelborg L.M., Gambhir S.S. Molecular imaging in drug development. Nat. Rev. Drug Discov. 2008;7:591–607. doi: 10.1038/nrd2290. - DOI - PubMed