

Mechanical Sensors for Cardiovascular Monitoring: From Battery-Powered to Self-Powered
- PMID: 36005046
- PMCID: PMC9405976
- DOI: 10.3390/bios12080651
Mechanical Sensors for Cardiovascular Monitoring: From Battery-Powered to Self-Powered
Abstract
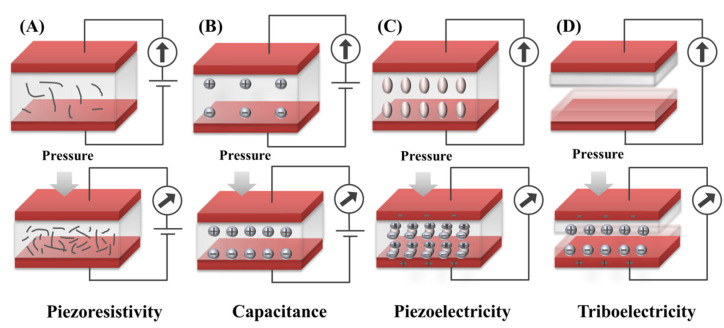
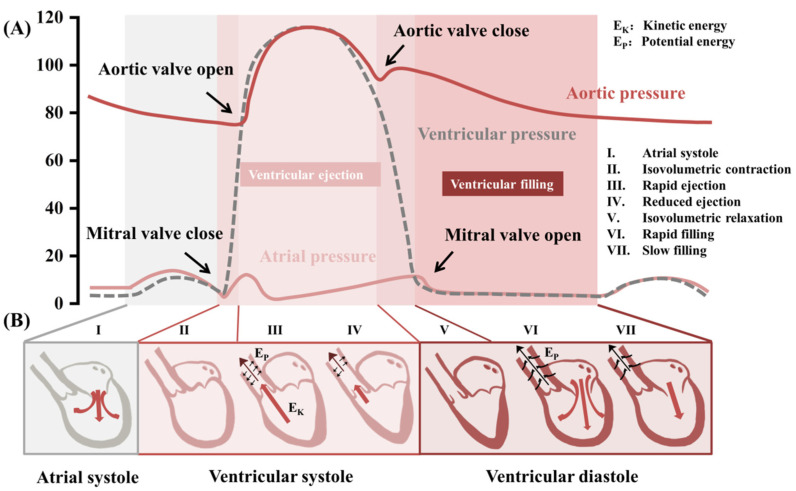
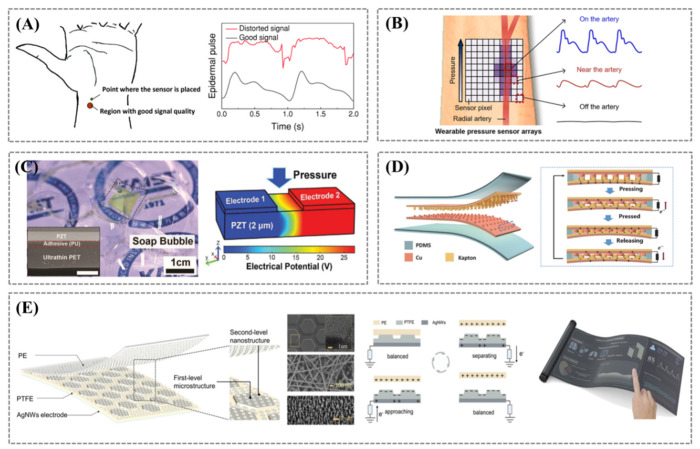
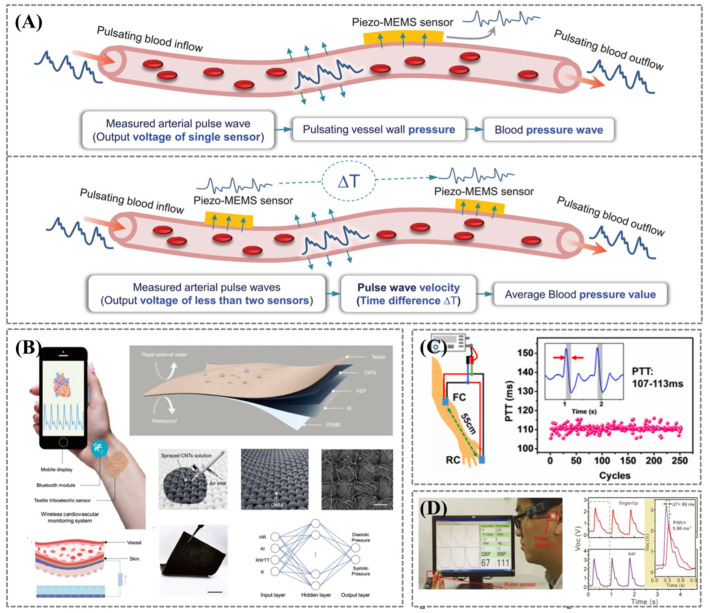
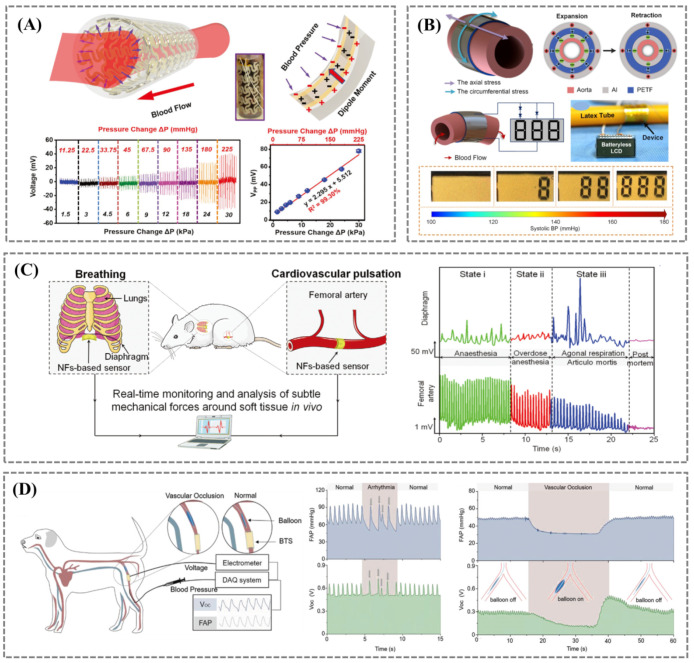
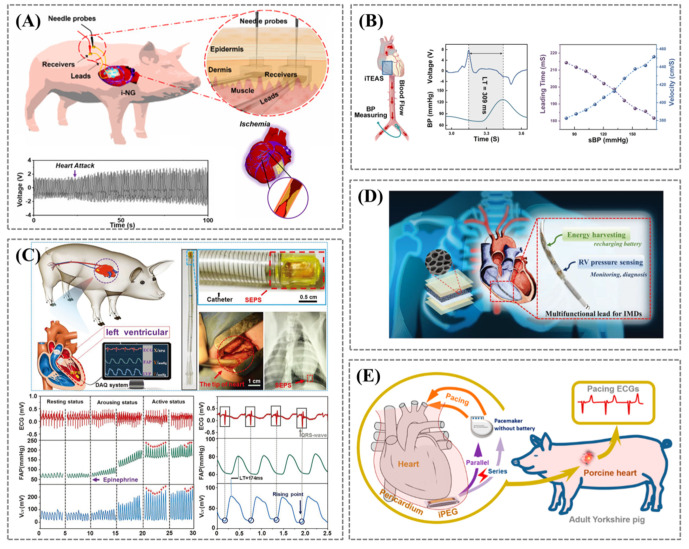
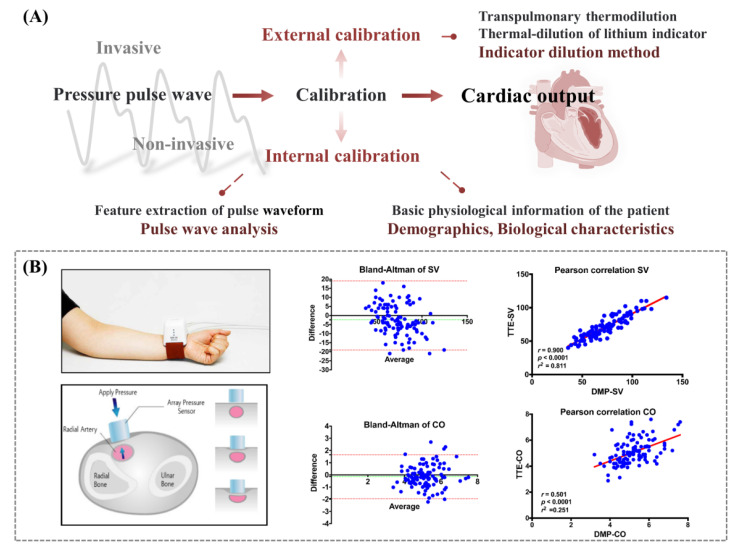
Cardiovascular disease is one of the leading causes of death worldwide. Long-term and real-time monitoring of cardiovascular indicators is required to detect abnormalities and conduct early intervention in time. To this end, the development of flexible wearable/implantable sensors for real-time monitoring of various vital signs has aroused extensive interest among researchers. Among the different kinds of sensors, mechanical sensors can reflect the direct information of pressure fluctuations in the cardiovascular system with the advantages of high sensitivity and suitable flexibility. Herein, we first introduce the recent advances of four kinds of mechanical sensors for cardiovascular system monitoring, based on capacitive, piezoresistive, piezoelectric, and triboelectric principles. Then, the physio-mechanical mechanisms in the cardiovascular system and their monitoring are described, including pulse wave, blood pressure, heart rhythm, endocardial pressure, etc. Finally, we emphasize the importance of real-time physiological monitoring in the treatment of cardiovascular disease and discuss its challenges in clinical translation.
Keywords: blood pressure; cardiac output; cardiovascular disease; endocardial pressure; heart rhythm; mechanical sensors; pulse wave.
Conflict of interest statement
The authors declare no conflict of interest.
Figures
Similar articles
-
Wearable Pressure Sensors for Pulse Wave Monitoring.Adv Mater. 2022 May;34(21):e2109357. doi: 10.1002/adma.202109357. Epub 2022 Mar 31. Adv Mater. 2022. PMID: 35044014 Review.
-
Recent Progress of Wearable Triboelectric Nanogenerator-Based Sensor for Pulse Wave Monitoring.Sensors (Basel). 2023 Dec 20;24(1):36. doi: 10.3390/s24010036. Sensors (Basel). 2023. PMID: 38202897 Free PMC article. Review.
-
Self-Powered Textile Triboelectric Pulse Sensor for Cardiovascular Monitoring.Annu Int Conf IEEE Eng Med Biol Soc. 2023 Jul;2023:1-4. doi: 10.1109/EMBC40787.2023.10340694. Annu Int Conf IEEE Eng Med Biol Soc. 2023. PMID: 38083662
-
Biomechanical Sensing Systems for Cardiac Activity Monitoring.Int J Biomater. 2022 Nov 18;2022:8312564. doi: 10.1155/2022/8312564. eCollection 2022. Int J Biomater. 2022. PMID: 36438068 Free PMC article. Review.
-
Self-powered cardiovascular electronic devices and systems.Nat Rev Cardiol. 2021 Jan;18(1):7-21. doi: 10.1038/s41569-020-0426-4. Epub 2020 Sep 7. Nat Rev Cardiol. 2021. PMID: 32895536 Review.
Cited by
-
Effect of Sonication Batch on Electrical Properties of Graphitic-Based PVDF-HFP Strain Sensors for Use in Health Monitoring.Sensors (Basel). 2024 Mar 21;24(6):2007. doi: 10.3390/s24062007. Sensors (Basel). 2024. PMID: 38544269 Free PMC article.
-
A Dual-Modal Wearable Pulse Detection System Integrated with Deep Learning for High-Accuracy and Low-Power Sleep Apnea Monitoring.Adv Sci (Weinh). 2025 Jun;12(24):e2501750. doi: 10.1002/advs.202501750. Epub 2025 Apr 29. Adv Sci (Weinh). 2025. PMID: 40298874 Free PMC article.
-
Wearable Two-Dimensional Nanomaterial-Based Flexible Sensors for Blood Pressure Monitoring: A Review.Nanomaterials (Basel). 2023 Feb 24;13(5):852. doi: 10.3390/nano13050852. Nanomaterials (Basel). 2023. PMID: 36903730 Free PMC article. Review.
-
DiScO: novel rapid systems mapping to inform digital transformation of health systems.Front Public Health. 2024 Oct 25;12:1441328. doi: 10.3389/fpubh.2024.1441328. eCollection 2024. Front Public Health. 2024. PMID: 39525463 Free PMC article.
-
Recent Progress in Blood Flow Sensing.Sens Actuators A Phys. 2025 Jun;387:116457. doi: 10.1016/j.sna.2025.116457. Epub 2025 Mar 10. Sens Actuators A Phys. 2025. PMID: 40213382
References
-
- Sacco R.L., Adams R., Albers G., Alberts M.J., Benavente O., Furie K., Goldstein L.B., Gorelick P., Halperin J., Harbaugh R. Guidelines for Prevention of Stroke in Patients with Ischemic Stroke or Transient Ischemic Attack. Stroke. 2006;37:577–617. doi: 10.1161/01.STR.0000199147.30016.74. - DOI - PubMed
Publication types
MeSH terms
Grants and funding
- No. XDA16021103/trategic Priority Research Program of the Chinese Academy of Sciences
- No. 82072065, 81471784/National Nature Science Foundation
- no/National Youth Talent Support Program
- No. BX2021299/National Postdoctoral Program for Innovative Talent
- No. 2021M703166/China Postdoctoral Science Foundation
LinkOut - more resources
Full Text Sources
