

Classifying Integrated Signature Molecules in Macrophages of Rheumatoid Arthritis, Osteoarthritis, and Periodontal Disease: An Omics-Based Study
- PMID: 36005137
- PMCID: PMC9406916
- DOI: 10.3390/cimb44080241
Classifying Integrated Signature Molecules in Macrophages of Rheumatoid Arthritis, Osteoarthritis, and Periodontal Disease: An Omics-Based Study
Abstract
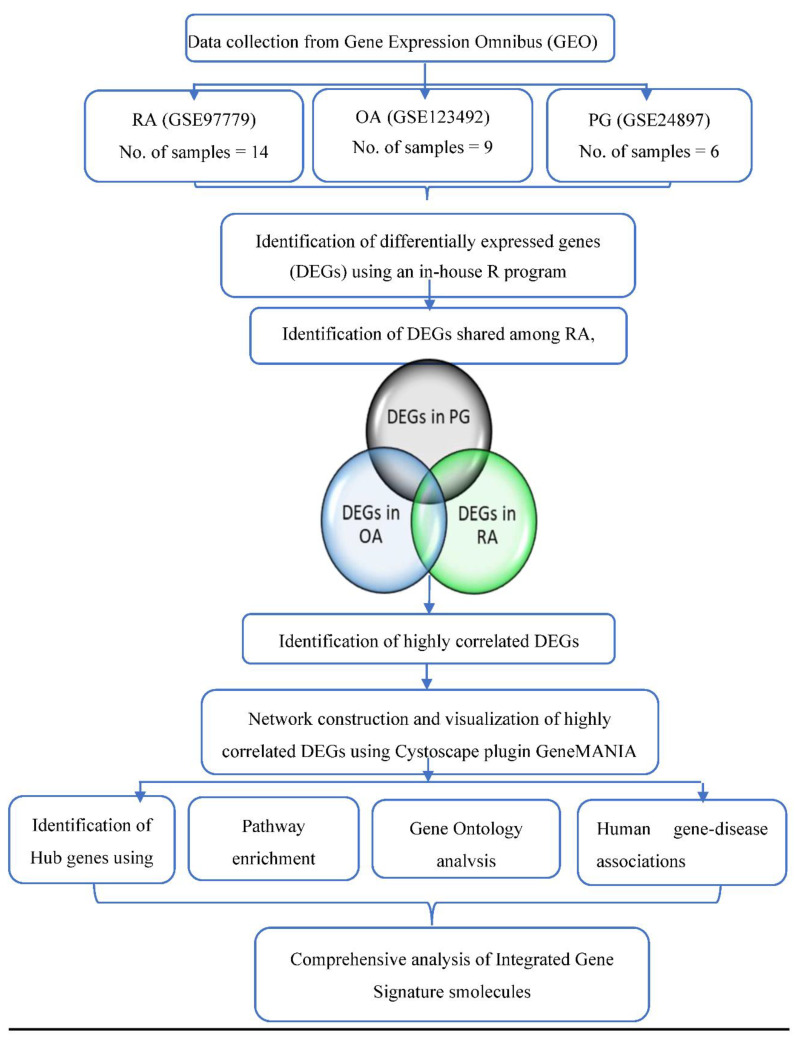
Rheumatoid arthritis (RA), osteoarthritis (OA), and periodontal disease (PD) are chronic inflammatory diseases that are globally prevalent, and pose a public health concern. The search for a potential mechanism linking PD to RA and OA continues, as it could play a significant role in disease prevention and treatment. Recent studies have linked RA, OA, and PD to Porphyromonas gingivalis (PG), a periodontal bacterium, through a similar dysregulation in an inflammatory mechanism. This study aimed to identify potential gene signatures that could assist in early diagnosis as well as gain insight into the molecular mechanisms of these diseases. The expression data sets with the series IDs GSE97779, GSE123492, and GSE24897 for macrophages of RA, OA synovium, and PG stimulated macrophages (PG-SM), respectively, were retrieved and screened for differentially expressed genes (DEGs). The 72 common DEGs among RA, OA, and PG-SM were further subjected to gene-gene correlation analysis. A GeneMANIA interaction network of the 47 highly correlated DEGs comprises 53 nodes and 271 edges. Network centrality analysis identified 15 hub genes, 6 of which are DEGs (API5, ATE1, CCNG1, EHD1, RIN2, and STK39). Additionally, two significantly up-regulated non-hub genes (IER3 and RGS16) showed interactions with hub genes. Functional enrichment analysis of the genes showed that "apoptotic regulation" and "inflammasomes" were among the major pathways. These eight genes can serve as important signatures/targets, and provide new insights into the molecular mechanism of PG-induced RA, OA, and PD.
Keywords: Porphyromonas gingivalis (PG); gene expression analysis; network biology; osteoarthritis (OA); periodontitis; rheumatoid arthritis (RA).
Conflict of interest statement
The authors declare that there are no conflicts of interest regarding the publication of this paper.
Figures


Similar articles
-
Identification and validation of hub genes of synovial tissue for patients with osteoarthritis and rheumatoid arthritis.Hereditas. 2021 Sep 28;158(1):37. doi: 10.1186/s41065-021-00201-0. Hereditas. 2021. PMID: 34583778 Free PMC article.
-
Analysis of differentially expressed genes in rheumatoid arthritis and osteoarthritis by integrated microarray analysis.J Cell Biochem. 2019 Aug;120(8):12653-12664. doi: 10.1002/jcb.28533. Epub 2019 Mar 4. J Cell Biochem. 2019. PMID: 30834598
-
Identification of differential key biomarkers in the synovial tissue between rheumatoid arthritis and osteoarthritis using bioinformatics analysis.Clin Rheumatol. 2021 Dec;40(12):5103-5110. doi: 10.1007/s10067-021-05825-1. Epub 2021 Jul 5. Clin Rheumatol. 2021. PMID: 34224029
-
Rheumatoid arthritis and periodontal disease: What are the similarities and differences?Int J Rheum Dis. 2017 Dec;20(12):1887-1901. doi: 10.1111/1756-185X.13240. Epub 2018 Jan 9. Int J Rheum Dis. 2017. PMID: 29341486 Review.
-
Linkage of Periodontitis and Rheumatoid Arthritis: Current Evidence and Potential Biological Interactions.Int J Mol Sci. 2019 Sep 13;20(18):4541. doi: 10.3390/ijms20184541. Int J Mol Sci. 2019. PMID: 31540277 Free PMC article. Review.
Cited by
-
Prevalence and determinants of periodontitis among a population with knee osteoarthritis, a cross-sectional study at the Douala General Hospital (Littoral, Cameroon).Sci Rep. 2025 Jul 18;15(1):26164. doi: 10.1038/s41598-025-05450-x. Sci Rep. 2025. PMID: 40681551 Free PMC article.
-
Alterations in macrophage polarization play a key role in control and development of periodontal diseases.J Indian Soc Periodontol. 2023 Nov-Dec;27(6):578-582. doi: 10.4103/jisp.jisp_75_23. Epub 2024 Jan 24. J Indian Soc Periodontol. 2023. PMID: 38434507 Free PMC article. Review.
References
-
- Chen B., Zhao Y., Li S., Yang L., Wang H., Wang T., Bin S., Gai Z., Heng X., Zhang C., et al. Variations in oral microbiome profiles in rheumatoid arthritis and osteoarthritis with potential biomarkers for arthritis screening. Sci. Rep. 2018;8:17126. doi: 10.1038/s41598-018-35473-6. - DOI - PMC - PubMed
-
- Kim H.-S., Park H.-M., Kim H., Lee H.S., Son D.-H., Lee Y.-J. Association Between the Severity of Periodontitis and Osteoarthritis in Middle-Aged and Older Patients With Type 2 Diabetes Mellitus: A Nationwide Population-Based Study. Arthritis Care Res. 2022;74:403–409. doi: 10.1002/acr.24484. - DOI - PubMed
Grants and funding
LinkOut - more resources
Full Text Sources
Miscellaneous
