. 2022 Aug 25:11:e76010.
doi: 10.7554/eLife.76010.

An improved organ explant culture method reveals stem cell lineage dynamics in the adult Drosophila intestine

Affiliations

An improved organ explant culture method reveals stem cell lineage dynamics in the adult Drosophila intestine

Marco Marchetti et al. Elife. .

Abstract

In recent years, live-imaging techniques have been developed for the adult midgut of Drosophila melanogaster that allow temporal characterization of key processes involved in stem cell and tissue homeostasis. However, these organ culture techniques have been limited to imaging sessions of <16 hours, an interval too short to track dynamic processes such as damage responses and regeneration, which can unfold over several days. Therefore, we developed an organ explant culture protocol capable of sustaining midguts ex vivo for up to 3 days. This was made possible by the formulation of a culture medium specifically designed for adult Drosophila tissues with an increased Na+/K+ ratio and trehalose concentration, and by placing midguts at an air-liquid interface for enhanced oxygenation. We show that midgut progenitor cells can respond to gut epithelial damage ex vivo, proliferating and differentiating to replace lost cells, but are quiescent in healthy intestines. Using ex vivo gene induction to promote stem cell proliferation using RasG12V or string and Cyclin E overexpression, we demonstrate that progenitor cell lineages can be traced through multiple cell divisions using live imaging. We show that the same culture set-up is useful for imaging adult renal tubules and ovaries for up to 3 days and hearts for up to 10 days. By enabling both long-term imaging and real-time ex vivo gene manipulation, our simple culture protocol provides a powerful tool for studies of epithelial biology and cell lineage behavior.

Keywords: D. melanogaster; Drosophila midgut; cell biology; cell lineage; live-imaging; organ culture; stem cells; tissue regeneration.


Conflict of interest statement

MM, CZ, BE No competing interests declared

Figures

Figure 1.
Figure 1.. Sample preparation for live-imaging.
(A–N) Minimal handling dissection used to gently explant adult Drosophila midguts, limiting the risk of damaging the intestines. See also Figure 1—video 1. (O) Culture chamber setup (left) and mounting of explanted midguts (middle and bottom diagram) to produce an air-liquid interface culture (right). See Materials and methods section and Figure 1—video 1 for in-depth description.
Figure 2.
Figure 2.. A custom culture medium sustains the midgut ex vivo.
(A) Incorporation of the cell-impermeable dye NucGreen shows the levels of midgut cell death ex vivo in midguts cultured in: standard Schneider’s medium (SM), modified Schneider’s medium (MSM), MSM with 10% added fetal calf serum (FCS), MSM including co-culture with fat bodies and ovaries (FbO), culture in fly extract prepared in MSM (FeMSM), and the combination of all these conditions (Complete). Error bars represent the standard error of the mean. (B) Explanted midguts maintain their shape and tissue integrity for 3 days in culture. However, commensal bacteria keep growing in the lumen, especially in the posterior section where this can be seen as a darkening of the lumen (white arrows). Scale bar is 100 µm. (C) Maximum intensity projection of intestine expressing a lineage-tracing system under esgTS driver and imaged for 72 hr at 29 °C. The fly of origin was incubated at 29 °C for 24 hr prior to dissection. The intestine was undamaged during the course of imaging and did not show proliferation events. Scale bar is 5 µm. See also Figure 2—video 1. (D–E) Temperature-sensitive gene induction ex vivo is possible in both progenitor cells (D) and enterocytes (E). GFP levels expressed after 24 hr of gene induction are comparable between in vivo and ex vivo intestines. Explanted intestines were shifted to 29 °C immediately after sample preparation. In vivo controls were shifted simultaneously. Images are representative maximum intensity projections of posterior midguts. Scale bar is 50 µm. Each dot in the graphs represents the average GFP expression level in the posterior section of an intestine (T test). (ns, not significant).
Figure 2—figure supplement 1.
Figure 2—figure supplement 1.. Ex vivo temperature sensitive gene expression of GFP.
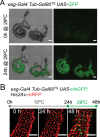
(A) Intestines explanted from flies raised at 18 °C show no GFP expression. After explantation, guts were cultured at 29 °C and started to express GFP driven by the esgTS system. GFP channel is a maximum intensity projection. Scale bar is 200 µm. (B) Intestines cultured at 18 °C for 24 hr, then shifted to 29 °C are still able to activate expression of nlsGFP, showing that the epithelium remains healthy long-term. Images are maximum intensity projections. Scale bar is 50 µm.
Figure 3.
Figure 3.. Midguts respond to damage ex vivo.
(A) Healthy gut fed a control diet showing no sign of tissue damage. Images are maximum intensity projections. See also Figure 3—video 1. Scale bar is 20 µm. (B) Gut from fly fed SDS 0.2% overnight showing progressive tissue repair ex vivo mediated by progenitor cells proliferation and differentiation. As cells differentiate, nlsGFP expression is gradually lost. Area delimited by the yellow rectangle is enlarged in (B’). Images are maximum intensity projections. See also Figure 3—video 2. Scale bar is 20 µm. (B’) Enlargement of panel (B) showing an esg+ cell (white outline) differentiating and replacing dying enterocytes (yellow circles). As the cell differentiates, nlsGFP expression is lost and its nucleus grows larger. Images are maximum intensity projections. See also Figure 3—video 3. Scale bar is 10 µm. (C) Example of stem cell dividing upon tissue damage initiated by SDS feeding. Cell is marked by the expression of nlsGFP (yellow arrowhead). Note that in the 30 hr time-point the cell is in mitosis and so the nlsGFP signal is mostly lost due to nuclear envelope breakdown. After mitosis, the nuclear envelope is reformed and GFP re-accumulates in the nucleus of the daughter cells. Images are single z-slices. Scale bar is 5 µm. (D) Plots of nuclear area (red) and mean nuclear GFP intensity (green) from single progenitor cells from healthy guts. Note that both nuclear size and GFP signal, despite a small gradual dip caused by photobleaching, are stable for the duration of the imaging session. See also Figure 3—video 4, left column. (E) Plots of nuclear area (red) and mean nuclear GFP intensity (green) in single progenitor cells from SDS-damaged guts. Note that nuclear size increases, while GFP signals dims over time, suggesting EB to EC differentiation. See also Figure 3—video 4, right column. (F) Quantification of nuclear area of esg+ cells in control (green) and SDS-damaged (red) intestines cultured ex vivo. Each cell was measured at imaging start (i.e. 0 hr) and 48 hr later. In control guts, esg+ cells remain quiescent and have no change in nuclear size. Due to the SDS treatment, several progenitor cells have a large nucleus already at the time of dissection. Furthermore, most progenitor cells’ nuclear area significantly increases during the course of imaging (Two-way Anova and Šídák’s multiple comparisons test). (G) Ratio of nuclear GFP intensity for individual esg+ cells from control or SDS-damaged intestines cultured ex vivo. While cells in control intestines do not lose GFP expression (except for a minor loss due to photobleaching), several cells in the SDS-treated intestines show a significant loss of GFP intensity, suggesting their differentiation and change of cell identity (T test). (ns, not significant, *, p<0.05; ****, p<0.0001).
Figure 3—figure supplement 1.
Figure 3—figure supplement 1.. Damage response to SDS feeding in vivo.
(A) Images of intestines dissected and stained after being fed a control diet for 24 hr or SDS 0.2%-laced food for 18 hr then sucrose 0.05% for 6 hr or SDS 0.2%-laced food for 18 hr, sucrose 0.05% for 6 hr, then clean food for 24 hr or 48 hr (recovery phase). Intestines were fixed with PFA 6%, then stained with DAPI and an anti-GFP antibody, then mounted and imaged. Similarly to the ex vivo experiment (see Figure 3), many large GFP-dim cells can be seen after SDS treatment. Images are maximum intensity projections. Scale bar is 50 µm. (B) Quantification of GFP+ cells’ nuclear area of intestines treated as in panel (A) showing the significant appearance of GFP + cells with large nuclei after SDS-treatment (Kruskal-Wallis test and Dunn’s multiple comparisons test). (C) Phospho-Ser 10-Histone 3 (pH3) staining quantification of intestines treated as in panel (A). As observed in the ex vivo experiment (see Figure 3), mitoses are only detectable at a late time-point (One-way Anova and Tukey multiple comparisons test; ns, not significant, ****, p<0.0001).
Figure 3—figure supplement 2.
Figure 3—figure supplement 2.. Tissue repair in midguts damaged ex vivo.
(A) Diagram depicting the laceration of midgut tissues with a tungsten needle. (B) Time-lapse of an intestine expressing GFP via esgTS driver and damaged with a tungsten needle (white arrowhead at time-point 0 hr). Note the gradual replacement of the epithelium by the proliferation/differentiation of GFP+ progenitor cells. Images are maximum intensity projections. See also Figure 3—video 5. Scale bar is 50 µm. (C) Example of stem cell dividing upon tissue damage from the intestine shown in panel B. Scale bar is 5 µm. (D) Undamaged intestine expressing only low levels of upd3 (green). Images are maximum intensity projections. See also Figure 3—video 6. Scale bar is 50 µm. (E) Intestine damaged with the protocol described in panel (A) showing strong activation of the upd3 reporter (green) at the damaged area (marked by the yellow arrowhead). Images are maximum intensity projections. See also Figure 3—video 7. Scale bar is 50 µm.
Figure 3—figure supplement 3.
Figure 3—figure supplement 3.. Notch knock-down induces tumorigenesis ex vivo.
(A) Undamaged intestine expressing NRNAi under the esgTS driver system showing no tumorigenesis. Images are maximum intensity projections. See also Figure 3—video 8. Scale bar is 20 µm. (B) Intestine expressing NRNAi under the esgTS driver system accidentally damaged during dissection. The damaged area (yellow ellipses) shows massive cell death. In response, esg+ progenitor cells started to proliferate (see full and dashed yellow rectangles for examples, matching each between frames). Unlike in normal damage conditions, progenitor cells failed to differentiate (compare to Figure 3B). Images are maximum intensity projections. See also Figure 3—video 9. Scale bar is 20 µm.
Figure 4.
Figure 4.. Genetic induction of intestinal stem cell proliferation.
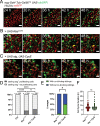
(A) Live-imaging of a normal intestine expressing nlsGFP in progenitor cells via esgTS driver. Intestines were shifted to 29 °C at the start of imaging. Note the gradual accumulation of GFP signal showing variability between cells in terms of both time and intensity. Images are maximum intensity projections. See also Figure 4—video 1. Scale bar is 20 µm. (B) Live-imaging of an intestine expressing nlsGFP and RasG12V in progenitor cells via esgTS driver. Intestines were shifted to 29 °C at the start of imaging. GFP+ cells can be seen rapidly dividing and displacing mature enterocytes (yellow arrowhead). Images are maximum intensity projections. See also Figure 4—video 2. Scale bar is 20 µm. (C) Live-imaging of an intestine expressing nlsGFP, stg, and CycE in progenitor cells via esgTS driver. Intestines were shifted to 29 °C at the start of imaging. GFP+ cells can be seen rapidly dividing. Images are maximum intensity projections. See also Figure 4—video 3. Scale bar is 20 µm. (D) Quantification of observed proliferating and non-proliferating esg+ progenitor cells in control and intestines expressing RasG12V or stg and CycE. Only cells observed from the moment they expressed visible levels of GFP to the end of the imaging session are included. The progeny of observed mitoses were not counted for this analysis. (E) Frequency of stem cell lineages with divisions giving rise to two proliferative cells (green), compared between intestines expressing either RasG12V or stg and CycE (Fisher’s exact test). (F) Quantification of cell cycle durations of progenitor cells expressing either RasG12V or stg and CycE, and nlsGFP. No significant difference was found between the two genotypes (Mann-Whitney test; ns, not significant; *, p<0.05).
Figure 5.
Figure 5.. Example of a reconstructed ISC lineage.
(A) Time-lapse of a single RasG12V-expressing ISC undergoing multiple rounds of mitoses. The nlsGFP channel is shown. Cells belonging to the lineage are marked by yellow arrowheads. (B) Lineage diagram. Cells visible at the last time-point shown are marked in magenta. Images are maximum intensity projections of z-slices encompassing the cells in the lineage. See also Figure 5—video 1. Scale bar is 5 µm.
Figure 6.
Figure 6.. Examples of asymmetric and symmetric divisions.
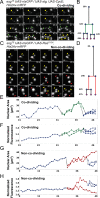
(A) nlsGFP channel showing a stem cell undergoing division upon expression of stg and CycE via esgTS driver and giving rise to co-dividing siblings. The resulting daughter cells (green arrowheads) can be seen further dividing at the 41 hr and 42 hr time-points. A white circle denotes the outline of the starting cell at the initial time-points, when signal was weakest. Images are maximum intensity projections of z-slices encompassing the cells in the lineage. See also Figure 6—video 1. Scale bar is 5 µm. (B) Lineage diagram for cell in A. Green branch denotes co-dividing sibings. Cell present at the end of the imaging session are marked by magenta dots. (C) nlsGFP channel showing a stem cell undergoing division upon expression of RasG12V via esgTS driver giving rise to non-co-dividing siblings. Of the resulting daughter cells (red arrowheads), only one can be seen dividing further. The non-dividing cell is observed for at least 6 hr following the division of its sister cell. Images are maximum intensity projections of z-slices encompassing the cells in the lineage. See also Figure 6—video 2. Scale bar is 5 µm. (D) Lineage diagram for cell in C. Red branch denotes non-co-dividing siblings. Cell present at the end of the imaging session are marked by magenta dots. (E–H) Plots of nuclear area (E, G) and nuclear GFP mean intensity (F, H) for the lineage in A (E–F) and C (G–H). Dotted lines connect mitotic cells to their progeny. Green and red lines denote co-dividing and non-co-dividing siblings, respectively. The GFP channel was used for quantification.
Figure 7.
Figure 7.. Analysis of non-co-dividing and co-dividing siblings in the Drosophila midgut.
(A) Angle between daughter cells after mitosis as referenced to the imaging plane. No difference was found between the two types of daughter pairs (Mann-Whitney). (B) XY (top panel) and Z (bottom panels) nlsGFP profiles of the division event from Figure 6A and B giving rise to co-dividing siblings. Cell proliferation was stimulated by esgTS-driven expression of stg and CycE. Scale bar is 5 µm. (C) XY (top panel) and Z (bottom panels) nlsGFP profiles of the division event from Figure 6C and D giving rise to non-co-dividing siblings. Cell proliferation was stimulated by esgTS-driven expression of RasG12V. Scale bar is 5 µm. (D) Internuclear distance between daughter cells in the first 5 hr after mitosis. Time point 0 hr denotes the first at which the two daughter cells are visible. Error bars represent standard deviation (Two-way Anova and Šídák’s multiple comparisons test). (E) Example of lineage characterized by both non-co-dividing (red) and co-dividing siblings (green). Cell proliferation was stimulated by esgTS-driven expression of stg and CycE. (F) Internuclear distance between the non-co-dividing and co-dividing sister cells from the lineage in E. Time point 0 hr denotes the first at which the two daughter cells are visible. (ns, not significant, ***, p<0.001; ****, p<0.0001).
Figure 7—figure supplement 1.
Figure 7—figure supplement 1.. Lack of effect of genotype and time-point after mitosis on cell motility.
For all graphs, red and blue denote data from dividing and non-dividing progenies of non-co-dividing siblings, respectively, purple refers to data from all cells in non-co-dividing pairs, while green refers to data from co-dividing siblings. (A) The genotype used to promote ISC proliferation does not result in differences in cell motility in the dividing (red) or non-dividing (blue) cells from non-co-dividing siblings (Two-way Anova and Tukey multiple comparisons test). (B–D) Cell motility calculated as the distance travelled by a cell between two subsequent time-points. X-axis indicates the time passed from the first appearance of a cell. Cell motility remains constant across time for the dividing (B), non-dividing (C) cells in non-co-dividing siblings, as well as for co-dividing cells (D) (Mixed-effects analysis was used instead of Anova to account for missing values due to cells proliferating and errors during image registration. Tukey’s test was used for multiple comparisons). (E) No difference in cell motility was found between dividing (red) and non-dividing (blue) cells in non-co-dividing siblings and co-dividing pairs (green). (F) Movements of cells relative to their sisters for co-dividing and non-co-dividing pairs. Only the first 6 time-points after the first appearance of each pair was used for this analysis (Mann-Whitney test). (ns, not significant, *, p<0.05).
Figure 8.
Figure 8.. Ex vivo culture of Malpighian tubules and ovaries.
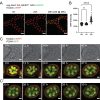
(A) Malpighian tubules cultured at 18 °C for 24 hr, then shifted to 29 °C are still able to activate expression of nlsGFP driven by the esgTS system, showing that the epithelium remains healthy long-term. Images are maximum intensity projections. Scale bar is 50 µm. (B) Quantification of GFP expression of progenitor cells from Malpighian tubules cultured ex vivo. Same cells were measured at 0, 1, and 2 days after explantation. (Dunnett’s multiple comparisons test) (ns, not significant, ****, p<0.0001) (C) Stage 4 follicle growing in size and elongating over the course of 2 days ex vivo. (C’) Selected frames showing follicle rotation. Cyan dots mark the current position of a nucleus, while yellow ones marked the position in the previous frame. Images are maximum intensity projections of the 4 center-most z-slices. See also Figure 8—video 1. Scale bar is 10 µm.
Author response image 1.

Similar articles

Cited by

References

    1. Ahmed SMH, Maldera JA, Krunic D, Paiva-Silva GO, Pénalva C, Teleman AA, Edgar BA. Fitness trade-offs incurred by ovary-to-gut steroid signalling in Drosophila. Nature. 2020;584:415–419. doi: 10.1038/s41586-020-2462-y. - DOI - PMC - PubMed
    1. Amcheslavsky A, Jiang J, Ip YT. Tissue damage-induced intestinal stem cell division in Drosophila. Stem Cell. 2009;4:49–61. doi: 10.1016/j.stem.2008.10.016. - DOI - PMC - PubMed
    1. Apidianakis Y, Pitsouli C, Perrimon N, Rahme L. Synergy between bacterial infection and genetic predisposition in intestinal dysplasia. PNAS. 2009;106:20883–20888. doi: 10.1073/pnas.0911797106. - DOI - PMC - PubMed
    1. Beebe K, Lee WC, Micchelli CA. JAK/STAT signaling coordinates stem cell proliferation and multilineage differentiation in the Drosophila intestinal stem cell lineage. Developmental Biology. 2010;338:28–37. doi: 10.1016/j.ydbio.2009.10.045. - DOI - PubMed
    1. Biteau B, Jasper H. EGF signaling regulates the proliferation of intestinal stem cells in Drosophila. Development. 2011;138:1045–1055. doi: 10.1242/dev.056671. - DOI - PMC - PubMed

Publication types

LinkOut - more resources