

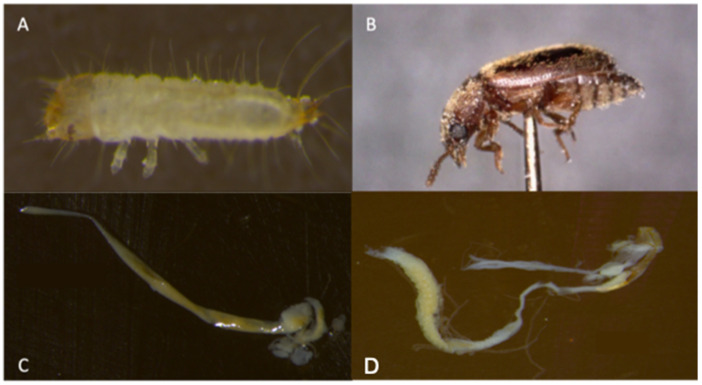
Characterization of Microbial Communities from the Alimentary Canal of Typhaea stercorea (L.) (Coleoptera: Mycetophagidae)
- PMID: 36005310
- PMCID: PMC9408915
- DOI: 10.3390/insects13080685
Characterization of Microbial Communities from the Alimentary Canal of Typhaea stercorea (L.) (Coleoptera: Mycetophagidae)
Abstract
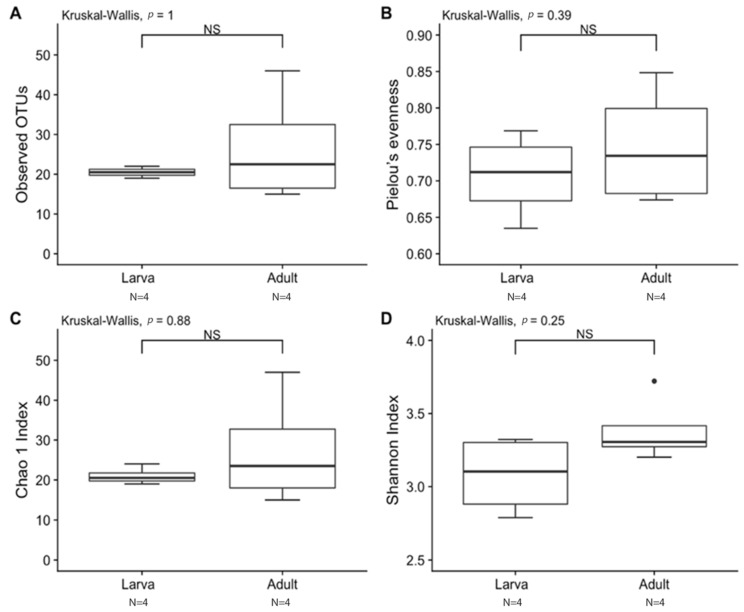
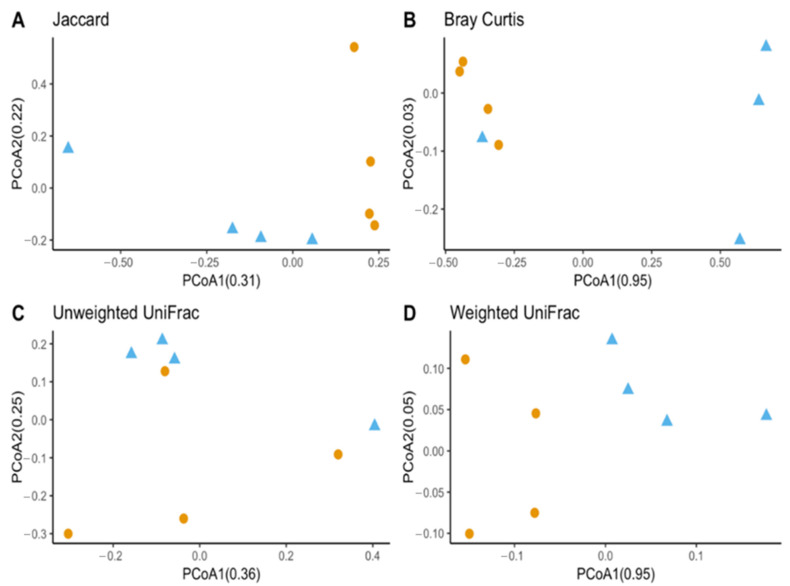
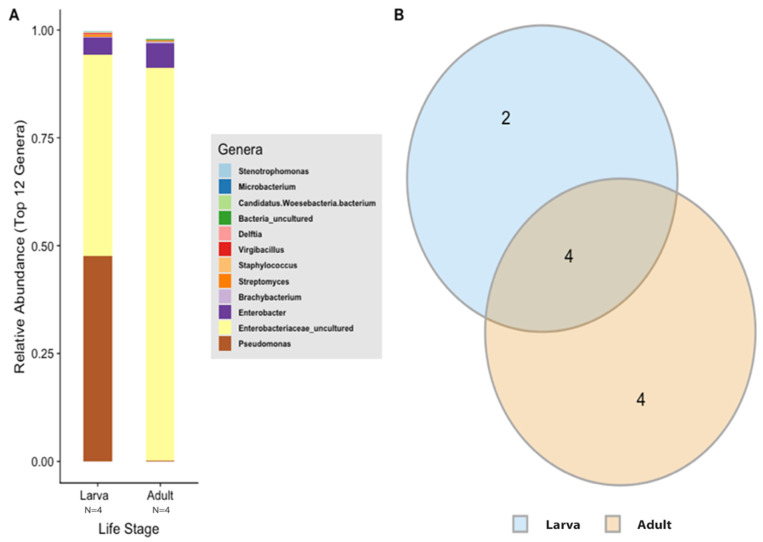
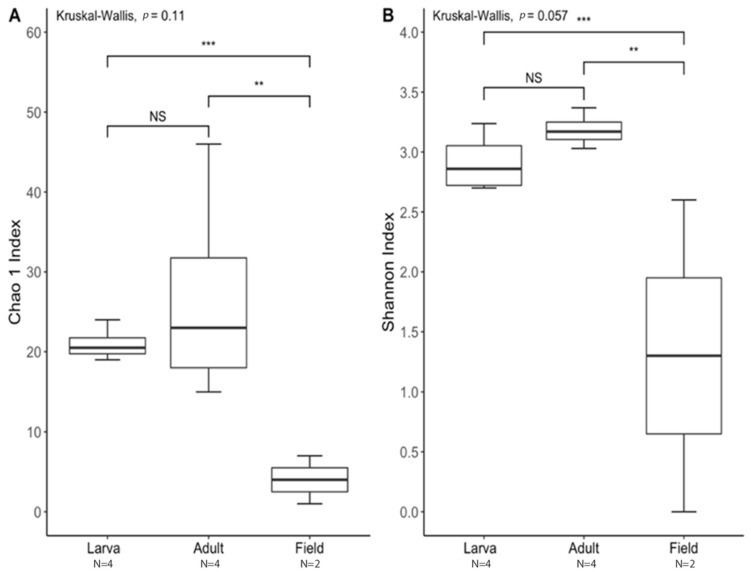
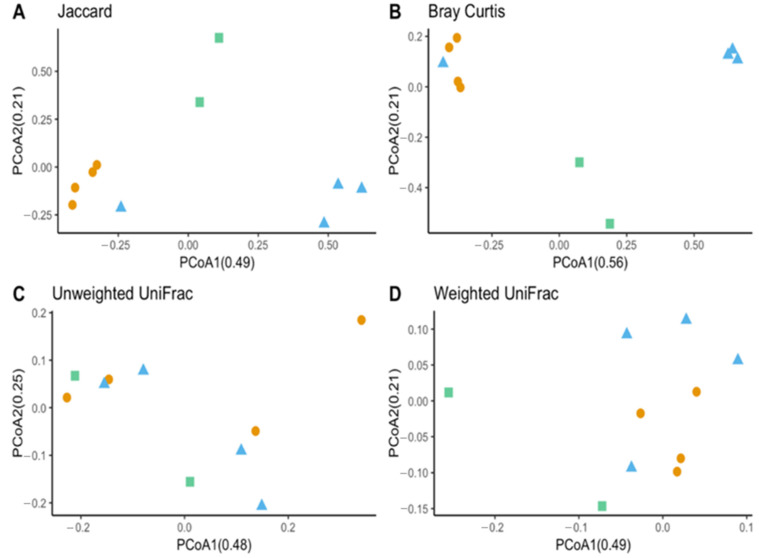
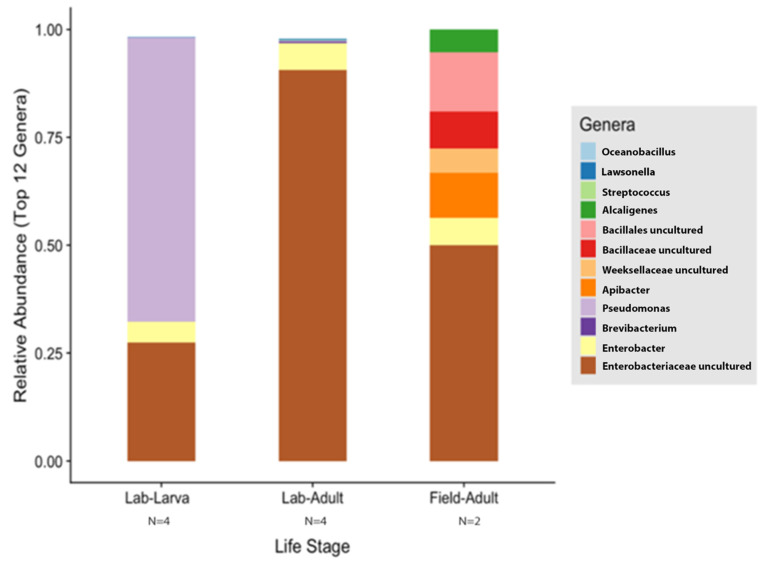
The gut microbiomes of symbiotic insects typically mediate essential functions lacking in their hosts. Here, we describe the composition of microbes residing in the alimentary canal of the hairy fungus beetle, Typhaea stercorea (L.), at various life stages. This beetle is a post-harvest pest of stored grains that feeds on fungi and serves as a vector of mycotoxigenic fungi. It has been reported that the bacterial communities found in most insects' alimentary canals contribute to nutrition, immune defenses, and protection from pathogens. Hence, bacterial symbionts may play a key role in the digestive system of T. stercorea. Using 16S rRNA amplicon sequencing, we examined the microbiota of T. stercorea. We found no difference in bacterial species richness between larvae and adults, but there were compositional differences across life stages (PERMANOVA:pseudo-F(8,2) = 8.22; p = 0.026). The three most abundant bacteria found in the alimentary canal of the larvae and adults included Pseudomonas (47.67% and 0.21%, respectively), an unspecified genus of the Enterobacteriaceae family (46.60 % and 90.97%, respectively), and Enterobacter (3.89% and 5.75%, respectively). Furthermore, Pseudomonas spp. are the predominant bacteria in the larval stage. Our data indicated that field-collected T. stercorea tended to have lower species richness than laboratory-reared beetles (Shannon: H = 5.72; p = 0.057). Furthermore, the microbial communities of laboratory-reared insects resembled one another, whereas field-collected adults exhibited variability (PERMANOVA:pseudo-F(10,3) = 4.41; p = 0.006). We provide evidence that the environment and physiology can shift the microbial composition in the alimentary canal of T. stercorea.
Keywords: 16S rRNA amplicon sequencing; Typhaea stercorea; alimentary canal; bacterial symbionts; fungivore.
Conflict of interest statement
The authors declare no conflict of interest.
Figures
Similar articles
-
Typhaea stercorea (Coleoptera: Mycetophagidae), a carrier of Salmonella enterica serovar Infantis in a Danish broiler house.J Econ Entomol. 1998 Jun;91(3):660-4. doi: 10.1093/jee/91.3.660. J Econ Entomol. 1998. PMID: 9650515
-
Phenology and spatial pattern of Typhaea stercorea (Coleoptera: Mycetophagidae) infesting stored grain: estimation by pitfall trapping.J Econ Entomol. 2000 Apr;93(2):240-51. doi: 10.1603/0022-0493-93.2.240. J Econ Entomol. 2000. PMID: 10826168
-
Gut bacterial communities and their contribution to performance of specialist Altica flea beetles.Microb Ecol. 2020 Nov;80(4):946-959. doi: 10.1007/s00248-020-01590-x. Epub 2020 Sep 3. Microb Ecol. 2020. PMID: 32880699
-
Influences of a Prolific Gut Fungus (Zancudomyces culisetae) on Larval and Adult Mosquito (Aedes aegypti)-Associated Microbiota.Appl Environ Microbiol. 2020 Jan 21;86(3):e02334-19. doi: 10.1128/AEM.02334-19. Print 2020 Jan 21. Appl Environ Microbiol. 2020. PMID: 31757825 Free PMC article.
-
Bacterial communities associated with the digestive tract of the predatory ground beetle, Poecilus chalcites, and their modification by laboratory rearing and antibiotic treatment.Microb Ecol. 2009 Feb;57(2):349-58. doi: 10.1007/s00248-008-9415-6. Epub 2008 Jun 28. Microb Ecol. 2009. PMID: 18587608
References
-
- Christensen C.M., Kaufmann H.H. Grain Storage: The Role of Fungi in Quality Loss. University of Minnesota Press; Minneapolis, MN, USA: 1969. pp. 3–35.
-
- FAO FAO Cereal Supply and Demand Brief: World Food Situation. [(accessed on 17 July 2016)]. Available online: http://www.fao.org/worldfoodsituation/csdb/en/
LinkOut - more resources
Full Text Sources
Miscellaneous
