

The Role of Feeding Characteristics in Shaping Gut Microbiota Composition and Function of Ensifera (Orthoptera)
- PMID: 36005344
- PMCID: PMC9409189
- DOI: 10.3390/insects13080719
The Role of Feeding Characteristics in Shaping Gut Microbiota Composition and Function of Ensifera (Orthoptera)
Abstract
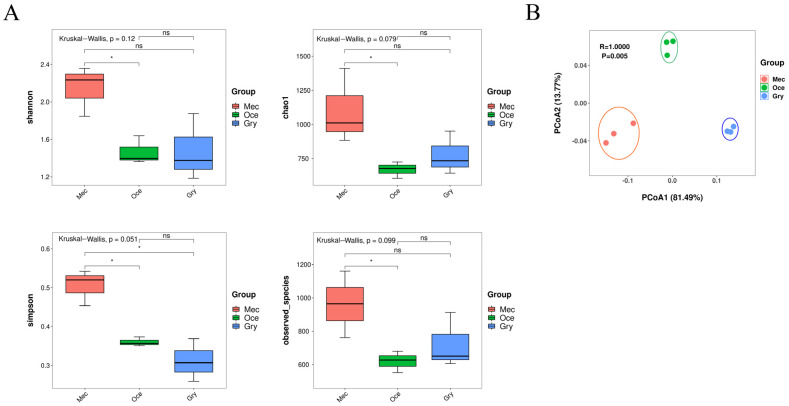
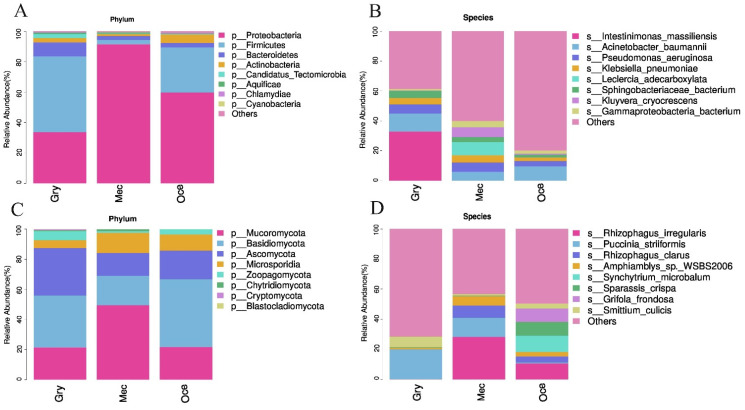
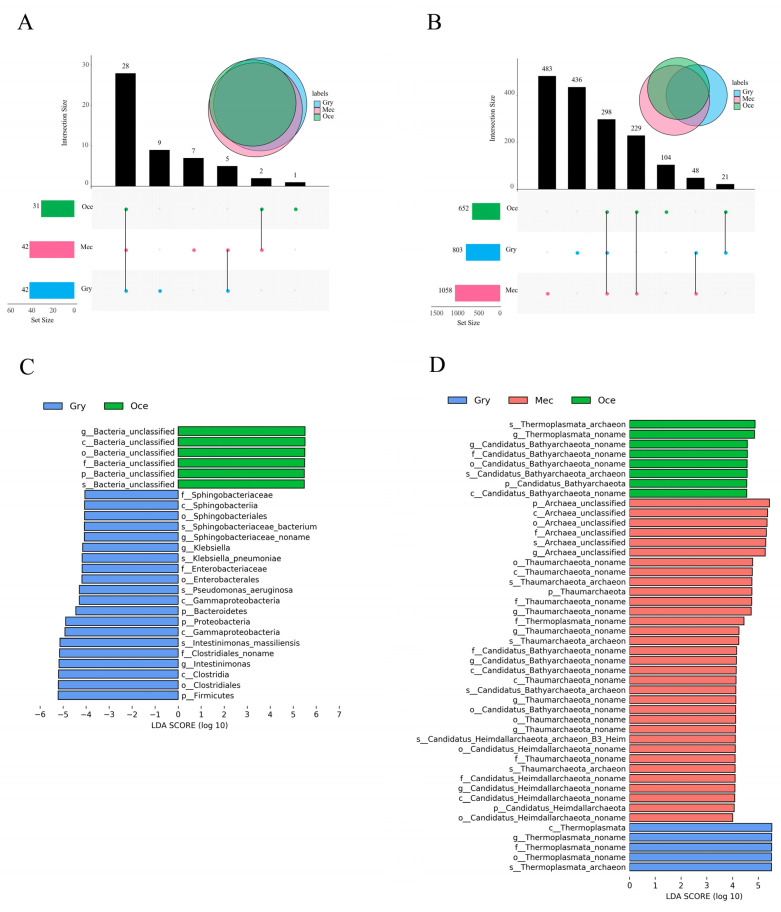
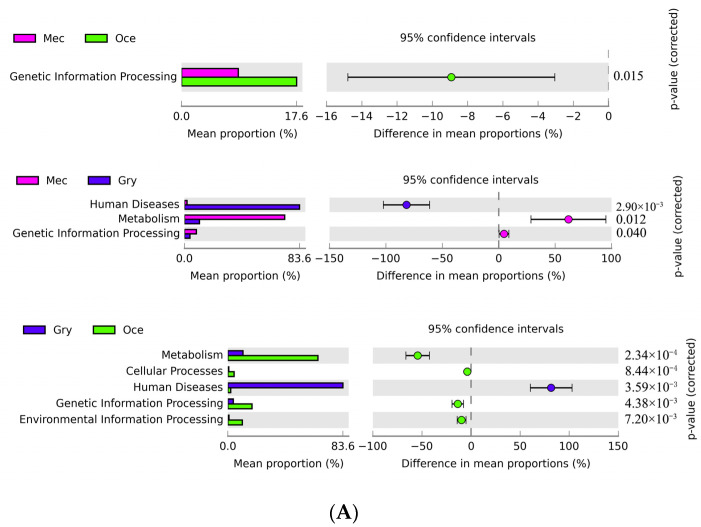
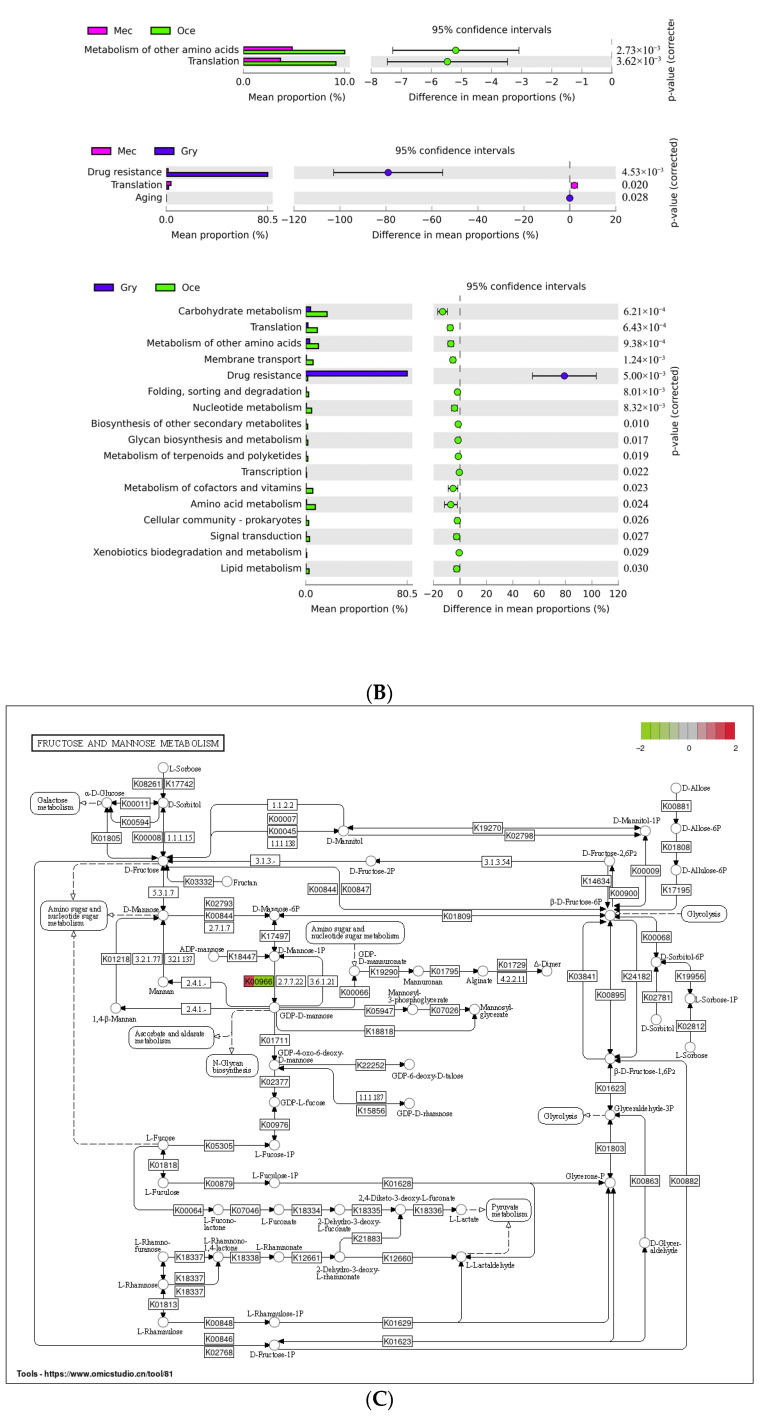
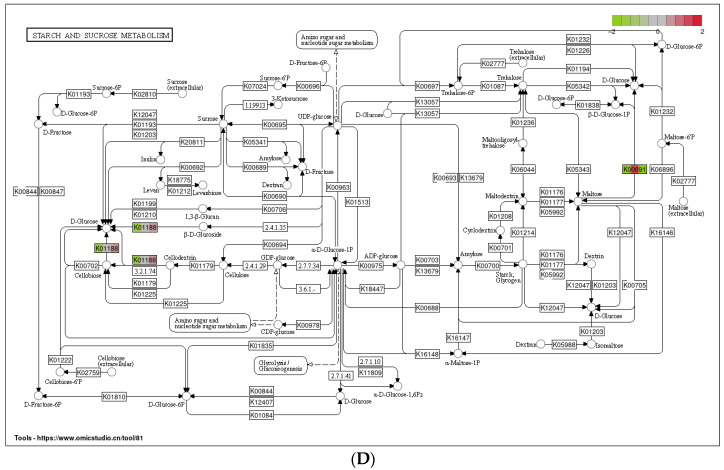
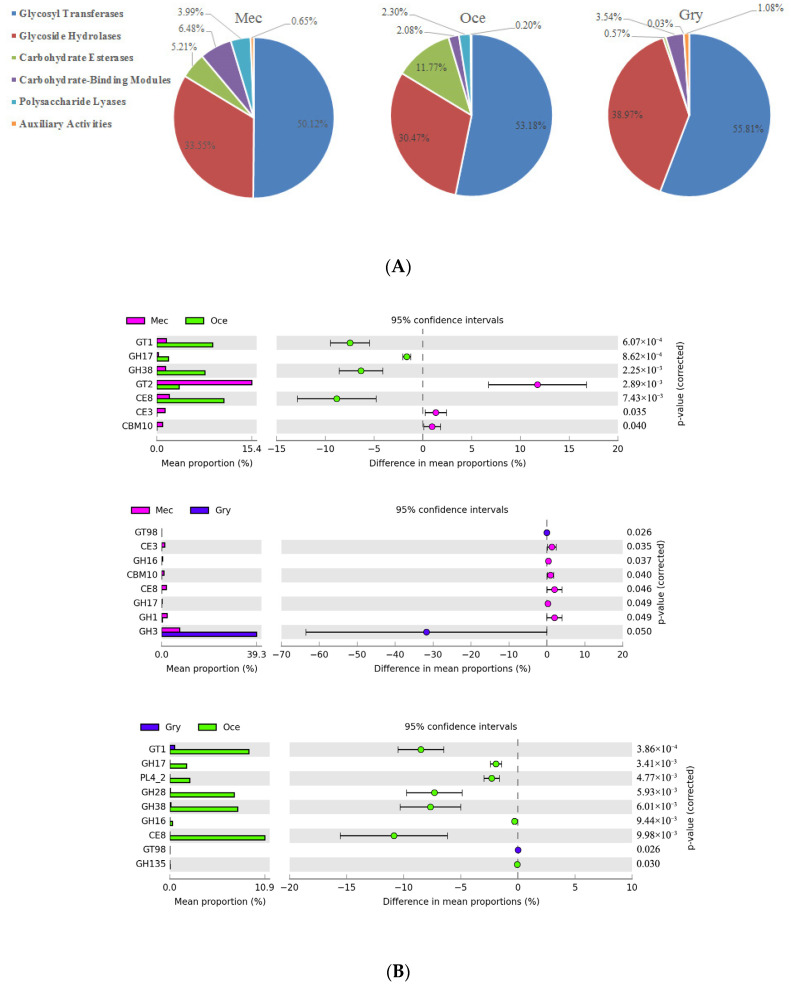
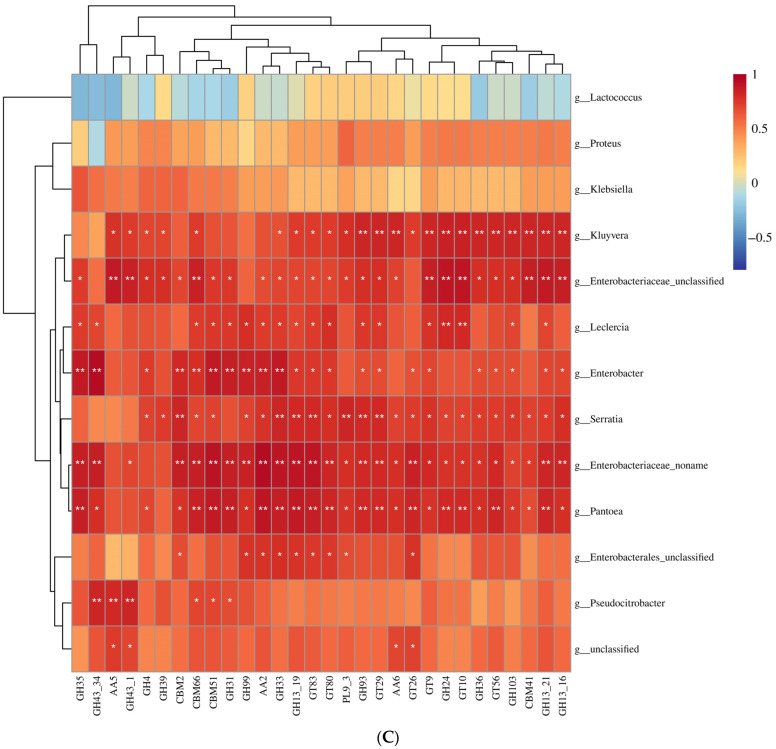
Feeding habits were the primary factor affecting the gut bacterial communities in Ensifera. However, the interaction mechanism between the gut microbiota and feeding characteristics is not precisely understood. Here, the gut microbiota of Ensifera with diverse feeding habits was analyzed by shotgun metagenomic sequencing to further clarify the composition and function of the gut microbiota and its relationship with feeding characteristics. Our results indicate that under the influence of feeding habits, the gut microbial communities of Ensifera showed specific characteristics. Firstly, the gut microbial communities of the Ensifera with different feeding habits differed significantly, among which the gut microbial diversity of the herbivorous Mecopoda niponensis was the highest. Secondly, the functional genes related to feeding habits were in high abundance. Thirdly, the specific function of the gut microbial species in the omnivorous Gryllotalpa orientalis showed that the more diverse the feeding behavior of Ensifera, the worse the functional specificity related to the feeding characteristics of its gut microbiota. However, feeding habits were not the only factors affecting the gut microbiota of Ensifera. Some microorganisms' genes, whose functions were unrelated to feeding characteristics but were relevant to energy acquisition and nutrient absorption, were detected in high abundance. Our results were the first to report on the composition and function of the gut microbiota of Ensifera based on shotgun metagenomic sequencing and to explore the potential mechanism of the gut microbiota's association with diverse feeding habits.
Keywords: CAZymes; Ensifera; KEGG; feeding habits; gut microbiota; metagenomic.
Conflict of interest statement
The authors declare that they have no known competing financial interests or personal relationships that could have appeared to influence the work reported in this paper.
Figures
Similar articles
-
Gut bacterial communities across 12 Ensifera (Orthoptera) at different feeding habits and its prediction for the insect with contrasting feeding habits.PLoS One. 2021 Apr 26;16(4):e0250675. doi: 10.1371/journal.pone.0250675. eCollection 2021. PLoS One. 2021. PMID: 33901256 Free PMC article.
-
Genetic Effects on the Gut Microbiota Assemblages of Hybrid Fish From Parents With Different Feeding Habits.Front Microbiol. 2018 Dec 4;9:2972. doi: 10.3389/fmicb.2018.02972. eCollection 2018. Front Microbiol. 2018. PMID: 30564218 Free PMC article.
-
Comparative Analysis of the Gut Microbiota of Bat Species with Different Feeding Habits.Biology (Basel). 2024 May 22;13(6):363. doi: 10.3390/biology13060363. Biology (Basel). 2024. PMID: 38927243 Free PMC article.
-
Prebiotic effects: metabolic and health benefits.Br J Nutr. 2010 Aug;104 Suppl 2:S1-63. doi: 10.1017/S0007114510003363. Br J Nutr. 2010. PMID: 20920376 Review.
-
Distribution of gut microbiota across intestinal segments and their impact on human physiological and pathological processes.Cell Biosci. 2025 Apr 16;15(1):47. doi: 10.1186/s13578-025-01385-y. Cell Biosci. 2025. PMID: 40241220 Free PMC article. Review.
Cited by
-
Gut microorganisms of Locusta migratoria in various life stages and its possible influence on cellulose digestibility.mSystems. 2024 Jul 23;9(7):e0060024. doi: 10.1128/msystems.00600-24. Epub 2024 Jun 18. mSystems. 2024. PMID: 38888356 Free PMC article.
-
Insight into the Microbiota of Orthopteran in Relation to Gut Compartmentalisation.Insects. 2025 May 24;16(6):555. doi: 10.3390/insects16060555. Insects. 2025. PMID: 40558985 Free PMC article. Review.
-
The Gut Bacteria of Gampsocleis gratiosa (Orthoptera: Tettigoniidae) by Culturomics.Insects. 2025 Jan 27;16(2):123. doi: 10.3390/insects16020123. Insects. 2025. PMID: 40003753 Free PMC article.
-
The species and abundance of gut bacteria both positively impact Phortica okadai behavior.Parasit Vectors. 2024 May 11;17(1):217. doi: 10.1186/s13071-024-06297-3. Parasit Vectors. 2024. PMID: 38734668 Free PMC article.
-
Microorganism Contribution to Mass-Reared Edible Insects: Opportunities and Challenges.Insects. 2024 Aug 13;15(8):611. doi: 10.3390/insects15080611. Insects. 2024. PMID: 39194816 Free PMC article. Review.
References
-
- Yun J.H., Roh S.W., Whon T.W., Jung M.J., Kim M.S., Park D.S., Yoon C., Nam Y.D., Kim Y.J., Choi J.H., et al. Insect gut bacterial diversity determined by environmental habitat, diet, developmental stage, and phylogeny of host. Appl. Environ. Microbiol. 2014;80:5254–5264. doi: 10.1128/AEM.01226-14. - DOI - PMC - PubMed
-
- Shi W., Ding S.-Y., Yuan J.S. Comparison of insect gut cellulase and xylanase activity across different insect species with distinct food sources. BioEnergy Res. 2010;4:1–10. doi: 10.1007/s12155-010-9096-0. - DOI
Grants and funding
LinkOut - more resources
Full Text Sources
