Review
. 2022 Aug 15;9(8):268.
doi: 10.3390/jcdd9080268.

Vascular Implications of COVID-19: Role of Radiological Imaging, Artificial Intelligence, and Tissue Characterization: A Special Report

Affiliations
Review

Vascular Implications of COVID-19: Role of Radiological Imaging, Artificial Intelligence, and Tissue Characterization: A Special Report

Narendra N Khanna et al. J Cardiovasc Dev Dis. .

Abstract

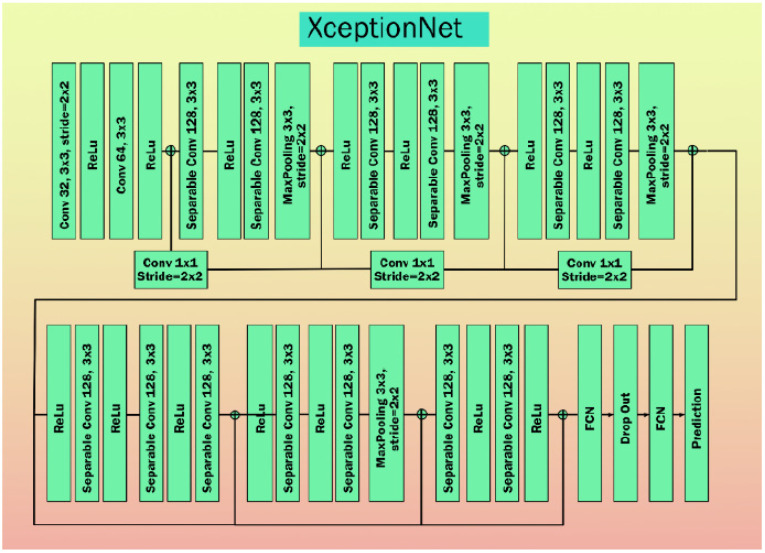
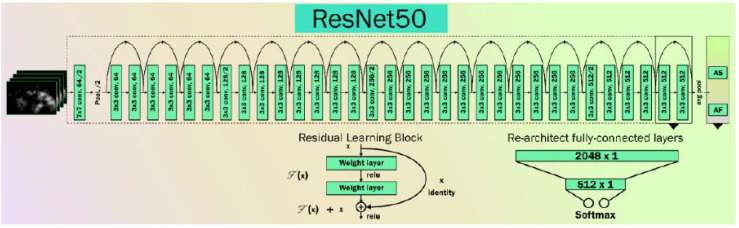
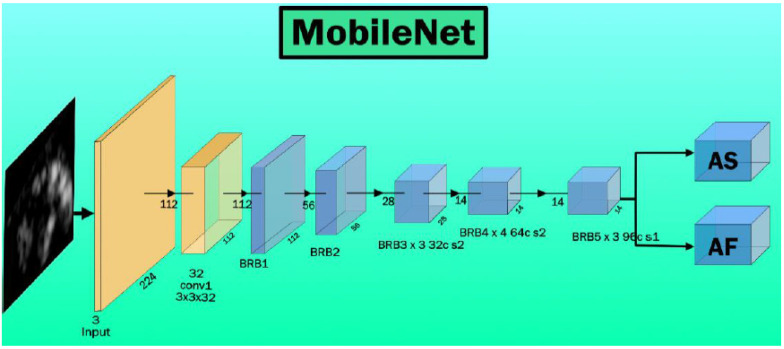
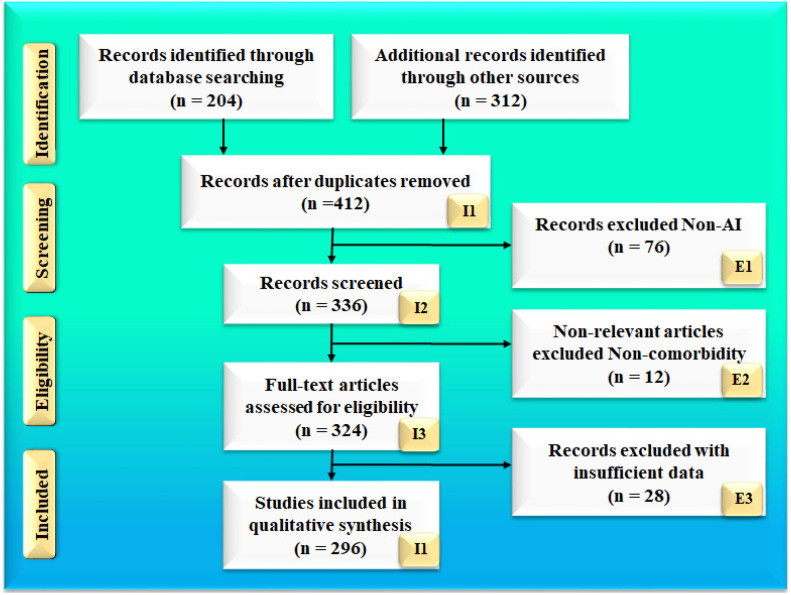
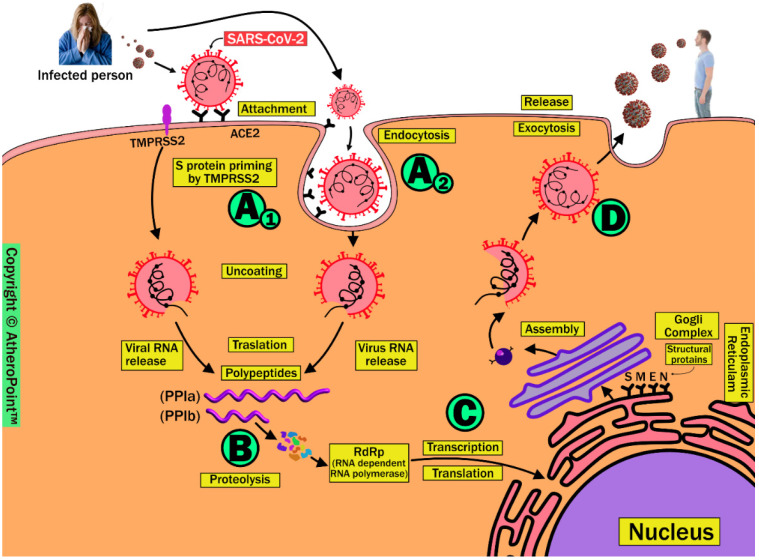
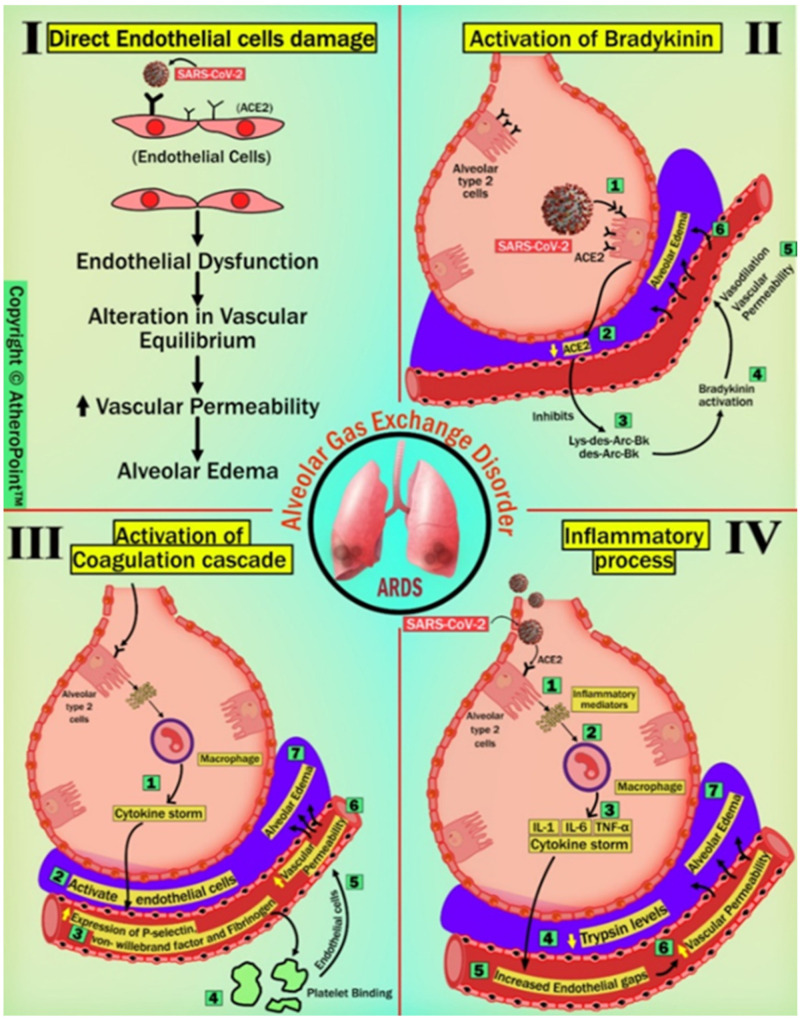
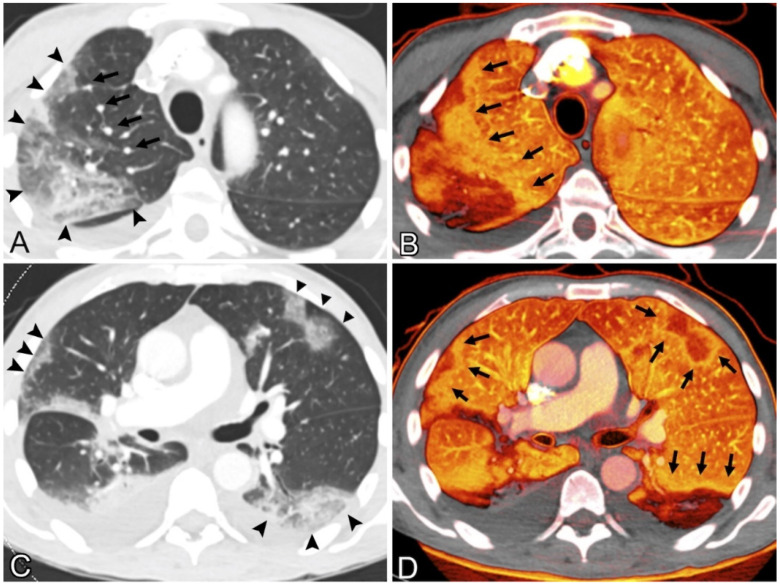
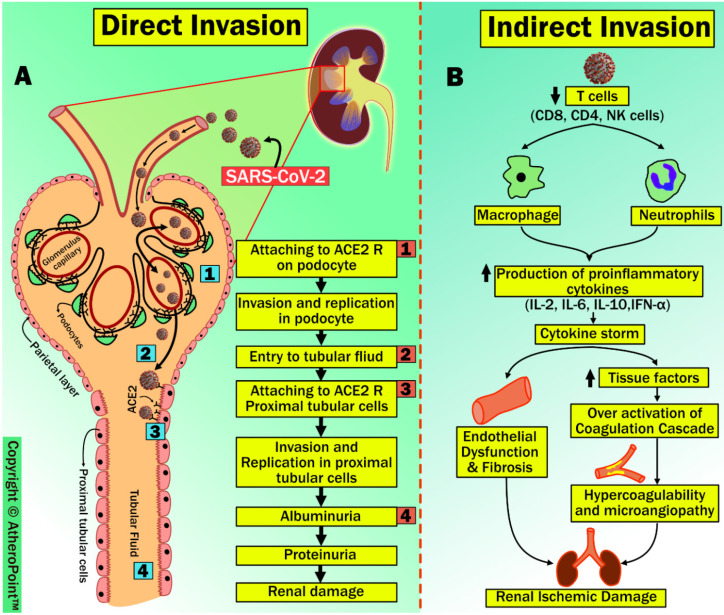
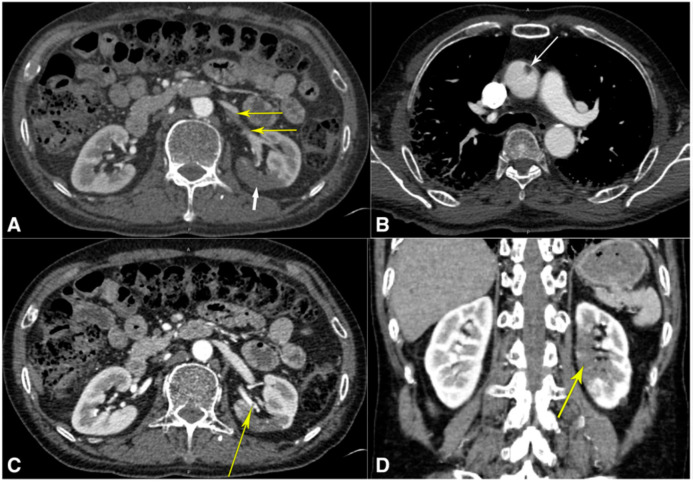
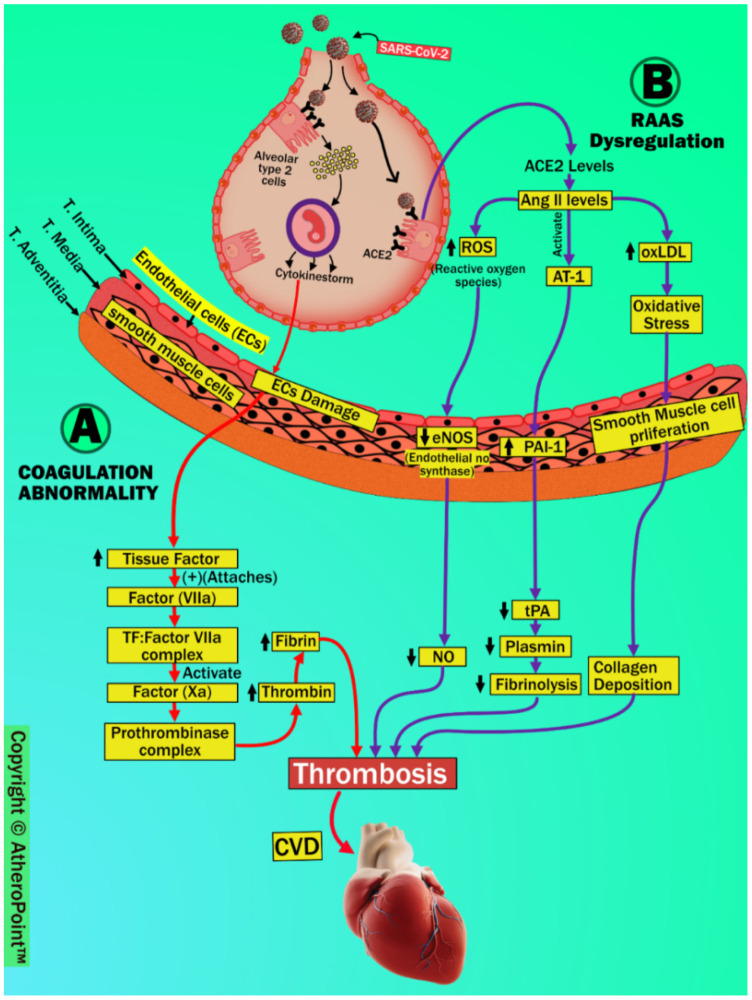
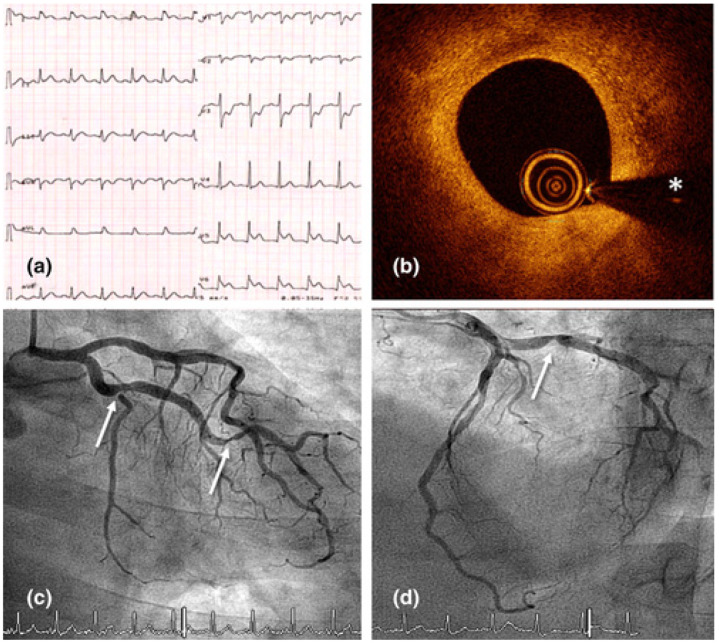
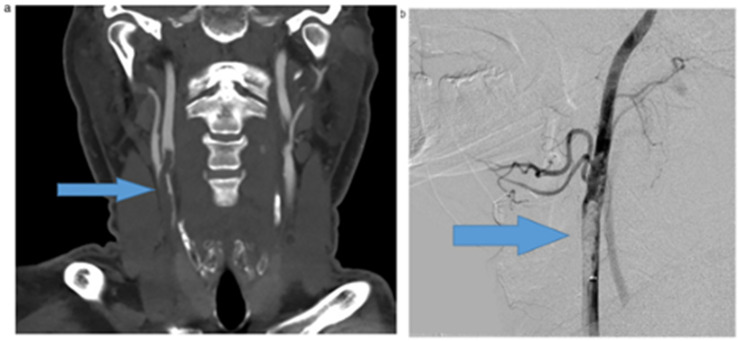
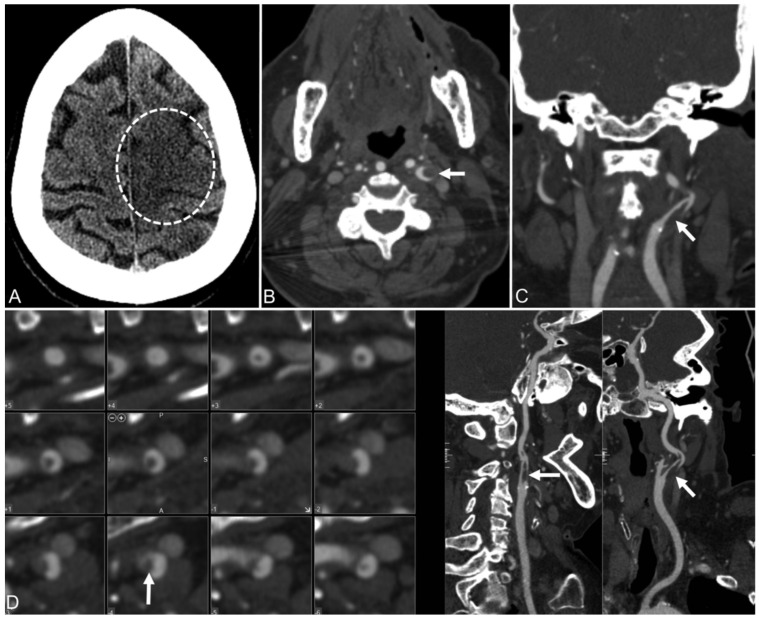
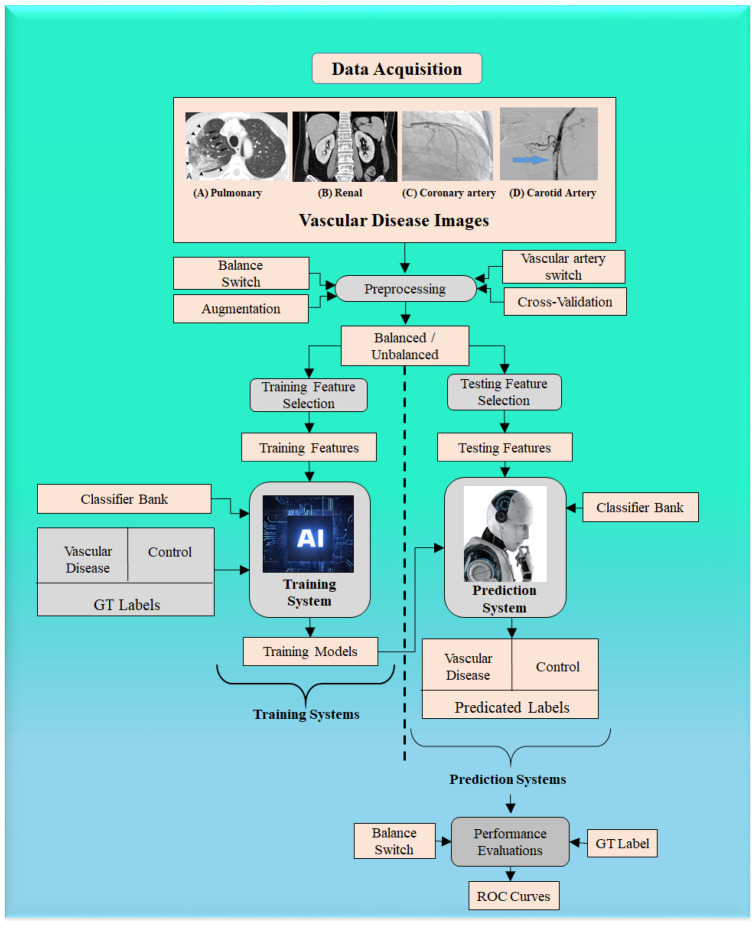
The SARS-CoV-2 virus has caused a pandemic, infecting nearly 80 million people worldwide, with mortality exceeding six million. The average survival span is just 14 days from the time the symptoms become aggressive. The present study delineates the deep-driven vascular damage in the pulmonary, renal, coronary, and carotid vessels due to SARS-CoV-2. This special report addresses an important gap in the literature in understanding (i) the pathophysiology of vascular damage and the role of medical imaging in the visualization of the damage caused by SARS-CoV-2, and (ii) further understanding the severity of COVID-19 using artificial intelligence (AI)-based tissue characterization (TC). PRISMA was used to select 296 studies for AI-based TC. Radiological imaging techniques such as magnetic resonance imaging (MRI), computed tomography (CT), and ultrasound were selected for imaging of the vasculature infected by COVID-19. Four kinds of hypotheses are presented for showing the vascular damage in radiological images due to COVID-19. Three kinds of AI models, namely, machine learning, deep learning, and transfer learning, are used for TC. Further, the study presents recommendations for improving AI-based architectures for vascular studies. We conclude that the process of vascular damage due to COVID-19 has similarities across vessel types, even though it results in multi-organ dysfunction. Although the mortality rate is ~2% of those infected, the long-term effect of COVID-19 needs monitoring to avoid deaths. AI seems to be penetrating the health care industry at warp speed, and we expect to see an emerging role in patient care, reduce the mortality and morbidity rate.

Keywords: COVID-19; artificial intelligence; carotid; coronary; coronavirus; pulmonary; renal; vascular damage.


Conflict of interest statement

The authors declare no conflict of interest.

Figures

Figure 21
Figure 21
The inception of the left and right carotid arteries [271].
Figure A1
Figure A1
Stages of acute respiratory distress syndrome formation [296]. A: virus entry: Lung infection, C Alveoli complication, D: SARS-CoV-2 entry, 1: ACE2 binding, 2: Inflammatory mediators, 3: Alveolar Macrophage, 4a: cytokine storm, 4b: Polymorphic Neutrophils, 5: Diffuse exudate, 6: Platelets, 7:Fibrin clot, 8: Endothelial wall damage 9: Alveolar Edema, 10:Alveolar Collapse, 11: Alveolar gas exchange disorder, 12:ARDS.
Figure A2
Figure A2
The general structure of Densenet architecture (courtesy of AtheroPoint™, Roseville, CA, USA) [44].
Figure A3
Figure A3
The general structure of the InceptionV3 architecture [44].
Figure A4
Figure A4
The general structure of XceptionNet architecture [44].
Figure A5
Figure A5
The general structure of Resnet50 architecture [44].
Figure A6
Figure A6
MobileNet Architecture, BRB: bottleneck and residual blocks [44].
Figure 1
Figure 1
Research article search strategy; I: included, E: excluded, n: number of studies.
Figure 2
Figure 2
Replication of SARS-CoV-2 in four phases. (Original image, AtheroPoint™ LLC, Roseville, CA, USA).
Figure 3
Figure 3
Detailed pathways of endothelial cell (EC) damage after COVID-19 infection contributing to the initiation of ARDS development. (Original image, AtheroPoint™ LLC, Roseville, CA, USA).
Figure 4
Figure 4
Scanning electron micrographs of (A) microvascular corrosion casts from the thin-walled alveolar plexus of a healthy lung and (B) the considerable architectural deformation seen in lungs harmed by COVID-19. In (B), the disappearance of a vascular hierarchy that was visible in the alveolar plexus is attributed to the development of new blood vessels via intussusceptive angiogenesis. (C) The intussusceptive pillar localizations at higher magnification, indicated by the arrowheads. (D) Transmission electron micrograph demonstrating ultrastructural aspects of the breakdown of endothelial cells and the presence of SARS-CoV-2 within the cell membrane (arrowheads). The scale bar corresponds to 5 micrometers. RC stands for red cells [77].
Figure 5
Figure 5
This figure shows findings related to pathology. (A) Gross pathological specimen of the thrombus that was obstructing both of the patient’s pulmonary arteries. The specimen is an uneven piece of hemorrhagic tissue that is reddish-tan and measures approximately 1.3 cm in diameter. (B) An intravascular thrombus of a major vessel can be seen in the light microscopy image of the lung tissue segment (arrow). (C) Inflammatory cells can be seen in the pulmonary interstitium (shown by the arrows) and in the alveolar space of the lung parenchyma. (D) There is evidence of widespread interstitial fibrosis in the lungs (arrow). Diffusely prevalent in the alveolar septa and around the arteries are a substantial number of CD4+ T cells (E) and CD68+ macrophages (F) (arrows). Bars on the scale read as follows: (A) = 1 cm; (B) = 100 m; (CF) = 50 m [80].
Figure 6
Figure 6
(A) 69-year-old man with fever, weakness, and chills had coronavirus illness. The patient was hospitalized for acute intermittent tachycardia, desaturation, and shortness of breath. No pulmonary emboli were found. Contrast-enhanced CT pulmonary angiography of the upper lungs at lung windows showed ground-glass opacity and consolidation in the right upper lobe (arrowheads); sub-segmental arteries within the opacities were dilated, and right upper lobe vessels proximal to the opacity were similarly dilated (arrows). (B) Pulmonary blood volume (PBV) imaging at the same level shows a significant peripheral perfusion deficiency with a surrounding halo of enhanced perfusion (arrows). Heterogeneous left upper lobe perfusion. CT scan of the patient’s lower lungs showed peripheral ground-glass opacities and consolidation with a round or wedge-shaped appearance (arrowheads). (D) PBV picture shows perfusion deficiencies matching the opacities in (C), shown with enlarged perfusion halos (arrows) [82] (2020).
Figure 7
Figure 7
Renal vascular damage due to COVID-19 through direct and indirect invasion. (Original image, AtheroPoint™ LLC, Roseville, CA, USA) (A): Direct Invasion, (B): Indirect Invasion.
Figure 8
Figure 8
Tomography computed using angiography: (A) abdominal computed tomography angiography (CTA), demonstrating thrombi in the left superior renal artery (thin yellow arrows) and infarcts in the posterior mid-pole of the left kidney (thick white arrow); (B) CTA of the thorax, demonstrating ascending aortic thrombus (arrow); (C) abdominal CTA displaying a different perspective of the left superior renal artery thrombus (yellow arrow); (D) computed tomography abdominal angiography in coronal projection, demonstrating the extent of the left renal infarction (yellow arrow). This image is presented in color at www.ajmh.org (accessed on 28 March 2020). Mukherjee et al. [121].
Figure 9
Figure 9
COVID-19-induced cardiovascular implications. (Original image, AtheroPoint™ LLC, Roseville, CA, USA) (A): Coagulation Abnormality, (B): RAAS Dysregulation.
Figure 10
Figure 10
(a) An electrocardiogram shows inferolateral ST-segment elevation and specular decline in right precordial leads during a chest pain episode; (b) an intracoronary OCT image of the proximal left circumflex coronary artery (LCX) shows a stable fibrous plaque with a minimal lumen area. Erosion or rupture as an ACS cause was ruled out (asterisk denotes wire artifact). (c,d) Urgent coronary angiography demonstrating proximal and distal LCX lesions [144].
Figure 11
Figure 11
A significant amount of thrombus in the carotid artery. A man in his 50s who went to the doctor complaining of weakness in his left wrist was found to have positive serology for COVID-19. A significant subocclusive thrombosis of the right common carotid artery that extended into the internal and external carotid arteries was seen on the head and neck (a) CT angiography (arrows). The CT perfusion analysis revealed an acute infarct in the right superior frontal lobe as well as a wide area of elevated Tmax in the right cerebral hemisphere which involved both the right frontal and parietal lobes, indicating an area that may be at risk for additional infarction (box). (b) Immediately afterwards, endovascular chemical thrombolysis of the right carotid artery was carried out [144].
Figure 12
Figure 12
Patient 2. (A) 78-year-old woman with COVID-19 and an NIHSS score of 25.The CT of the head without comparison shows an evolving ischemic infarct in the left frontal brain paracentral cortex (dotted circle) and a smaller infarct in the left parietal cortex. (BD), Axial, coronal, and curved reimaged images from CT angiography of the head and neck show an irregular plaque at the left internal carotid artery bifurcation and a capillary filling defect (arrow) extending superiorly in the left internal carotid artery, which matches the ruptured plaque with clot formation [144].
Figure 13
Figure 13
Machine learning model to predict vascular disease.
Figure 14
Figure 14
(a) DL-CNN model for characterization, (b) DL-FCN model for segmentation [44].
Figure 15
Figure 15
Deep learning model to predict vascular disease using AIbTC [44].
Figure 16
Figure 16
The general structure of CNN architecture (courtesy of AtheroPoint™, Roseville, CA, USA) [206,208].
Figure 17
Figure 17
Carotid plaque with bilateral intraparenchymal hemorrhage [218]. (Carotid plaque right side, (A): 3D view, (B): top view, (C): side view, Carotid plaque left side (D): 3D view, (E): top view, (F): side view.)
Figure 18
Figure 18
Delineated plaque in B-mode US: (a) symptomatic plaque and (b) asymptomatic plaque (Courtesy of AtheropointTM, Roseville, CA, USA) [44].
Figure 19
Figure 19
Different plaque components depicted in pathological pictures: (A) healthy wall, (B) neovessels, (C) calcified plaque, and (D) interplaque hemorrhage (courtesy of Dr. Luca Saba, U of Cagliari, Italy) [222].
Figure 20
Figure 20
Transfer learning model to predict vascular disease [44].

Similar articles

Cited by

References

    1. Khoshnood R.J., Zali A., Tafreshinejad A., Ghajarzadeh M., Ebrahimi N., Safari S., Mirmosayyeb O. Parkinson’s disease and COVID-19: A systematic review and meta-analysis. Neurol. Sci. 2021;43:775–783. doi: 10.1007/s10072-021-05756-4. - DOI - PMC - PubMed
    1. Helmich R.C., Bloem B.R. The impact of the COVID-19 pandemic on Parkinson’s disease: Hidden sorrows and emerging opportunities. J. Park. Dis. 2020;10:351. doi: 10.3233/JPD-202038. - DOI - PMC - PubMed
    1. Baschi R., Luca A., Nicoletti A., Caccamo M., Cicero C.E., D’Agate C., Di Giorgi L., La Bianca G., Lo Castro T., Zappia M. Changes in motor, cognitive, and behavioral symptoms in Parkinson’s disease and mild cognitive impairment during the COVID-19 lockdown. Front. Psychiatry. 2020;11:590134. doi: 10.3389/fpsyt.2020.590134. - DOI - PMC - PubMed
    1. Wang D., Hu B., Hu C., Zhu F., Liu X., Zhang J., Wang B., Xiang H., Cheng Z., Xiong Y. Clinical characteristics of 138 hospitalized patients with 2019 novel coronavirus–infected pneumonia in Wuhan, China. JAMA. 2020;323:1061–1069. doi: 10.1001/jama.2020.1585. - DOI - PMC - PubMed
    1. Suri J.S., Puvvula A., Biswas M., Majhail M., Saba L., Faa G., Singh I.M., Oberleitner R., Turk M., Chadha P.S. COVID-19 pathways for brain and heart injury in comorbidity patients: A role of medical imaging and artificial intelligence-based COVID severity classification: A review. Comput. Biol. Med. 2020;124:103960. doi: 10.1016/j.compbiomed.2020.103960. - DOI - PMC - PubMed

LinkOut - more resources