

Preventive and Therapeutic Effects of Krill Oil on Obesity and Obesity-Induced Metabolic Syndromes in High-Fat Diet-Fed Mice
- PMID: 36005486
- PMCID: PMC9410137
- DOI: 10.3390/md20080483
Preventive and Therapeutic Effects of Krill Oil on Obesity and Obesity-Induced Metabolic Syndromes in High-Fat Diet-Fed Mice
Abstract
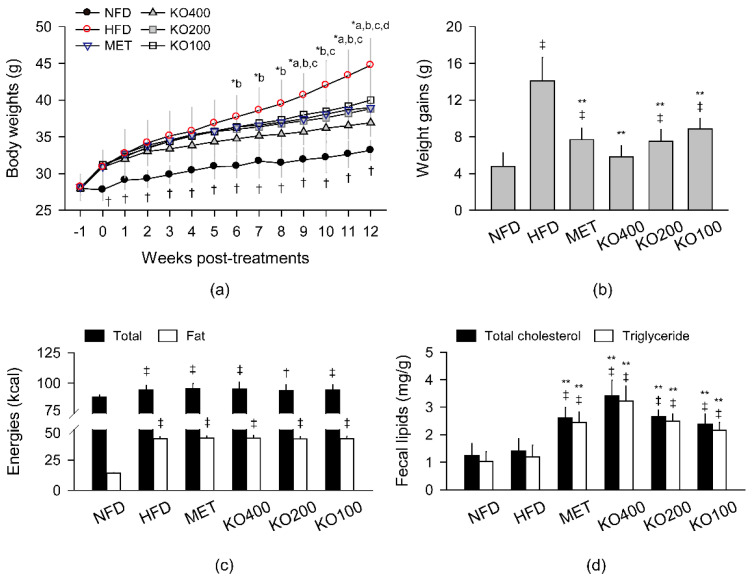
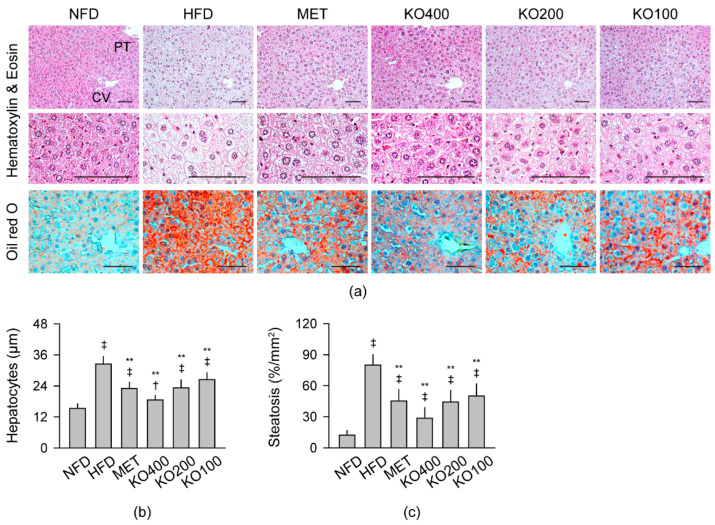
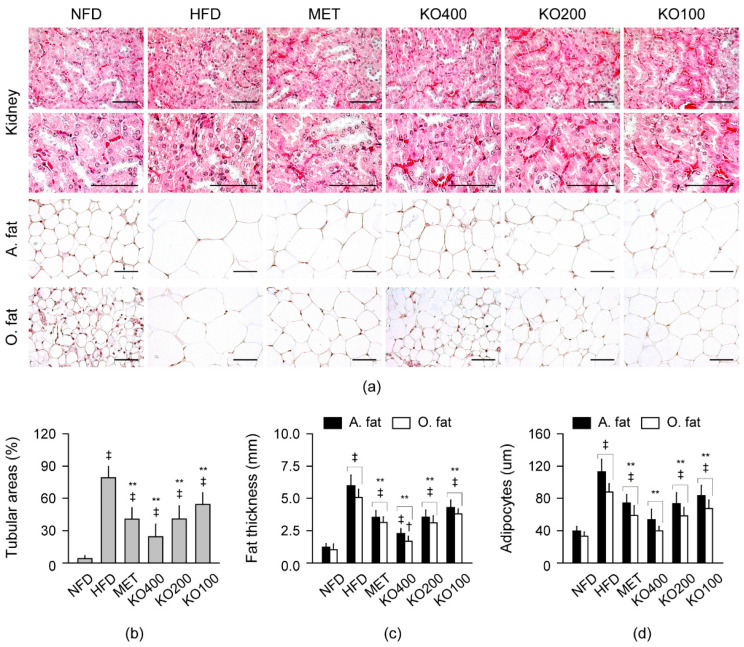
Obesity increases the risks of metabolic syndromes including nonalcoholic fatty liver disease (NAFLD), diabetic dyslipidemia, and chronic kidney disease. Dietary krill oil (KO) has shown antioxidant and anti-inflammatory properties, thereby being a therapeutic potential for obesity-induced metabolic syndromes. Thus, the effects of KO on lipid metabolic alteration were examined in a high-fat diet (HFD)-fed mice model. The HFD model (n = 10 per group) received an oral gavage with distilled water as a control, metformin at 250 mg/kg, and KO at 400, 200, and 100 mg/kg for 12 weeks. The HFD-induced weight gain and fat deposition were significantly reduced in the KO treatments compared with the control. Blood levels were lower in parameters for NAFLD (e.g., alanine aminotransferase, and triglyceride), type 2 diabetes (e.g., glucose and insulin), and renal dysfunction (e.g., blood urea nitrogen and creatinine) by the KO treatments. The KO inhibited lipid synthesis through the modification of gene expressions in the liver and adipose tissues and adipokine-mediated pathways. Furthermore, KO showed hepatic antioxidant activities and glucose lowering effects. Histopathological analyses revealed that the KO ameliorated the hepatic steatosis, pancreatic endocrine/exocrine alteration, adipose tissue hypertrophy, and renal steatosis. These analyses suggest that KO may be promising for inhibiting obesity and metabolic syndromes.
Keywords: HFD; NAFLD; PUFA; T2D; diabetes; dyslipidemia; marine; metformin; obesity; steatosis.
Conflict of interest statement
The authors declare no conflict of interest.
Figures


Similar articles
-
Efficacy of Sitagliptin on Nonalcoholic Fatty Liver Disease in High-fat-diet-fed Diabetic Mice.Curr Med Sci. 2022 Jun;42(3):513-519. doi: 10.1007/s11596-022-2573-9. Epub 2022 Apr 22. Curr Med Sci. 2022. PMID: 35451807
-
Effects of Antarctic krill oil on lipid and glucose metabolism in C57BL/6J mice fed with high fat diet.Lipids Health Dis. 2017 Nov 21;16(1):218. doi: 10.1186/s12944-017-0601-8. Lipids Health Dis. 2017. PMID: 29157255 Free PMC article.
-
Combination Effects of Metformin and a Mixture of Lemon Balm and Dandelion on High-Fat Diet-Induced Metabolic Alterations in Mice.Antioxidants (Basel). 2022 Mar 18;11(3):580. doi: 10.3390/antiox11030580. Antioxidants (Basel). 2022. PMID: 35326230 Free PMC article.
-
Effects of Sesamin in Animal Models of Obesity-Associated Diseases: A Systematic Review and Meta-Analysis.Nutr Rev. 2025 Mar 1;83(3):e838-e851. doi: 10.1093/nutrit/nuae089. Nutr Rev. 2025. PMID: 39074164
-
Potential Therapeutic Exploitation of G Protein-Coupled Receptor 120 (GPR120/FFAR4) Signaling in Obesity-Related Metabolic Disorders.Int J Mol Sci. 2025 Mar 11;26(6):2501. doi: 10.3390/ijms26062501. Int J Mol Sci. 2025. PMID: 40141148 Free PMC article. Review.
Cited by
-
Local Application of Krill Oil Accelerates the Healing of Artificially Created Wounds in Diabetic Mice.Nutrients. 2022 Oct 5;14(19):4139. doi: 10.3390/nu14194139. Nutrients. 2022. PMID: 36235791 Free PMC article.
-
Association Between Atherogenic, Thrombogenic, and Lipophilic Indices and the Odds of Diabetic Nephropathy in Type 2 Diabetic Patients: A Case-Control Study.Food Sci Nutr. 2025 Mar 4;13(3):e4686. doi: 10.1002/fsn3.4686. eCollection 2025 Mar. Food Sci Nutr. 2025. PMID: 40041714 Free PMC article.
-
Health promoting benefits of krill oil: mechanisms, bioactive combinations, and advanced encapsulation technologies.Food Sci Biotechnol. 2024 Nov 15;34(6):1285-1308. doi: 10.1007/s10068-024-01737-3. eCollection 2025 Apr. Food Sci Biotechnol. 2024. PMID: 40110398 Review.
-
The use of three-dimensional primary human myospheres to explore skeletal muscle effects of in vivo krill oil supplementation.In Vitro Model. 2025 Apr 30;4(2):145-155. doi: 10.1007/s44164-025-00087-6. eCollection 2025 Aug. In Vitro Model. 2025. PMID: 40708816 Free PMC article.
-
Anti-Osteoarthritic Effects of Antarctic Krill Oil in Primary Chondrocytes and a Surgical Rat Model of Knee Osteoarthritis.Mar Drugs. 2023 Sep 28;21(10):513. doi: 10.3390/md21100513. Mar Drugs. 2023. PMID: 37888448 Free PMC article.
References
-
- World Health Organization Obesity and Overweight Fact Sheet. [(accessed on 9 June 2021)]. Available online: https://www.who.int/news-room/fact-sheets/detail/obesity-and-overweight.
-
- Hernandez E.A., Kahl S., Seelig A., Begovatz P., Irmler M., Kupriyanova Y., Nowotny B., Nowotny P., Herder C., Barosa C., et al. Acute dietary fat intake initiates alterations in energy metabolism and insulin resistance. J. Clin. Investig. 2017;127:695–708. doi: 10.1172/JCI89444. - DOI - PMC - PubMed
MeSH terms
Substances
Grants and funding
LinkOut - more resources
Full Text Sources
Medical
Research Materials
