. 2023 May 1;108(5):1359-1373.
doi: 10.3324/haematol.2021.280320.

ASXL1 mutations accelerate bone marrow fibrosis via EGR1-TNFA axis-mediated neoplastic fibrocyte generation in myeloproliferative neoplasms

Affiliations

ASXL1 mutations accelerate bone marrow fibrosis via EGR1-TNFA axis-mediated neoplastic fibrocyte generation in myeloproliferative neoplasms

Zhongxun Shi et al. Haematologica. .

Abstract

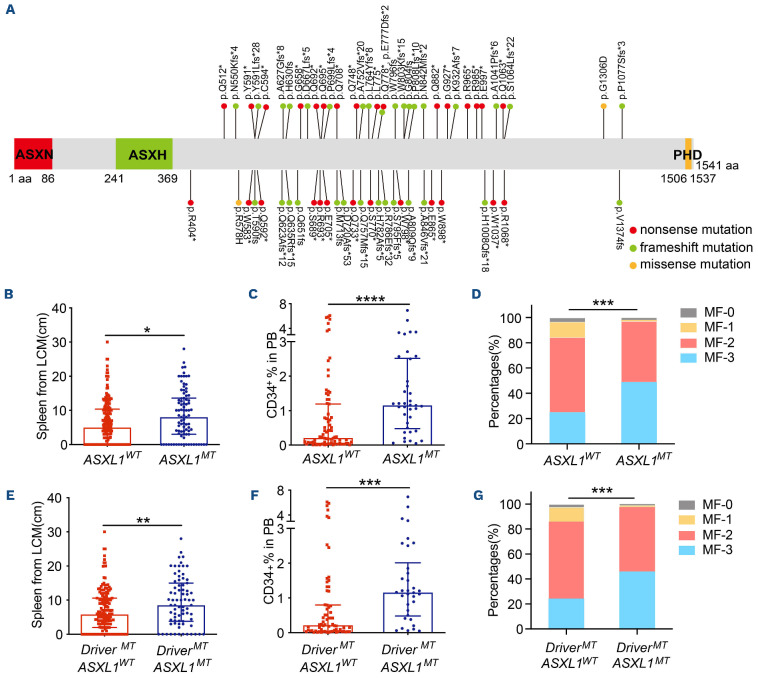
Apart from the central role of the activated JAK/STAT signaling pathway, ASXL1 mutations are the most recurrent additional mutations in myeloproliferative neoplasms and occur much more commonly in myelofibrosis than in essential thrombocythemia and polycythemia vera. However, the mechanism of the association with ASXL1 mutations and bone marrow fibrosis remains unknown. Here, integrating our own data from patients with myeloproliferative neoplasms and a hematopoietic-specific Asxl1 deletion/Jak2V617F mouse model, we show that ASXL1 mutations are associated with advanced myeloproliferative neoplasm phenotypes and onset of myelofibrosis. ASXL1 mutations induce skewed monocyte/macrophage and neoplastic monocyte-derived fibrocyte differentiation, consequently they enhance inflammation and bone marrow fibrosis. Consistently, the loss of ASXL1 and JAK2V617F mutations in hematopoietic stem and progenitor cells leads to enhanced activation of polycomb group target genes, such as EGR1. The upregulation of EGR1, in turn, accounts for increased hematopoietic stem and progenitor cell commitment to the monocyte/macrophage lineage. Moreover, EGR1 induces the activation of TNFA and thereby further drives the differentiation of monocytes to fibrocytes. Accordingly, combined treatment with a TNFR antagonist and ruxolitinib significantly reduces fibrocyte production in vitro. Altogether, these findings demonstrate that ASXL1 mutations accelerate fibrocyte production and inflammation in myeloproliferative neoplasms via the EGR1-TNFA axis, explaining the cellular and molecular basis for bone marrow fibrosis and the proof-ofconcept for anti-fibrosis treatment.


Figures

Figure 1.
Figure 1.
ASXL1 mutations are associated with severe disease phenotypes in myelofibrosis patients. (A) Landscape of localizations and mutational types of 98 ASXL1 mutations in 302 patients with myelofibrosis (MF). (B-D) Spleen sizes (B) (N=87 for ASXL1MT patients and n=196 for ASXL1WT patients), proportions of CD34+ cells in peripheral blood (PB) (C) (N=38 for ASXL1MT patients and N=79 for ASXL1WT patients), and MF grades (D) (N=98 for ASXL1MT patients and N=204 for ASXL1WTpatients) of MF patients with different ASXL1 mutational status. (E-G) Spleen sizes (E) (N=75 for DriverMTASXL1MT patients and N=157 for DriverMTASXL1WT patients), proportions of CD34+ cells in PB (F) (N=34 for DriverMTASXL1MT patients and N=68 for DriverMTASXL1WT patients) and MF grades (G) (N=85 for DriverMTASXL1MT patients and N=165 for DriverMTASXL1WT patients) of driverMT MF patients with different ASXL1 mutational status. ASXN: additional sex combs N-terminus domain; ASXH: additional sex combs homology domain; PHD: plant homeodomain. LCM: left costal margin. In (B), (C), (E) and (F), the results are presented as the median ± interquartile range. A Mann-Whitney U test was performed between the medians of two groups. In (D) and (G), the results are presented as percentages. A Mann-Whitney U test was performed between ordinal variables. *P<0.05, **P<0.01, ***P<0.001, ****P<0.0001.
Figure 2.
Figure 2.
Asxl1 deletion is associated with enhanced extramedullary hematopoiesis in Asxl1-/-Jak2VF mice. (A) Hemoglobin, white blood cell, neutrophil, lymphocyte, monocyte, and platelet counts in peripheral blood (PB) were assessed at 12 weeks of age in Asxl1-/-Jak2VF, Jak2VF, Asxl1-/- and WT mice (N=13–15 per group). (B) Representative flow cytometric plots (upper) and the proportions (lower) of c-kit+ cells in PB of Asxl1-/-Jak2VF, Jak2VF, Asxl1-/- and WT mice at 14-16 weeks of age (N=8–9 per group). (C, D) The proportions of LSK cells (Lin-Sca-1+c-kit+), granulocyte/macrophage progenitors (Lin-Sca-1-c-kit+CD34+FcγRII/IIIhigh), common myeloid progenitors (Lin-Sca-1-c-kit+CD34+FcγRII/IIIlow) and megakaryocyte-erythroid progenitors (Lin-Sca-1-c-kit+CD34-FcγRII/III-) in bone marrow (C) and spleens (D) from Asxl1-/-Jak2VF, Jak2VF, Asxl1-/- and WT mice at 14-16 weeks of age (N=8-9 per group). (E) Representative images (upper) and the weights (lower) of spleens from Asxl1-/-Jak2VF, Jak2VF, Asxl1-/- and WT mice at 14-16 weeks of age (N=11-15 per group). In (A–E), the results are presented as mean ± standard error of the mean. A two-tailed unpaired Student t test was performed between means of two groups. ns, not significant, *P<0.05, **P<0.01, ***P<0.001, ****P<0.0001. Hb: hemoglobin; WBC: white blood cells; NEUT: neutrophils; LYM: lymphocytes; MONO: monocytes; PLT: platelets; GMP: granulocyte/macrophage progenitors; CMP: common myeloid progenitors; MEP: megakyocyte-erythroid progenitors; SSC: side scatter; BM: bone marrow.
Figure 3.
Figure 3.
Morphology of enhanced extramedullary hematopoiesis and myelofibrosis in Asxl1-/-Jak2VF mice. Representative images of hematoxylin and eosin (H&E), Reticulin and Masson trichrome staining in femur and representative images of H&E staining in spleen biopsy specimens from Asxl1-/-Jak2VF, Jak2VF, Asxl1-/- and WT mice at 16 weeks of age. Asxl1-/-Jak2VF and Jak2VF mice showed increased megakaryocytes and atypia in bone marrow and spleen specimens (arrow). Original magnification 40×, scale bar, 50 mm. BM: bone marrow.
Figure 4.
Figure 4.
ASXL1MT myelofibrosis patients and Asxl1-/-Jak2VF mice have increased inflammatory monocytes/macrophages. (A) The proportions of monocyte-derived dendritic cells (CD11cintCD11bhighMHC II+Ly6C+) in peripheral blood of Asxl1-/-Jak2VF, Jak2VF, Asxl1-/- and WT mice at 14-16 weeks of age (N=4-6 per group). (B, C) The proportions of monocytes (CD11b+CD115+) in bone marrow (B) and spleens (C) of Asxl1-/-Jak2VF, Jak2VF, Asxl1-/- and WT mice at 14-16 weeks of age (N=6-7 per group). (D) Representative flow cytometric plots (left) and the proportions of total macrophages (Gr-1-CD115intF4/80+SSClow) (middle) and M1(CD80+CD206-)/M2 (CD80-CD206+) subtypes (right) in bone marrow of Asxl1-/-Jak2VF, Jak2VF, Asxl1-/- and WT mice at 14-16 weeks of age (N=7-9 per group). (E) Representative flow cytometric plots (left) and the proportions of total macrophages (Gr-1-CD115intF4/80+SSClow) (middle) and M1(CD80+CD206-)/M2 (CD80-CD206+) subtypes (right) in spleens of Asxl1-/-Jak2VF, Jak2VF, Asxl1-/- and WT mice at 14-16 weeks of age (N=7-9 per group). In (A–E), the results are presented as mean ± standard error of mean. A two-tailed unpaired Student t test was performed between means of two groups. ns: not significant, *P<0.05, **P<0.01, ***P<0.001, ****P<0.0001. PB: peripheral blood; moDC: monocyte-derived dendritic cells; BM: bone marrow; SSC: side scatter; FSC: forward scatter.
Figure 5.
Figure 5.
Increased monocyte-derived fibrocytes in both ASXL1MT myelofibrosis patients and Asxl1-/-Jak2VF mice. (A) Representative immunofluorescence imaging of fibrocytes (ProCol-I+CD45+) in bone marrow (BM) specimens from patients with myelofibrosis (MF). Original magnification 60×; scale bar, 10 mm. (B) The number of fibrocytes in BM specimens of ASXL1WT and ASXL1MT MF patients (N=8 for ASXL1WT patients and N=8 for ASXL1MT patients, median= 20.5 cells/10 high power field [HPF] for ASXL1WT patients and 74.0 cells/10 HPF for ASXL1MT patients). (C) Representative immunofluorescence images of fibrocytes (ColI+CD45+) from BM nucleated cells of 14-week-old Asxl1-/-Jak2VF, Jak2VF, Asxl1-/- and WT mice cultured in conditions that promote differentiation to fibrocytes. Left: original magnification 20×; scale bar, 40 mm; right: original magnification 60×; scale bar, 10 mm. (D) The numbers of fibrocytes derived from Asxl1-/-Jak2VF, Jak2VF, Asxl1-/- and WT BM nucleated cells cultured for 5 days (N=3-4 per group). (E, F) The proportions of fibrocytes in BM (E) and spleens (F) of Asxl1-/-Jak2VF, Jak2VF, Asxl1-/- and WT mice at 14-16 weeks of age determined using flow cytometry (N=5-6 per group). In (B), the results are presented as median ± interquartile range. A Mann-Whitney U test was performed between medians of two groups. In (D-F), the results are presented as mean ± standard error of mean. A two-tailed unpaired Student t test was performed between means of two groups. *P<0.05, **P<0.01, ***P<0.001, ****P<0.0001.
Figure 6.
Figure 6.
Asxl1 deletion results in derepression of polycomb group target genes in Asxl1-/-Jak2VF bone marrow c-kit+ cells. (A) Principal component analysis plot showing the gene-expression profile of bone marrow (BM) c-kit+ cells from Asxl1-/-Jak2VF and Jak2VF mice. Each dot represents an independent biological sample. (B) Heatmap showing significantly upregulated and downregulated genes in Asxl1-/-Jak2VF BM c-kit+ cells compared with Jak2VF BM c-kit+ cells (fold change >2, P<0.05). (C) Gene set enrichment analysis (GSEA) showed that polycomb group (PcG) target genes were significantly depressed in Asxl1-/-Jak2VF BM c-kit+ cells when compared to Jak2VF BM c-kit+ cells. PcG target genes were defined by the 4,700 regions co-occupied by H3K27me3 and H2AK119ub1 from ChIP-sequencing data of Asxl1-/-Jak2VF and Jak2VF BM c-kit+ cells. (D) Representative enriched PcG target genes in Asxl1-/-Jak2VF BM c-kit+ cells in GSEA. (E) Metaplots and heatmaps of ATAC sequencing, and H3K4me1 and H3K27ac ChIP sequencing at upregulated genes in Asxl1-/-Jak2VF BM c-kit+ cells and Jak2VF BM c-kit+ cells. (F) Snapshot of the genomic view for H3K4me1 and H3K27ac ChIP sequencing, ATAC sequencing and RNA sequencing at the representative PcG target gene Jun and Egr1 loci. ATAC: assay for transposase-accessible chromatin; Chip: chromatin immunoprecipitation.
Figure 7.
Figure 7.
Activated EGR1 enhances monocyte/macrophage differentiation in Asxl1-/-Jak2VF mice. (A-C) Venn diagram (A), KEGG pathway enrichment analysis (B), and heatmap (C) of upregulated genes in Asxl1-/-Jak2VF compared with Jak2VF, Asxl1-/- and WT BM c-kit+ cells (fold change >2, P<0.05). (D) Relative expressions of Fos, Ccl4, Egr1 and Cxcl2 mRNA were measured in Asxl1-/-Jak2VF, Jak2VF, Asxl1-/- and WT bone marrow (BM) c-kit+ cells by real-time quantitative polymerase chain reaction (RT-qPCR) and normalized with one sample of Jak2VF mice (N=3-4 per group). (E) Relative expressions of EGR1 mRNA in BM mononuclear cells from polycythemia vera (PV), ASXL1MT and ASXL1WT myelofibrosis patients measured by RT-qPCR and normalized with one sample of PV patients (N=13 per group). (F) Representative flow cytometric plots (left) and the proportions (middle) of F4/80+ cells and photomicrographs of Wright-Giemsa-stained cytospin smears (right) obtained from colonies generated by Asxl1-/-Jak2VF BM c-kit+ cells transduced with either empty vector or Egr1 short hairpin RNA (N=3 independent experiments). In (D-F), the results are presented as mean ± standard error of mean. A two-tailed unpaired Student t test was performed between means of two groups. ns, not significant, *P<0.05, **P<0.01, ***P<0.001, ****P<0.0001. MF: myelofibrosis; SSC: side scatter; EV: empty vector; shRNA: short hairpin RNA.
Figure 8.
Figure 8.
TNF-a promotes monocyte-derived fibrocyte differentiation in Asxl1-/-Jak2VF mice. (A) Relative expressions of Egr1 and Tnfa mRNA in Asxl1-/-Jak2VF bone marrow (BM) c-kit+ cells infected with either empty vector or Egr1 shRNA (3 independent experiments). (B) Representative immunofluorescence imaging (left) and numbers (right) of cultured fibrocytes derived from Asxl1-/-Jak2VF BM nucleated cells treated with dimethyl sulfoxide, mouse TNF-a (2 ng/mL), the TNF-a receptor antagonist, R-7050 (1 mM), and mouse TNF-a (2 ng/mL) combined with R-7050 (1 mM) (N=3 per group). Original magnification 20× for images; scale bar, 40 mm. The results are presented as mean ± standard error of mean. A two-tailed unpaired Student t test was performed between means of two groups. *P<0.05, ***P<0.001, ****P<0.0001. EV: empty vector; DMSO: dimethyl sulfoxide; TNF-a: tumor necrosis factor-alpha. shRNA: short hairpin RNA.

Comment in

Similar articles

Cited by

References

    1. Nangalia J, Green AR. Myeloproliferative neoplasms: from origins to outcomes. Blood. 2017;130(23):2475-2483. - PubMed
    1. Tefferi A. Primary myelofibrosis: 2021 update on diagnosis, risk-stratification and management. Am J Hematol. 2021;96(1):145-162. - PubMed
    1. James C, Ugo V, Le Couédic JP, et al. . A unique clonal JAK2 mutation leading to constitutive signalling causes polycythaemia vera. Nature. 2005;434(7037):1144-1148. - PubMed
    1. Pikman Y, Lee BH, Mercher T, et al. . MPLW515L is a novel somatic activating mutation in myelofibrosis with myeloid metaplasia. PLoS Med. 2006;3(7):e270. - PMC - PubMed
    1. Nangalia J, Massie CE, Baxter EJ, et al. . Somatic CALR mutations in myeloproliferative neoplasms with nonmutated JAK2. N Engl J Med. 2013;369(25):2391-2405. - PMC - PubMed

Publication types