

Metabolomics Markers of COVID-19 Are Dependent on Collection Wave
- PMID: 36005585
- PMCID: PMC9415837
- DOI: 10.3390/metabo12080713
Metabolomics Markers of COVID-19 Are Dependent on Collection Wave
Abstract
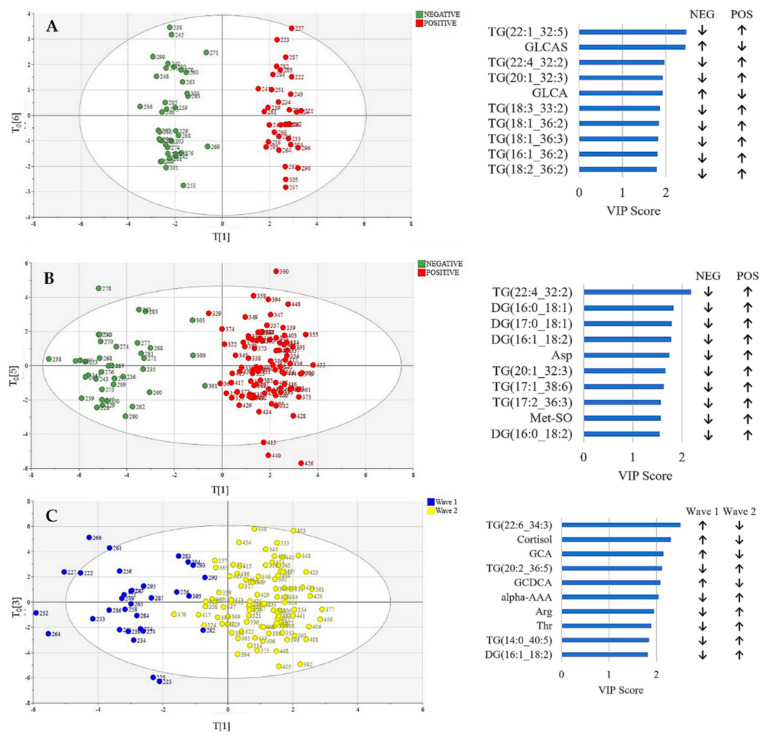
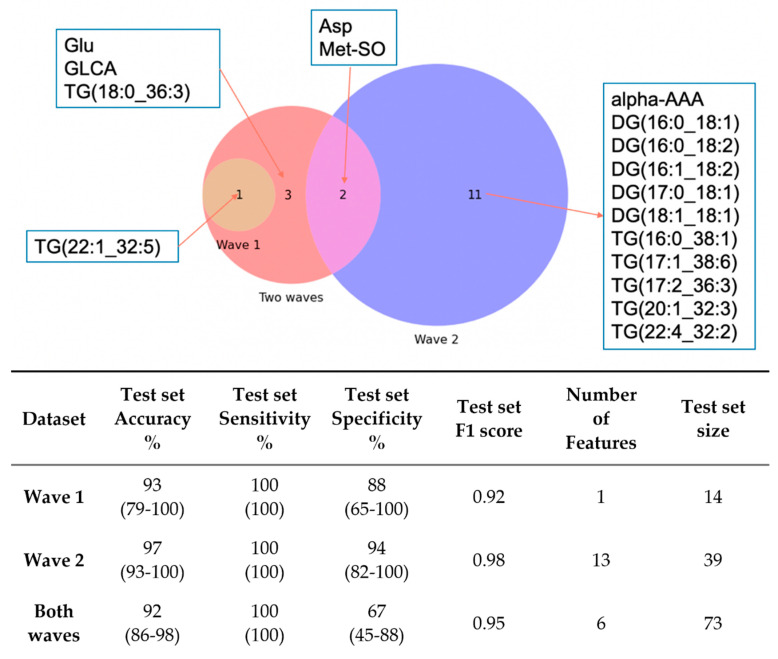
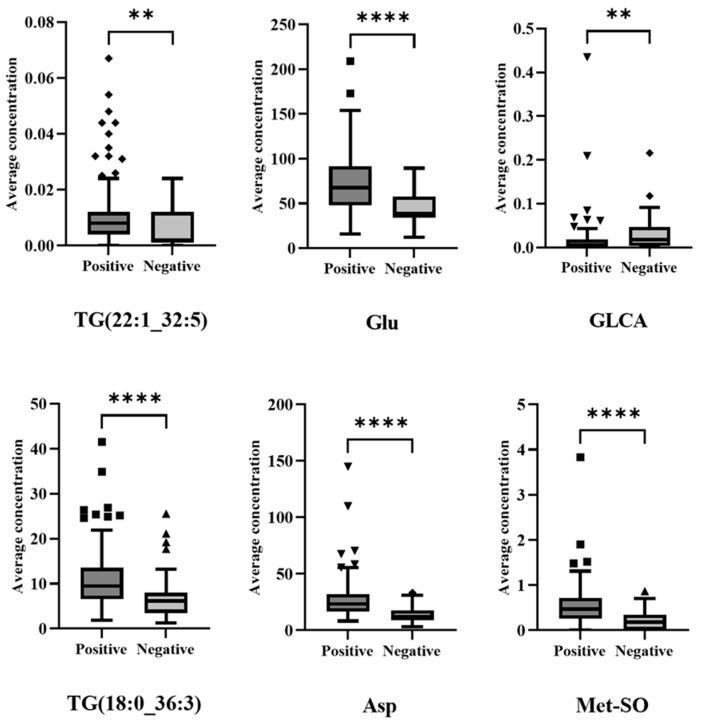
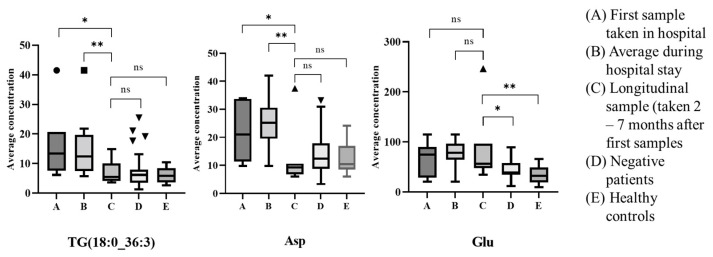
The effect of COVID-19 infection on the human metabolome has been widely reported, but to date all such studies have focused on a single wave of infection. COVID-19 has generated numerous waves of disease with different clinical presentations, and therefore it is pertinent to explore whether metabolic disturbance changes accordingly, to gain a better understanding of its impact on host metabolism and enable better treatments. This work used a targeted metabolomics platform (Biocrates Life Sciences) to analyze the serum of 164 hospitalized patients, 123 with confirmed positive COVID-19 RT-PCR tests and 41 providing negative tests, across two waves of infection. Seven COVID-19-positive patients also provided longitudinal samples 2-7 months after infection. Changes to metabolites and lipids between positive and negative patients were found to be dependent on collection wave. A machine learning model identified six metabolites that were robust in diagnosing positive patients across both waves of infection: TG (22:1_32:5), TG (18:0_36:3), glutamic acid (Glu), glycolithocholic acid (GLCA), aspartic acid (Asp) and methionine sulfoxide (Met-SO), with an accuracy of 91%. Although some metabolites (TG (18:0_36:3) and Asp) returned to normal after infection, glutamic acid was still dysregulated in the longitudinal samples. This work demonstrates, for the first time, that metabolic dysregulation has partially changed over the course of the pandemic, reflecting changes in variants, clinical presentation and treatment regimes. It also shows that some metabolic changes are robust across waves, and these can differentiate COVID-19-positive individuals from controls in a hospital setting. This research also supports the hypothesis that some metabolic pathways are disrupted several months after COVID-19 infection.
Keywords: COVID-19; LC-MS; machine learning; targeted metabolomics.
Conflict of interest statement
The authors declare no conflict of interest.
Figures
References
-
- World Health Organization COVID-19 Weekly Epidemiological Update. [(accessed on 28 July 2022)]. Available online: https://www.who.int/publications/m/item/covid-19-weekly-epidemiological-....
-
- Almazeedi S., Al-Youha S., Jamal M.H., Al-Haddad M., Al-Muhaini A., Al-Ghimlas F., Al-Sabah S. Characteristics, risk factors and outcomes among the first consecutive 1096 patients diagnosed with COVID-19 in Kuwait. EClinicalMedicine. 2020;24:100448. doi: 10.1016/j.eclinm.2020.100448. - DOI - PMC - PubMed
Grants and funding
LinkOut - more resources
Full Text Sources
Miscellaneous
