Weighted Gene Co-Expression Network Analysis and Support Vector Machine Learning in the Proteomic Profiling of Cerebrospinal Fluid from Extraventricular Drainage in Child Medulloblastoma
- PMID: 36005596
- PMCID: PMC9412589
- DOI: 10.3390/metabo12080724
Weighted Gene Co-Expression Network Analysis and Support Vector Machine Learning in the Proteomic Profiling of Cerebrospinal Fluid from Extraventricular Drainage in Child Medulloblastoma
Abstract
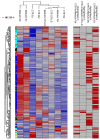
Medulloblastoma (MB) is the most common pediatric malignant central nervous system tumor. Overall survival in MB depends on treatment tuning. There is aneed for biomarkers of residual disease and recurrence. We analyzed the proteome of waste cerebrospinal fluid (CSF) from extraventricular drainage (EVD) from six children bearing various subtypes of MB and six controls needing EVD insertion for unrelated causes. Samples included total CSF, microvesicles, exosomes, and proteins captured by combinatorial peptide ligand library (CPLL). Liquid chromatography-coupled tandem mass spectrometry proteomics identified 3560 proteins in CSF from control and MB patients, 2412 (67.7%) of which were overlapping, and 346 (9.7%) and 805 (22.6%) were exclusive. Multidimensional scaling analysis discriminated samples. The weighted gene co-expression network analysis (WGCNA) identified those modules functionally associated with the samples. A ranked core of 192 proteins allowed distinguishing between control and MB samples. Machine learning highlighted long-chain fatty acid transport protein 4 (SLC27A4) and laminin B-type (LMNB1) as proteins that maximized the discrimination between control and MB samples. Machine learning WGCNA and support vector machine learning were able to distinguish between MB versus non-tumor/hemorrhagic controls. The two potential protein biomarkers for the discrimination between control and MB may guide therapy and predict recurrences, improving the MB patients' quality of life.
Keywords: artificial intelligence; brain tumor; cerebral spinal fluid; extraventricular drainage; mass spectrometry; medulloblastoma; proteomics.
Conflict of interest statement
The authors declare no conflict of interest.
Figures


Similar articles
-
Proteomic Profiling of Cerebrospinal Fluid and Its Extracellular Vesicles from Extraventricular Drainage in Pediatric Pilocytic Astrocytoma, towards Precision Oncology.Cancers (Basel). 2024 Mar 20;16(6):1223. doi: 10.3390/cancers16061223. Cancers (Basel). 2024. PMID: 38539556 Free PMC article.
-
Potential biomarkers of childhood brain tumor identified by proteomics of cerebrospinal fluid from extraventricular drainage (EVD).Sci Rep. 2021 Jan 19;11(1):1818. doi: 10.1038/s41598-020-80647-w. Sci Rep. 2021. PMID: 33469081 Free PMC article.
-
Cerebrospinal fluid cytokines in metastatic group 3 and 4 medulloblastoma.BMC Cancer. 2020 Jun 15;20(1):554. doi: 10.1186/s12885-020-07048-0. BMC Cancer. 2020. PMID: 32539808 Free PMC article.
-
A systematic view of pediatric medulloblastoma proteomics-current state of the field and future directions.Childs Nerv Syst. 2021 Mar;37(3):779-788. doi: 10.1007/s00381-020-04988-7. Epub 2021 Jan 6. Childs Nerv Syst. 2021. PMID: 33409616 Review.
-
Proteome and miRNome profiling of microvesicles derived from medulloblastoma cell lines with stem-like properties reveals biomarkers of poor prognosis.Brain Res. 2020 Mar 1;1730:146646. doi: 10.1016/j.brainres.2020.146646. Epub 2020 Jan 7. Brain Res. 2020. PMID: 31917138 Review.
Cited by
-
Characteristic genes and immune infiltration analysis of gastric cancer based on bioinformatics analysis and machine learning.Discov Oncol. 2025 May 23;16(1):872. doi: 10.1007/s12672-025-02624-x. Discov Oncol. 2025. PMID: 40407862 Free PMC article.
-
Proteomic Profiling of Cerebrospinal Fluid and Its Extracellular Vesicles from Extraventricular Drainage in Pediatric Pilocytic Astrocytoma, towards Precision Oncology.Cancers (Basel). 2024 Mar 20;16(6):1223. doi: 10.3390/cancers16061223. Cancers (Basel). 2024. PMID: 38539556 Free PMC article.
-
Identification of Central Nervous System Oncologic Disease Biomarkers in EVs from Cerebrospinal Fluid (CSF) of Pediatric Patients: A Pilot Neuro-Proteomic Study.Biomolecules. 2023 Nov 30;13(12):1730. doi: 10.3390/biom13121730. Biomolecules. 2023. PMID: 38136601 Free PMC article.
-
Roles, Functions, and Pathological Implications of Exosomes in the Central Nervous System.Int J Mol Sci. 2025 Feb 5;26(3):1345. doi: 10.3390/ijms26031345. Int J Mol Sci. 2025. PMID: 39941112 Free PMC article. Review.
-
Impact of glioma metabolism-related gene ALPK1 on tumor immune heterogeneity and the regulation of the TGF-β pathway.Front Immunol. 2025 Jan 7;15:1512491. doi: 10.3389/fimmu.2024.1512491. eCollection 2024. Front Immunol. 2025. PMID: 39845963 Free PMC article.
References
-
- Louis D.N., Perry A., Wesseling P., Brat D.J., Cree I.A., Figarella-Branger D., Hawkins C., Ng H.K., Pfister S.M., Reifenberger G., et al. The 2021 WHO Classification of Tumors of the Central Nervous System: A summary. Neuro Oncol. 2021;23:1231–1251. doi: 10.1093/neuonc/noab106. - DOI - PMC - PubMed
LinkOut - more resources
Full Text Sources
Molecular Biology Databases
Research Materials
Miscellaneous

