. 2022 Aug 16;12(8):747.
doi: 10.3390/metabo12080747.

Host-Gut Microbiome Metabolic Interactions in PFAS-Impacted Freshwater Turtles (Emydura macquarii macquarii)

Affiliations

Host-Gut Microbiome Metabolic Interactions in PFAS-Impacted Freshwater Turtles (Emydura macquarii macquarii)

David J Beale et al. Metabolites. .

Abstract

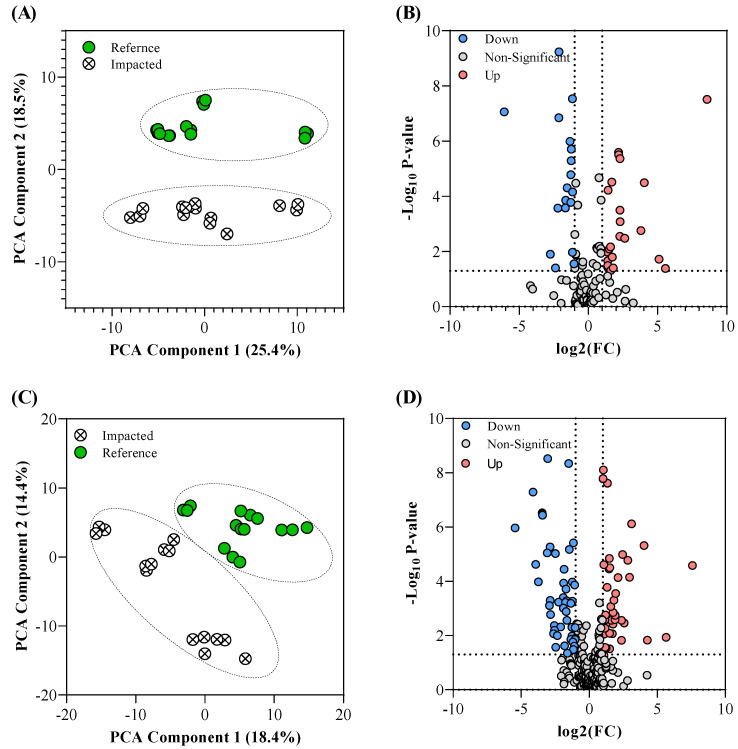
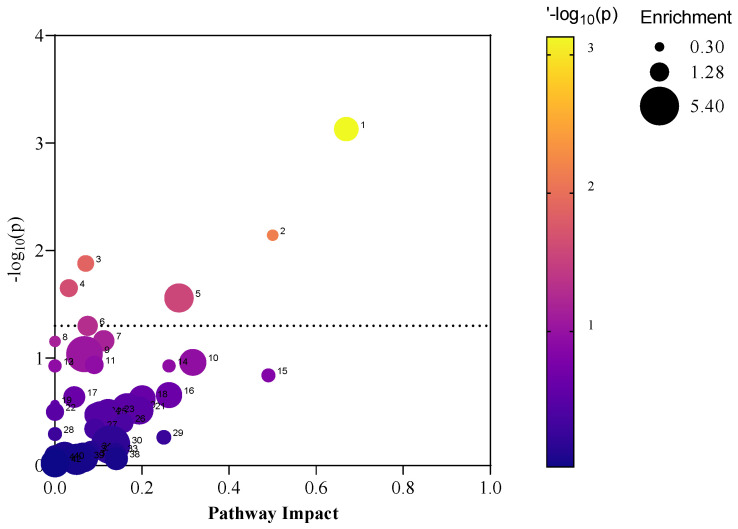
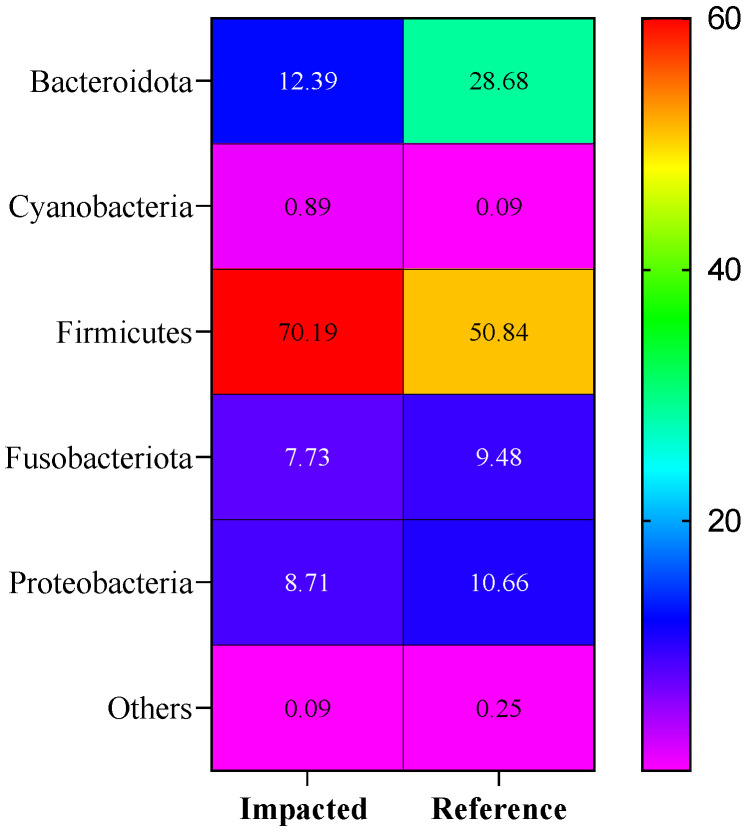
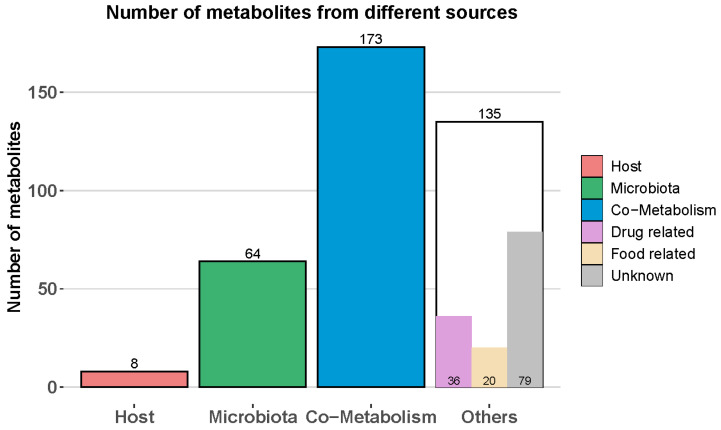
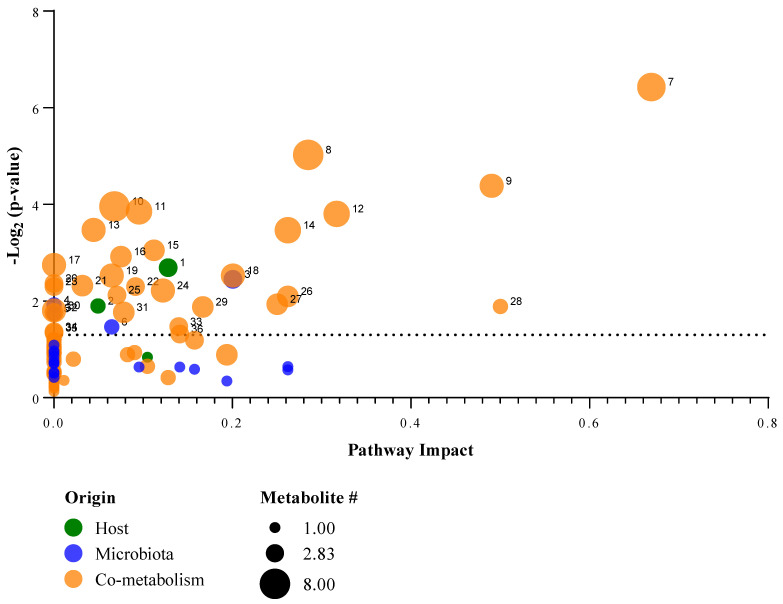
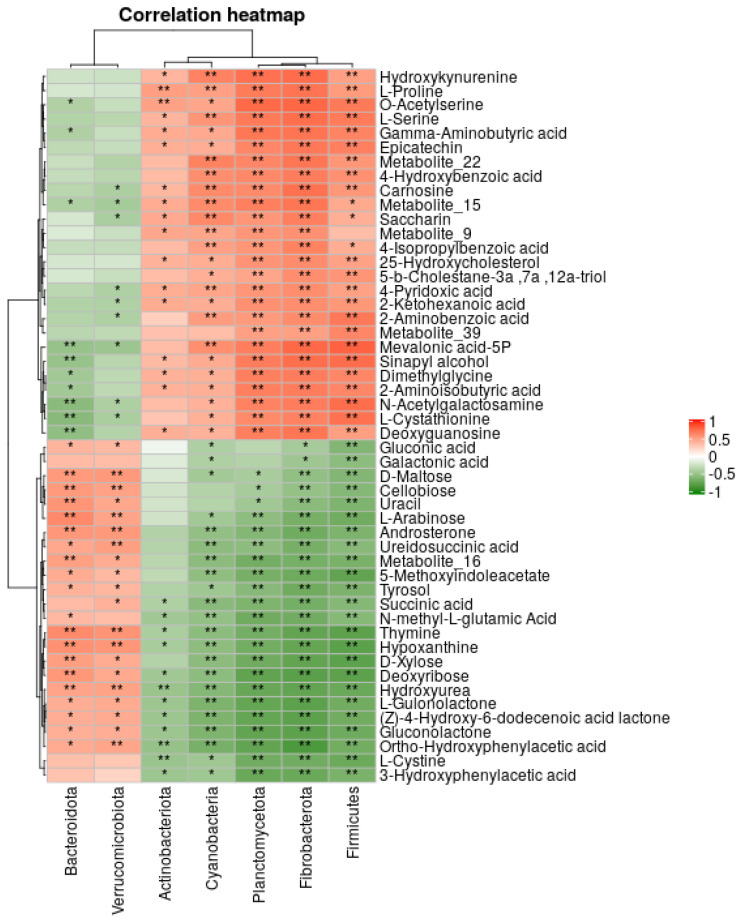
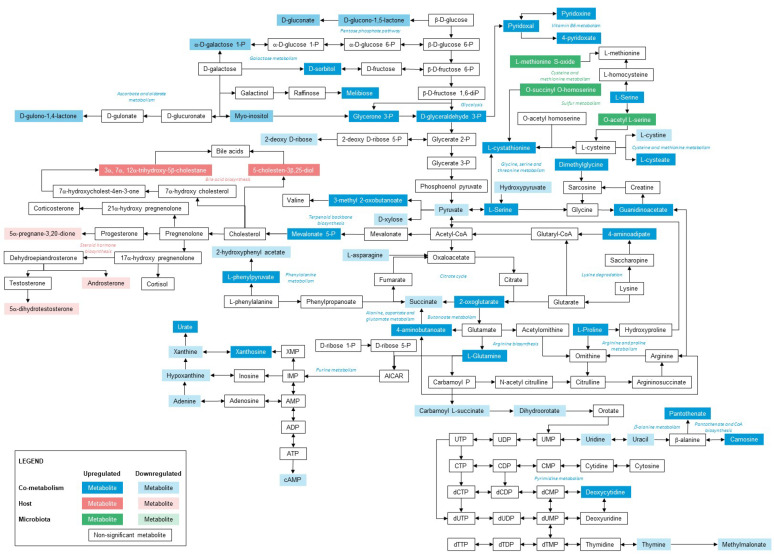
Per-and polyfluoroalkyl substances (PFAS) are a growing concern for humans, wildlife, and more broadly, ecosystem health. Previously, we characterised the microbial and biochemical impact of elevated PFAS on the gut microbiome of freshwater turtles (Emydura macquarii macquarii) within a contaminated catchment in Queensland, Australia. However, the understanding of PFAS impacts on this species and other aquatic organisms is still very limited, especially at the host-gut microbiome molecular interaction level. To this end, the present study aimed to apply these leading-edge omics technologies within an integrated framework that provides biological insight into the host turtle-turtle gut microbiome interactions of PFAS-impacted wild-caught freshwater turtles. For this purpose, faecal samples from PFAS-impacted turtles (n = 5) and suitable PFAS-free reference turtles (n = 5) were collected and analysed. Data from 16S rRNA gene amplicon sequencing and metabolomic profiling of the turtle faeces were integrated using MetOrigin to assign host, microbiome, and co-metabolism activities. Significant variation in microbial composition was observed between the two turtle groups. The PFAS-impacted turtles showed a higher relative abundance of Firmicutes and a lower relative abundance of Bacteroidota than the reference turtles. The faecal metabolome showed several metabolites and pathways significantly affected by PFAS exposure. Turtles exposed to PFAS displayed altered amino acid and butanoate metabolisms, as well as altered purine and pyrimidine metabolism. It is predicted from this study that PFAS-impacted both the metabolism of the host turtle and its gut microbiota which in turn has the potential to influence the host's physiology and health.

Keywords: Emydura macquarii; PFAS; freshwater turtles; metabolomics; microbiome; omics; water pollutants.


Conflict of interest statement

The authors declare no conflict of interest.

Figures

Figure 1
Figure 1
Multivariate comparison of the acquired metabolomic profile data from the reference and PFAS-impacted turtle faecal samples. Panels (A,C) are the Principal Component Analysis (PCA) of the turtle faecal microbiome samples using targeted Central Carbon Metabolism (CCM) metabolites and untargeted polar metabolites, respectively, from the reference site (green circles) and PFAS-impacted site (white crossed-out circles); Panels (B,D) are the volcano plots of the targeted CCM metabolites and untargeted polar metabolites data, respectively, identifying significant metabolites that are downregulated (blue circles) and upregulated (red circles) in the PFAS-impacted faecal samples with respect to the reference faecal samples. Note, a metabolite is considered significant if it is above the defined fold change (FC) threshold of 2.0 and below the p-Value cutoff of 0.05.
Figure 2
Figure 2
Pathway impact analysis using the over-representation enrichment data of the statistically significant metabolites from PFAS-impacted turtle faecal samples. Noting, (1) Alanine, aspartate and glutamate metabolism; (2) D-Glutamine and D-glutamate metabolism; (3) Arginine biosynthesis; (4) Butanoate metabolism; (5) Pyrimidine metabolism; and (6) Pantothenate and CoA biosynthesis. Note, Supplementary Table S4 provides names for the pathway features annotated 6–42.
Figure 3
Figure 3
Relative bacterial phylum abundance in sampled freshwater turtle faeces per PFAS-impacted (n = 5 turtles) and reference (n = 5 turtles) site. Supplementary Table S5 provides the data to support this figure. Scale is relative abundance reported as a percentage (%).
Figure 4
Figure 4
Number of identified metabolites from different sources as determined by MetOrigin (2.0) performed against the Chrysemys picta (Western Painted turtle) genome.
Figure 5
Figure 5
Pathway impact plot of the host–microbiome metabolic function metabolites. Noting, (1) steroid hormone biosynthesis; (2) tryptophan metabolism; (3) primary bile acid biosynthesis; (4) cysteine and methionine metabolism; (5) sulfur metabolism; (6) toluene degradation; (7) tyrosine metabolism (microbiota); (8) alanine, aspartate and glutamate metabolism; (9) pyrimidine metabolism; (10) vitamin B6 metabolism; (11) purine metabolism; (12) galactose metabolism; (13) glycine, serine and threonine metabolism; (14) pentose phosphate pathway; (15) glyoxylate and dicarboxylate metabolism; (16) beta-alanine metabolism; (17) pantothenate and CoA biosynthesis; (18) nicotinate and nicotinamide metabolism; (19) cysteine and methionine metabolism; (20) tyrosine metabolism (co-metabolism); (21) taurine and hypotaurine metabolism; (22) butanoate metabolism; (23) citrate cycle (TCA cycle); (24) carbon fixation in photosynthetic organisms; (25) arginine and proline metabolism; (26) arginine biosynthesis; (27) phenylalanine metabolism; (28) ascorbate and aldarate metabolism; (29) D-glutamine and D-glutamate metabolism; (30) aminoacyl-tRNA biosynthesis; (31) methane metabolism; (32) pentose and glucuronate interconversions; (33) glycolysis/gluconeogenesis; (34) terpenoid backbone biosynthesis; (35) carbon fixation pathways in prokaryotes; (36) inositol phosphate metabolism; and (37) lysine degradation.
Figure 6
Figure 6
Microbiome community (at the phylum level) and expressed metabolite correlation analysis. Note, single asterisk (*) denotes a significance level of <0.05; a double asterisk (**) denotes a significance level of <0.01. Supplementary Figure S3 illustrates the correlation analysis at the species level.
Figure 7
Figure 7
Pathway map highlighting the key pathways annotated to the host, microbiota, and co-metabolic activities of the PFAS-impacted turtles in relation to the reference turtle samples. Noting, the list of all significant metabolic pathways, metabolites involved and their KEGG IDs are enlisted in Supplementary Table S7.

References

    1. Georges A. Setting conservation priorities for Australian freshwater turtles. In: Lunney D., Ayers D., editors. Herpetology in Australia: A Diverse Discipline. Royal Zoological Society of New South Wales; Sydney, Australia: 1993. pp. 49–58.
    1. Georges A., Thomson S. Diversity of Australasian freshwater turtles, with an annotated synonymy and keys to species. Zootaxa. 2010;2496:1–37. doi: 10.11646/zootaxa.2496.1.1. - DOI
    1. Government Q. Species Profile—Emydura macquarii macquarii (Murray Turtle) [(accessed on 10 May 2022)];2022 Available online: https://apps.des.qld.gov.au/species-search/details/?id=43.
    1. Chessman B.C. Declines of freshwater turtles associated with climatic drying in Australia’s Murray–Darling Basin. Wildl. Res. 2011;38:664–671. doi: 10.1071/WR11108. - DOI
    1. Van Dyke J.U., Spencer R.J., Thompson M.B., Chessman B., Howard K., Georges A. Conservation implications of turtle declines in Australia’s Murray River system. Sci. Rep. 2019;9:1998. doi: 10.1038/s41598-019-39096-3. - DOI - PMC - PubMed

LinkOut - more resources