. 2022 Aug 19;12(8):764.
doi: 10.3390/metabo12080764.

Impact of Maternal Obesity on the Gestational Metabolome and Infant Metabolome, Brain, and Behavioral Development in Rhesus Macaques

Affiliations

Impact of Maternal Obesity on the Gestational Metabolome and Infant Metabolome, Brain, and Behavioral Development in Rhesus Macaques

Yu Hasegawa et al. Metabolites. .

Abstract

Maternal gestational obesity is associated with elevated risks for neurodevelopmental disorder, including autism spectrum disorder. However, the mechanisms by which maternal adiposity influences fetal developmental programming remain to be elucidated. We aimed to understand the impact of maternal obesity on the metabolism of both pregnant mothers and their offspring, as well as on metabolic, brain, and behavioral development of offspring by utilizing metabolomics, protein, and behavioral assays in a non-human primate model. We found that maternal obesity was associated with elevated inflammation and significant alterations in metabolites of energy metabolism and one-carbon metabolism in maternal plasma and urine, as well as in the placenta. Infants that were born to obese mothers were significantly larger at birth compared to those that were born to lean mothers. Additionally, they exhibited significantly reduced novelty preference and significant alterations in their emotional response to stress situations. These changes coincided with differences in the phosphorylation of enzymes in the brain mTOR signaling pathway between infants that were born to obese and lean mothers and correlated with the concentration of maternal plasma betaine during pregnancy. In summary, gestational obesity significantly impacted the infant systemic and brain metabolome and adaptive behaviors.

Keywords: NMR; behavior; brain; infant development; metabolomics; obesity; placenta; plasma; pregnancy; urine.


Conflict of interest statement

The authors declare no conflict of interest.

Figures

Figure 1
Figure 1
Metabolic characteristics of the Lean and Obese mothers throughout pregnancy. (a) GWG rate between the last day before conception and delivery. t-tests were used to test for group differences in the overall GWG rate. (b) Line plot representing the mean ± SE of HOMA-IR values throughout pregnancy. (c) Plasma hs-CRP level. For (b,c), a linear mixed-effects model was fit followed by ANOVA to test for group differences in HOMA-IR and hs-CRP, and pairwise comparisons were done as post hoc tests using the estimated marginal means. For box plots (a,c), each dot represents data from an individual animal. Top and bottom of the boxes represent the 25th and 75th percentiles respectively; the middle line represents the median; and the top and bottom whiskers represent maximum and minimum values. Points outside of the whiskers represent outliers. Statistical significance is indicated with “*”. The red and blue lines correspond to the Lean and Obese groups, respectively. Sample size: Lean = 6, Obese = 7. Abbreviations: d or R2, effect size measurements; GWG, gestational weight gain; GD, gestational day; HOMA-IR, homeostatic model assessment for insulin resistance; SE, standard error, hs-CRP, high-sensitivity C-reactive protein.
Figure 2
Figure 2
Impact of maternal obesity on energy metabolism that is reflected in the plasma and urine metabolomes during pregnancy. The trends that were found in the Obese group compared to the Lean group are denoted with open blue arrows. Line plots represent the concentrations of plasma or urine metabolites at each time point (mean ± SE). Metabolites that were profiled in this project are in bold. A linear mixed-effects model was fitted followed by ANOVA to test for group difference, and pairwise comparison was done as a post hoc test using the estimated marginal means. The red and blue lines correspond to the Lean and Obese groups, respectively. Statistical significance is indicated with “*”. The sample sizes of the plasma samples are Lean (n = 4 at GD45 & GD90, n = 5 at GD120, n = 6 at GD150) and Obese (n = 7); and urine samples are Lean (n = 4 at GD45 & GD90 & GD150, n = 5 at GD120) and Obese (n = 7). Abbreviations: R2, effect size measurement; TCA, tricarboxylic acid; GD, gestational day.
Figure 3
Figure 3
Impact of maternal obesity on one-carbon metabolism that was reflected in the plasma and urine metabolomes during pregnancy. (a) Schematic summary of the trends that were found in the metabolites of the one-carbon metabolism pathway, where the arrow indicates an increase (up), decrease (down) or no difference (horizontal) in mothers in the Obese group compared to the Lean group. Plasma is indicated with an open arrow, urine with a solid arrow, and placenta with a thin arrow. Metabolites that were profiled in this study are in bold. (bi) Line plots showing the concentration of plasma (b) choline, (c) betaine, (d) DMG; urinary (e) betaine, (f) DMG; placental (g) choline, (h) betaine, and (i) glutathione (mean ± SE). A linear mixed-effects model was fitted followed by an ANOVA to test the group difference in the concentrations of plasma and urine metabolites, and pairwise comparison was done as a post hoc test using the estimated marginal means. t-tests were used to test for group differences in the concentrations of placental metabolites. The red and blue lines correspond to the Lean and Obese groups, respectively. Statistical significance is indicated with “*”. The sample size of plasma samples are: Lean (n = 4 at GD45 & GD90, n = 5 at GD120, n = 6 at GD150) and Obese (n = 7); urine samples are Lean (n = 4 at GD45 & GD90 & GD150, n = 5 at GD120) and Obese (n = 7); and placental samples are Lean (n = 2) and Obese (n = 4). Abbreviations: d or R2, effect size measurements; GD, gestational day; DMG, N,N-dimethylglycine; SAM, S-adenosylmethionine; PE, phosphatidylethanolamine; PC, Phosphatidylcholine; SAH, S-adenosylhomocysteine; Eff, effect size; SE, standard error.
Figure 4
Figure 4
Comparison of the placental size and HOMA-IR in obese and lean mothers. (a) Line plot representing EPV over pregnancy. A linear mixed-effects model was fit followed by ANOVA to test for group differences, and a pairwise comparison was done as a post hoc test using the estimated marginal means. The data are expressed as the mean ± SE. (b) Repeated measures correlation between EPV and HOMA-IR. Each dot represents data from one time point from an animal. Each line represents a Pearson correlation fit for each animal, and different samples are represented by different colors. The sample size is the same as described in the caption of Figure 3. Abbreviations: R, effect size measurement; GD, gestational day; EPV, estimated placental volume; HOMA-IR, homeostatic model assessment for insulin resistance.
Figure 5
Figure 5
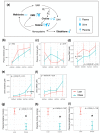
Maternal obesity led to larger infants at birth with altered metabolomic profiles. (a) Infant weight at PD7. (b) Correlation between maternal HOMA-IR at GD150 and infant weight at PD7. The black line represents the Pearson correlation regression line, and the gray area represents the 95% confidence interval. The seven-digit numbers correspond to Mother ID. Line plots of the concentrations of infant plasma (c) 2-hydroxyisovalerate from PD30 to PD180, and (d) cortisol over four sampling time points. (e) Box plot representing the suppression in plasma cortisol level made by Dex (Sample 3/Sample 2). t-tests were used to test for group differences of samples that were collected at a single time point (a,e) and statistical significance is indicated with a “*”. Data are expressed as the mean ± SE. A linear mixed-effects model was fit followed by ANOVA to test the group difference of samples with multiple time points (c,d), and pairwise comparisons were done as post hoc tests using the estimated marginal means. For box plots (a,e), each dot represents data from an individual animal. Top and bottom of the boxes represent the 25th and 75th percentiles respectively; the middle line represents the median; and the top and bottom whiskers represent maximum and minimum values. Points outside of the whiskers represent outliers. Red and blue dots/lines correspond to the Lean and Obese groups, respectively. Sample size is Lean = 6, Obese = 7. Abbreviations: d, R, or R2, effect size measurements; PD, postnatal day.
Figure 6
Figure 6
Infants that were born to Obese mothers showed elevated levels of mTOR phosphorylated proteins in the prefrontal cortex. The overall scheme of the mTOR pathway with normalized phosphorylation levels (phospho-protein/total-protein) of Akt, AMPK, and p70-S6K that were measured in the prefrontal cortex. t-tests were used to test for group differences and statistical significance between groups is denoted with an asterisk. The data are expressed as the mean ± SE, and the red and blue bars correspond to the Lean and Obese groups, respectively. The trends that were found in the brains of infants from the Obese group compared to the Lean group are denoted with blue open arrows. Statistical significance is indicated with “*”. For box plots, each dot represents data from an individual animal. Top and bottom of the boxes represent the 25th and 75th percentiles respectively; the middle line represents the median; and the top and bottom whiskers represent maximum and minimum values. Points outside of the whiskers represent outliers. The sample size is Lean = 6, Obese = 7. Abbreviations: TSC1/2, Tuberous sclerosis proteins 1 and 2; Rheb, Ras homolog enriched in brain; Eff, effect size.
Figure 7
Figure 7
Assessment of brain function in offspring. (a) Proportional fixation count (%) at the novel object in the VPC test that was applied to infants at PD30. (b) Correlation between the pre-conceptional weight and the proportional fixation count at a novel object. (c) Correlation between the maternal plasma betaine level at GD90 and the proportional fixation count at a novel object. In (b,c), the black line represents the Pearson correlation regression line, and the gray area represents the 95% confidence interval. (d) Results of the HI test at PD110. Profile-Far (a technician presented the profile face from ~1 m away from the infant in a cage); Profile-Near (profile face presented from 0.3 m away); Stare-Far (a technician stared into the eyes of the infant from ~1 m away); Stare-Near (stared from 0.3 m away). t-tests were used to test for group differences in (a,c). For box plots (a,d), each dot represents data from an individual animal. Top and bottom of the boxes represent the 25th and 75th percentiles respectively; the middle line represents the median; and the top and bottom whiskers represent maximum and minimum values. Points outside of the whiskers represent outliers. Statistical significance is indicated with “*”. The data are expressed as the mean ± SE, and the red and blue bars correspond to the Lean and Obese groups, respectively. Sample size: Lean = 6, Obese = 7. Abbreviations: Eff, effect size; d or R, effect size measurements; VPC, Visual Paired-Comparison; HI test, Human Intruder test; PD, postnatal day.

Similar articles

Cited by

References

    1. Hales C.M., Carroll M.D., Fryar C.D., Ogden C.L. Prevalence of Obesity and Severe Obesity Among Adults: United States, 2017–2018. NCHS Data Brief. 2020;360:1–8. - PubMed
    1. Flegal K.M., Carroll M.D., Kit B.K., Ogden C.L. Prevalence of Obesity and Trends in the Distribution of Body Mass Index among US Adults, 1999–2010. JAMA. 2012;307:491–497. doi: 10.1001/jama.2012.39. - DOI - PubMed
    1. Krakowiak P., Walker C.K., Bremer A.A., Baker A.S., Ozonoff S., Hansen R.L., Hertz-Picciotto I. Maternal Metabolic Conditions and Risk for Autism and Other Neurodevelopmental Disorders. Pediatrics. 2012;129:e1121–e1128. doi: 10.1542/peds.2011-2583. - DOI - PMC - PubMed
    1. Deregnier R.-A., Nelson C.A., Thomas K.M., Wewerka S., Georgieff M.K. Neurophysiologic evaluation of auditory recognition memory in healthy newborn infants and infants of diabetic mothers. J. Pediatr. 2000;137:777–784. doi: 10.1067/mpd.2000.109149. - DOI - PubMed
    1. Georgieff M.K., Ramel S.E., Cusick S.E. Nutritional influences on brain development. Acta Paediatr. 2018;107:1310–1321. doi: 10.1111/apa.14287. - DOI - PMC - PubMed