The PROVIT Study-Effects of Multispecies Probiotic Add-on Treatment on Metabolomics in Major Depressive Disorder-A Randomized, Placebo-Controlled Trial
- PMID: 36005642
- PMCID: PMC9414726
- DOI: 10.3390/metabo12080770
The PROVIT Study-Effects of Multispecies Probiotic Add-on Treatment on Metabolomics in Major Depressive Disorder-A Randomized, Placebo-Controlled Trial
Abstract
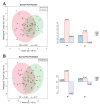
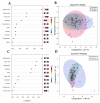
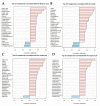
The gut-brain axis plays a role in major depressive disorder (MDD). Gut-bacterial metabolites are suspected to reduce low-grade inflammation and influence brain function. Nevertheless, randomized, placebo-controlled probiotic intervention studies investigating metabolomic changes in patients with MDD are scarce. The PROVIT study (registered at clinicaltrials.com NCT03300440) aims to close this scientific gap. PROVIT was conducted as a randomized, single-center, double-blind, placebo-controlled multispecies probiotic intervention study in individuals with MDD (n = 57). In addition to clinical assessments, metabolomics analyses (1H Nuclear Magnetic Resonance Spectroscopy) of stool and serum, and microbiome analyses (16S rRNA sequencing) were performed. After 4 weeks of probiotic add-on therapy, no significant changes in serum samples were observed, whereas the probiotic groups' (n = 28) stool metabolome shifted towards significantly higher concentrations of butyrate, alanine, valine, isoleucine, sarcosine, methylamine, and lysine. Gallic acid was significantly decreased in the probiotic group. In contrast, and as expected, no significant changes resulted in the stool metabolome of the placebo group. Strong correlations between bacterial species and significantly altered stool metabolites were obtained. In summary, the treatment with multispecies probiotics affects the stool metabolomic profile in patients with MDD, which sets the foundation for further elucidation of the mechanistic impact of probiotics on depression.
Keywords: NMR spectroscopy; butyrate; depression; gut–brain-axis; metabolomics; probiotics; randomized controlled trial.
Conflict of interest statement
The probiotics were provided, a study nurse and microbiome analysis were funded by Allergosan. The Institute of Allergosan did not take part in the recruitment and Metabolomics data analysis. All authors declare no C.O.I.
Figures


Similar articles
-
PROVIT-CLOCK: A Potential Influence of Probiotics and Vitamin B7 Add-On Treatment and Metabolites on Clock Gene Expression in Major Depression.Neuropsychobiology. 2024;83(3-4):135-151. doi: 10.1159/000538781. Epub 2024 May 22. Neuropsychobiology. 2024. PMID: 38776887 Free PMC article. Clinical Trial.
-
Gut microbiota indole-3-propionic acid mediates neuroprotective effect of probiotic consumption in healthy elderly: A randomized, double-blind, placebo-controlled, multicenter trial and in vitro study.Clin Nutr. 2023 Jun;42(6):1025-1033. doi: 10.1016/j.clnu.2023.04.001. Epub 2023 May 2. Clin Nutr. 2023. PMID: 37150125 Clinical Trial.
-
Interleukin-6 Gene Expression Changes after a 4-Week Intake of a Multispecies Probiotic in Major Depressive Disorder-Preliminary Results of the PROVIT Study.Nutrients. 2020 Aug 26;12(9):2575. doi: 10.3390/nu12092575. Nutrients. 2020. PMID: 32858844 Free PMC article. Clinical Trial.
-
Major Depressive Disorder and gut microbiota - Association not causation. A scoping review.Prog Neuropsychopharmacol Biol Psychiatry. 2021 Mar 2;106:110111. doi: 10.1016/j.pnpbp.2020.110111. Epub 2020 Sep 23. Prog Neuropsychopharmacol Biol Psychiatry. 2021. PMID: 32976952
-
Microbiota Diversity and Inflammation as a New Target to Improve Mood: Probiotic Use in Depressive Disorder.Psychiatr Danub. 2023 Oct;35(Suppl 2):72-76. Psychiatr Danub. 2023. PMID: 37800206 Review.
Cited by
-
Gut microbiota metabolites, redox status, and the related regulatory effects of probiotics.Heliyon. 2023 Oct 29;9(11):e21431. doi: 10.1016/j.heliyon.2023.e21431. eCollection 2023 Nov. Heliyon. 2023. PMID: 38027795 Free PMC article. Review.
-
Reduced olfactory performance is associated with changed microbial diversity, oralization, and accumulation of dead biomaterial in the nasal olfactory area.Microbiol Spectr. 2024 Feb 6;12(2):e0154923. doi: 10.1128/spectrum.01549-23. Epub 2024 Jan 9. Microbiol Spectr. 2024. PMID: 38193689 Free PMC article.
-
Strain-specific effects of probiotics on depression and anxiety: a meta-analysis.Gut Pathog. 2024 Sep 8;16(1):46. doi: 10.1186/s13099-024-00634-8. Gut Pathog. 2024. PMID: 39245752 Free PMC article.
-
Depression and the Aberrant Intestinal Microbiome.Gastroenterol Hepatol (N Y). 2024 Jan;20(1):30-40. Gastroenterol Hepatol (N Y). 2024. PMID: 38405047 Free PMC article.
-
Effectiveness of Psychobiotics in the Treatment of Psychiatric and Cognitive Disorders: A Systematic Review of Randomized Clinical Trials.Nutrients. 2024 Apr 30;16(9):1352. doi: 10.3390/nu16091352. Nutrients. 2024. PMID: 38732599 Free PMC article.
References
-
- DGPPN S3-Leitlinie/Nationale VersorgungsLeitlinie Unipolare Depression Langfassung. 2015. [(accessed on 15 July 2022)]. Available online: https://www.dgppn.de/_Resources/Persistent/d689bf8322a5bf507bcc546eb9d61....
-
- Howard D.M., Adams M.J., Clarke T.K., Hafferty J.D., Gibson J., Shirali M., Coleman J.R.I., Hagenaars S.P., Ward J., Wigmore E.M., et al. Genome-Wide Meta-Analysis of Depression Identifies 102 Independent Variants and Highlights the Importance of the Prefrontal Brain Regions. Nat. Neurosci. 2019;22:343–352. doi: 10.1038/s41593-018-0326-7. - DOI - PMC - PubMed
Grants and funding
LinkOut - more resources
Full Text Sources
Other Literature Sources
Miscellaneous

