. 2022 Aug 1;12(8):759.
doi: 10.3390/membranes12080759.

Studies of Protein Wastes Adsorption by Chitosan-Modified Nanofibers Decorated with Dye Wastes in Batch and Continuous Flow Processes: Potential Environmental Applications

Affiliations

Studies of Protein Wastes Adsorption by Chitosan-Modified Nanofibers Decorated with Dye Wastes in Batch and Continuous Flow Processes: Potential Environmental Applications

Dai-Lun Cai et al. Membranes (Basel). .

Abstract

In this study, reactive green 19 dye from wastewater was immobilized on the functionalized chitosan nanofiber membranes to treat soluble microbial proteins in biological wastewater. Polyacrylonitrile nanofiber membrane (PAN) was prepared by the electrospinning technique. After heat treatment, alkaline hydrolysis, and chemically grafted with chitosan to obtain modified chitosan nanofibers (P-COOH-CS), and finally immobilized with RG19 dye, dyed nanofibers were generated (P-COOH-CS-RG19). The synthesis of P-COOH-CS and P-COOH-CS-RG19 are novel materials for protein adsorption that are not deeply investigated currently, with each of the material functions based on their properties in significantly improving the adsorption efficiency. The nanofiber membrane shows good adsorption capacity and great recycling performance, while the application of chitosan and dye acts as the crosslinker in the nanofiber membrane and consists of various functional groups to enhance the adsorption of protein. The dyed nanofibers were applied for the batch adsorption of soluble protein (i.e., lysozyme), and the process parameters including chitosan's molecular weight, coupling pH, chitosan concentration, dye pH, dye concentration, and lysozyme pH were studied. The results showed that the molecular weight of chitosan was 50 kDa, pH 5, concentration 0.5%, initial concentration of dye at 1 mg/mL dye and pH 12, lysozyme solution at 2 mg/mL at pH 8, and the maximum adsorption capacity was 1293.66 mg/g at a temperature of 318 K. Furthermore, thermodynamic, and kinetic studies suggested that the adsorption behavior of lysozyme followed the Langmuir adsorption isotherm model and the pseudo-second-order kinetic model. The optimal adsorption and desorption conditions based on batch experiments were directly applied to remove lysozyme in a continuous operation. This study demonstrated the potential of dyed nanofibers as an efficient adsorbent to remove approximately 100% of lysozyme from the simulated biological wastewater.

Keywords: chitosan; lysozyme; nanofiber membrane; reactive green 19 dye; removal.


Conflict of interest statement

The authors declare no conflict of interest.

Figures
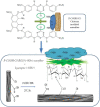
Figure 1
Figure 1
Illustrates the attachment of lysozyme onto the P-COOH-CS-RG19 nanofiber membrane.
Figure 2
Figure 2
FTIR spectra of (a) PAN, (b) P-COOH, (c) P-COOH-CS, (d) P-COOH-CS-RG19.
Figure 3
Figure 3
SEM images of (a) PAN, (b) P-COOH, (c) P-COOH-CS, and (d) P-COOH-CS-RG19. Bar scale: 1000 nm.
Figure 4
Figure 4
TGA curves of (a) PAN, (b) P-COOH, (c) P-COOH-CS, and (d) P-COOH-CS-RG19.
Figure 5
Figure 5
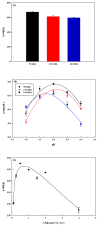
The effect of (a) molecular weight of chitosan, (b) solution pH, and (c) concentration of chitosan (CS) coupled with P-COOH nanofiber membrane on the adsorption capacity for lysozyme.
Figure 6
Figure 6
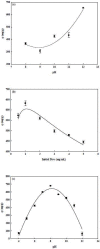
The effect of (a) dye solution pH, (b) initial dye concentration, and (c) lysozyme adsorption pH on the adsorption capacity for lysozyme.
Figure 7
Figure 7
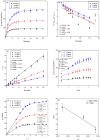
(a) Adsorption rates for lysozyme by P-COOH-CS-RG19. Kinetic adsorption of lysozyme fitted by (b) pseudo first-order model, (c) pseudo-second-order model, and (d) Intraparticle diffusion model. (e) membrane surface diffusion and intra-particle (membrane) diffusion. (f) the activation energy for the adsorption of lysozyme.
Figure 8
Figure 8
(a) Effect of temperature on the equilibrium isotherm curves for the adsorption of lysozyme on P-COOH-CS-RG19 nanofiber membrane, (b) Langmuir model plot of C*/q* against C*, (c) Freundlich model plot of ln(q*) against ln(C*), (d) Temkin model plot of q* against ln(C*), and (e) Van ’t Hoff plot for the adsorption of lysozyme on P-COOH-CS-RG19 nanofiber membrane.
Figure 8
Figure 8
(a) Effect of temperature on the equilibrium isotherm curves for the adsorption of lysozyme on P-COOH-CS-RG19 nanofiber membrane, (b) Langmuir model plot of C*/q* against C*, (c) Freundlich model plot of ln(q*) against ln(C*), (d) Temkin model plot of q* against ln(C*), and (e) Van ’t Hoff plot for the adsorption of lysozyme on P-COOH-CS-RG19 nanofiber membrane.
Figure 9
Figure 9
(a) Elution efficiency (E) for the adsorbed lysozyme from the P-COOH-CS-RG19 nanofiber membrane by a step-wise elution method (i.e., S: 0–1 M NaCl), (b) Linear plot of S/E against E.
Figure 10
Figure 10
Continuous flow process for the removal of lysozyme by P-COOH-CS-RG19 nanofiber membrane (one piece membrane 0.03 g, effective area 3.7 cm2): (a) pH (7–9) at a constant lysozyme concentration (2.0 mg/mL) and flow rate (0.5 mL/min), (b) lysozyme concentration (0.5–2.0 mg/mL) at a constant pH 9 and flow rate 0.5 mL/min, (c) flow rate (0.1–1.0 mL/min) at a constant pH 9 and concentration 2.0 mg/mL.
Figure 10
Figure 10
Continuous flow process for the removal of lysozyme by P-COOH-CS-RG19 nanofiber membrane (one piece membrane 0.03 g, effective area 3.7 cm2): (a) pH (7–9) at a constant lysozyme concentration (2.0 mg/mL) and flow rate (0.5 mL/min), (b) lysozyme concentration (0.5–2.0 mg/mL) at a constant pH 9 and flow rate 0.5 mL/min, (c) flow rate (0.1–1.0 mL/min) at a constant pH 9 and concentration 2.0 mg/mL.
Figure 11
Figure 11
(a) BV, (b) MTZ, (c) MEAR, (d) RE (%) obtained under different conditions in different flow processes.

Similar articles

Cited by

References

    1. Blackburn R.S. Natural polysaccharides and their interactions with dye molecules: Applications in effluent treatment. Environ. Sci. Technol. 2004;38:4905–4909. doi: 10.1021/es049972n. - DOI - PubMed
    1. Donia A.M., Atia A.A., Al-Amrani W.A., El-Nahas A.M. Effect of structural properties of acid dyes on their adsorption behaviour from aqueous solutions by amine modified silica. J. Hazard. Mater. 2009;161:1544–1550. doi: 10.1016/j.jhazmat.2008.05.042. - DOI - PubMed
    1. Meléndez-Ortiz H.I., Puente-Urbina B., Mercado-Silva J.A., García-Uriostegui L. Adsorption performance of mesoporous silicas towards a cationic dye. Influence of mesostructure on adsorption capacity. Int. J. Appl. Ceram. Technol. 2019;16:1533–1543. doi: 10.1111/ijac.13179. - DOI
    1. Matilainen A., Vepsäläinen M., Sillanpää M. Natural organic matter removal by coagulation during drinking water treatment: A review. Adv. Colloid Interface Sci. 2010;159:189–197. doi: 10.1016/j.cis.2010.06.007. - DOI - PubMed
    1. Kunacheva C., Stuckey D.C. Analytical methods for soluble microbial products (SMP) and extracellular polymers (ECP) in wastewater treatment systems: A review. Water Res. 2014;61:1–18. doi: 10.1016/j.watres.2014.04.044. - DOI - PubMed

LinkOut - more resources